The interaction of Fe thin layers between MgO(100)-MgO and MgO(100)-Ag surfaces.
Abstract
The atomic interaction and magnetic properties of ultrathin Fe films grown on cleaved and polished MgO(100) surfaces were studied by conversion electron Mössbauer spectroscopy (CEMS) in broad temperature range. Fe with different layer thickness was deposited on MgO substrates. The layers were formed on polished and cleaved substrate surfaces at RT. The analysis of the spectra showed no Fe-O2- interaction in MgO/Fe interface. Iron layers showed different magnetic anisotropy depending on their thickness.
keywords:
Surface structure Surface electronic state Mössbauer effectPACS:
71.20 Be 71.70Gm 73.20.-r 73.40.NS1 Introduction
Magnetic tunnel junctions are the key effect in the development of magnetoelectronic devices. They operate using as spin-dependent tunnel magnetoresistance effect. The Fe/MgO/Fe(001) system is currently under scope since theoretical calculations predicted a very high tunneling magnetic resistance[1]. Numerous experimental and theoretical works showed that the key role of the nature of tunneling processes are the electronic structure at the metal - insulator interface. Some authors observed FeO formation on the surface [3, 4, 5, 6, 7], others observed and calculated no or very weak interaction between Fe and O2- ions[8, 9, 10, 11, 12, 13] depending on the preparation mode. Therefore, the determination of the interaction between Fe and the surrounding layers is, an important and open question. Mössbauer spectroscopy using 57Fe offers the real suitable technique to determine the atomic interactions at the interfaces [15, 16] and the results may explain the reason of the discrepancies existing in earlier studies. Fe film can be deposited on the substrate and covered by different layers. We have chosen MgO(100) substrate and covered the deposited 57Fe by MgO or Ag layers. Fe and Ag is immiscible and the interaction between the layers earlier has been studied [17, 18, 19]. Our main aim was to determine the interaction of Fe on the MgO/Fe/MgO interfaces on polished and cleaved MgO(100) substrates. Also, the deposited iron was also covered with Ag to compare the difference of MgO and Ag cover. The measurements were made down to 15 K.
2 Experimental Details
The 57Fe layers were deposited on the surface of polished and cleaved
(ex situ) MgO(100) single crystals cleaned properly. The
substrates were UHV annealed prior to the depositions in the
pretreatment chamber of the MBE (MECA 2000) system at 990 K for 30
min. The base pressure in the chambers was 1x10⁻¹⁰ Torr and
increased to 2x10⁻⁹ Torr during the depositions. Series of
samples containing 3 to 10 ML Fe.
57Fe were grown at the rate of 0.025 ML/s. Multilayer 57Fe samples
were deposited first on the MgO(100) substrates and covered by MgO.
Other samples were capped with
10 nm thick Ag and 5 nm thick Si layers to prevent any oxidation
of the Fe surface in ex situ measurements.
57Fe was evaporated by using Knudsen-cells with
BeO crucibles.
The Mössbauer measurements
were carried out by using a conventional constant
acceleration-type spectrometer. For the detection of the
conversion electrons a low-background proportional counter filled
with H2 was used. The spectra were measured by 50
mCi 57Co(Rh) single line source. For the analysis of the spectra, a
least-squares fitting program was used. Also, using this program,
spectra with histogram distributions of parameter values could be
fitted. The spectra with internal field
distributions were fitted by 35 subspectra in the range of 20 and 45 T.
The linear correlation of the magnetic field with isomer shift was included.
The linewidth was fixed to 0.25 mm/s. The isomer shift values are
given relative to that of -Fe at room temperature.
3 Results and Discussions
The Mössbauer spectra of the MgO/Fe/MgO samples measured at 15 K are are displayed in Fig. 1.

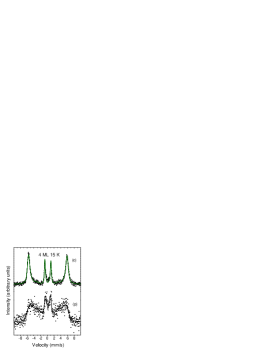
The spectra are magnetically split and show thickness dependence. The samples were deposited on cleaved substrates because those samples deposited on polished substrate were rather complex even at 15 K because of the short magnetic relaxation time as shown for the 4 ML thick Fe sample in Fig. 2.
Nevertheless, the 50 nm thick sample deposited at 150 K showed spectrum at RT indicating epitaxial layer formation. The temperature dependence of the spectrum of 8 ML thick Fe sample is shown in Fig. 3.

The temperature dependence of the second and third lines ratio is displayed if Fig. 4.

The spectra of 10 ML thick Fe layer measured at RT and at 15 K are shown in Fig. 5.

Although, the width of the spectral lines indicate some distribution of the internal magnetic field only one main component is present for the MgO/Fe/MgO samples. The parameters are compiled in Table I. This is not the case for MgO/Fe/Ag samples shown in Fig. 6. where another component appears with broad line width. All these spectra were fitted by magnetic split components.

| sample | T | Bhf | STD | A23 | |
|---|---|---|---|---|---|
| MgO(c)/4 ML Fe/MgO | 15 | 0.17 | 35.1 | 2.4 | 0.16(7) |
| MgO(p)/4 ML Fe/MgO | 15 | 0.16 | 26.9 | 9.2 | 0.13(7) |
| MgO(c)/6 ML Fe/MgO | 15 | 0.16 | 35.4 | 3.4 | 0.53(6) |
| MgO(c)/8 ML Fe/MgO | 300 | 0.03 | 29.6 | 2.9 | 3.82(8) |
| 150 | 0.11 | 32.5 | 3.5 | 2.61(8) | |
| 100 | 0.14 | 33.6 | 3.4 | 1.95(8) | |
| 15 | 0.15 | 35.2 | 3.3 | 1.71(9) | |
| MgO(c)/10 ML Fe/MgO | 15 | 0.14 | 34.2 | 2.8 | 2.78(8) |
Different line intensity ratios were obtained indicating different spin directions depending on the iron thickness. The relative intensity of the Zeeman sextet, 3:R:1:1:R:3 gives information on the angle between the spin orientation and the incident directions:
| (1) |
R and values can be in the range of 0-4 and 0-90∘ relative to the crystal normal, respectively. For 3, 5 and 6 ML thick iron layers the spin orientation is perpendicular to the surface. Nevertheless, second and fifth resonance lines appear for 6 ML thick iron sample deposited in polished substrate. For the sample of 8 ML thick Fe the spin direction is different at RT indicating parallel with surface. At lower temperature, the relative line intensities are changing depending on the temperature. But even at 15 K, the relative intensity has value corresponding to spin directions in between perpendicular and parallel position relative to the surface (Fig. 4.).
The spectra of MgO/Fe/Ag layers depending on 57Fe thickness are presented in Fig. 6. The fitted hyperfine parameters are displayed in Table II.
| sample | components | () | B | STD | A23 | RI |
|---|---|---|---|---|---|---|
| MgO(p)/3 ML Fe/Ag | A | 0.16 | 35.7 | 1.7(1) | 0.14(8) | 46.8(9) |
| B | 0.33 | 30.9 | 4.4(2) | 0.27(8) | 50.2(9) | |
| C | 0.32 | 3.0(9) | ||||
| MgO(c)/3 ML Fe/Ag | A | 0.15 | 35.6 | 1.9(1) | 0.10(8) | 37.3(9) |
| B | 0.32 | 31.0 | 5.6(2) | 0.43(8) | 57.3(9) | |
| C | 0.32 | 5.4(9) | ||||
| MgO(p)/5 ML Fe/Ag | A | 0.16 | 36.0 | 1.6(1) | 0.19(8) | 56.1(9) |
| B | 0.33 | 31.1 | 4.1(2) | 0.21(8) | 40.8(9) | |
| C | 0.32 | 3.1(9) | ||||
| MgO(c)/5 ML Fe/Ag | A | 0.15 | 36.1 | 1.7(1) | 0.13(8) | 43.7(9) |
| B | 0.32 | 31.0 | 4.8(2) | 0.31(8) | 52.9(9) | |
| C | 0.33 | 3.4(9) | ||||
| MgO(p)/6 ML Fe/Ag | A | 0.16 | 35.1 | 1.4(1) | 3.17(8) | 82.8(9) |
| B | 0.33 | 30.9 | 3.4(2) | 3.48(8) | 15.4(9) | |
| C | 0.34 | 1.8(9) | ||||
| MgO(c)/6 ML Fe/Ag | A | 0.16 | 35.6 | 1.5(1) | 0.11(8) | 80.3(9) |
| B | 0.33(1) | 30.8 | 3.6(2) | 0.23(8) | 16.9(9) | |
| C | 0.34(2) | 2.8(9) |
Two components appear. One can be attributed to pure iron clusters the other to iron at the Fe/Ag interface. At low Fe thickness the relative intensity of RIFe/RIFe/Ag is smaller than at thicker Fe layers because the specific surface area is larger.
Fe grows on MgO(100) epitaxially at room
temperature rotated by 450 in plane. Since the surface free energy of Fe is considerably larger than for MgO, 3D Fe islands form on MgO surface (Vomer-Weber mechanism). The Fe atoms are sitting above the O2- sites on the MgO(100) surface. [2, 5]
First, round shaped islands of different sizes are
formed at room temperature deposition [14, 21, 22, 23, 24, 25, 26, 27].
The epitaxially grown Fe films should have a small contraction of the
vertical lattice constant to compensate for the in plane expansion
imposed by the 5.8 percent lattice mismatch between MgO and Fe. Nevertheless, the growth of Fe under slight compression was observed[20] The films
become continuous and fully cover the substrate surface at
an 6 ML thickness from morphological and magnetic point of view.
[28] Cluster formation of Fe on MgO may also expected because of the diffusion mediated adatom capture and the effect of the Ehrlich Swöbel factor. As it was referred in Introduction section, several authors reported Fe-oxid formation and/or significant interaction between the Fe and the O2- ion on the MgO/Fe interface. In the later case the s
electron density should decrease at the 57Fe nucleus because
of the correlation effect of 4s electrons at the Fermi surface and the
oxygen ion modifying the charge distribution at the interface and an increase of isomer shift
should appear. The Mössbauer spectra of the samples with 4, 6 and 8 ML 57Fe
deposited on the MgO surfaces and covered with MgO measured at room temperature have
IS values very close to 0 mm/s (Table I.) indicating the same s electron
density as in the Fe-Fe atomic neighborhood. This result exclude
the change of electron density on Fe indicating no any significant interaction between the Fe and the O2- ion at the Fe/MgO interfaces or the formation of Fe-oxide
molecular component. For Ag covered samples, the iron atom interact with Ag atom in the interface. This case, components with increased values appear (Table II.). The spectra of Fe deposited on polished and cleaved substrates are different (Fig. 2). On polished substrate magnetic relaxation effect appear indicating smaller islands forming on the surface. This case, more structural defects are at polished surface than in the cleaved one promoting the formation of more islands. The size of these islands become smaller than on cleaved surface. Therefore the blocking temperature for the smaller islands are lower than for larger ones (on cleaved surface). The stabilization processes of islands may result in some disorder including dislocations
[29, 30]. The films are not perfectly ordered in the bcc structure and this ”disorder” may change the hyperfine magnetic interaction. Therefore, the magnetic fields values appear with distribution as it was observed earlier for Ag/Fe/Ag layers[19]. The average internal magnetic field values for 4 and 6 ML thick samples are larger than for bulk iron indicating enhanced field.
The spectra show different relative line intensities depending on Fe thickness. As it is described in previous caption, at low thickness values, up to 6 Ml Fe the spins are parallel to the lattice normal. At higher thickness values the spins turn to parallel to the surface layer. This behavior is very similar as they were observed for Ag/Fe/Ag layers.
The magnetic exchange coupling in ultra thin layers are different relative to the bulk phases, consequently, the magnitude and orientation of magnetic anisotropies are also different. The magnetic anisotropy energy depends on the layer thickness and on the temperature. The main sources of magnetic anisotropy are the magnetic dipolar interaction and the spin orbit interaction. For very thin layers the dipolar field interaction is not the larger contribution because the layers mostly form relatively small islands, they can not be considered as a magnetic continuum, the long range interactions do not dominate. Instead, the spin orbit interaction is the dominant factor. Depending on the thickness of the deposited layers in the range of 1-10 ML-s calculations[31] really showed the magnitude of the dipolar contribution is of minor importance, the spin-orbit coupling appears dominant. The thickness dependence of spin orientation for lower thickness values is parallel with the film normal. The linear variation of the spin direction depending on the temperature for 8 ML thick sample (Fig. 4) indicates the effect of the linear temperature dependent thermal expansion of the lattice according to result of the analysis of the temperature dependent magneto-elastic anisotropy.[32] At larger thickness (10 ML), in plane magnetization appears, the spin-orbit coupling becomes weak and quenched.
4 Conclusions
Mössbauer spectroscopy of 57Fe provided results on the atomic interactions and magnetic properties of Fe layers on MgO(100)/Fe/MgO and on MgO(100)/Fe/Ag. The results showed that depositing iron on MgO (100) at room temperature, the Fe and O2- ion interaction is extremely weak and no any FeO form at the Fe/MgO interfaces. Up till now, this is the first system where no electronic density changes take place at the interface between the transition metal layer deposited on a substrate. Also, no electron density changes were observed when MgO was deposited on the surface of already deposited metallic layers. Therefore, MgO cover layer can save the deposited metallic layer for studies performed in extra vacuum. The results indicate that MgO is an ideal insulator layer as the resistor between the magnetic iron layers in tunneling magnetic resistance systems. The studies showed enhanced hyperfine magnetic field in the iron ultra-thin layers with spin orientations depending on their thickness indicating the decrease of the electronic orbital moment for thicker iron layers. The higher parameter distribution values of the polished substrates comparing to the cleaved ones proves the difference in the growth process of the iron on the substrate surface.
Acknowledgement
This work was supported by the Hungarian National Research Fund (OTKA)
project No. K62272.
References
- [1] W. H. Butler, X.-G. Zhang, T. C. Schulthess and J. M. MacLaren, Phys.Rev. B, 63 (2001) 054416.
- [2] C.M. Boubeta, J.L. Costa-Krämer and A. Cebollada, J. Phys.: Condens. Matter, 15 (2003) R1123.
- [3] C. Tusche, H. L. Meyerheim, N. Jedrecy, G. Renaud, A. Ernst, J. Henk, P. Bruno and J. Kirschner, Phys. Rev. Lett., 95 (1995) 176101.
- [4] H.L. Meyerheim, R. Popescu, J. Kirschner, N. Jedrecy, M. Sauvage- Simkin and R. Pinchaux, Phys. Rev. Lett., 87 (2001) 076102.
- [5] H.L. Meyerheim, R. Popescu, N. Jedrecy, M. Vedpathak, M. Sauvage- Simkin, R. Pinchaux, B. Heinrich and J. Kirschner, Phys. Rev. B, 65 (2002) 144433.
- [6] X.-G. Zhang, W. H. Butler and A. Bandyopadhyay, Phys. Rev. B 68 (2003) 092402.
- [7] S.G. Wang, G. Han, G.H. Yu, Y. Jiang, C. Wang, A. Kohn and R.C.C. Ward, J. Magn. Magn. Mater., 310 (2007) 1935.
- [8] Ch. Li and A.J. Freeman, Phys. Rev. B 43 (1991) 780.
- [9] P. Luches, S. Benedetti, M. Liberati, F. Boscherini, I.I. Pronin and S. Valeri, Surf. Sci. 583 (2005) 191.
- [10] M. Sicot, S. Andrieu, C. Tiusan, F. Montaigne and F. Bertran, J. Appl. Phys., 99 (2006) 301.
- [11] M. Sicot, S. Andrieu, F. Bertran and F. Fortuna, Phys. Rev. B 72 (2005) 144414.
- [12] L. Plucinski, Y. Zhao, B. Sinkovic and E. Vescovo, Phys. Rev. B 75 (2007) 214411.
- [13] M. Zajac, K. Freindl, K. Matlak, M. Slezak, T. Slezak, N. Spiridis and J. Korecki, Surf. Sci. 601 2007 4305.
- [14] J. A. Stroscio, D. T. Pierce and R. A. Dragoset, Phys. Rev. Lett. 70 (1993) 3615.
- [15] T. Shinjo Surf. Sci. Reports 12 (2007) 49.
- [16] T. Shinjo and W. Keune J. Magn. Magn. Mater., 200 1999 598.
- [17] J. Tyson, A. H. Owens and J. C. Walker, J. Appl. Phys., 52 (1981) 2487.
- [18] P. J. Shurer, Z. Celinski and B. Heinrich, Phys. Rev. B, 48 (1993) 2577
- [19] I. Dézsi, Cs. Fetzer, I. S. Szűcs, B. Degroote, A. Vantomme, T. Kobayashi and A. Nakanishi, Surf. Sci., 601 (2007) 2525.
- [20] B. Li. J. R. Fermin, A. Azevedo, F. M. de Aguiar and S. M. Rezende, Appl. Phys. Lett., 72 1998 2760.
- [21] B.M. Lairson, A.P. Payne, S. Brennan, N.M. Rensing, B.J. Daniels and B.M. Clemens, J. Appl. Phys., 78 (1995) 4449.
- [22] K. Thürmer, R. Koch, M. Weber and K.H. Rieder, Phys. Rev. Lett., 75 (1995) 1767.
- [23] J. F. Lawler, R. Schad, S. Jordan and H. van Kempen, J. Magn. Magn. Mater., 165 (1997) 224.
- [24] S. M. Jordan, J. F. Lawler, R. Schad and H. van Kempen, J. Appl. Phys., 84 (1998) 1499.
- [25] G. Fahsold, A. Pucci and K.-H. Rieder, Phys. Rev. B, 61 (2000) 8475.
- [26] G. Fahsold, A. Priebe, N. Magg and A. Pucci Thin Solid Films, 364 (2000 ) 177.
- [27] R. Reitinger, B. Sepiol, G. Vogl, B. Pfau, L-M. Stadler, S. Stankov, F. Zontone, N. Spiridis and J. Korecki, J. Appl. Phys., 102 (2007) 034310.
- [28] C.M. Boubeta, C. Clavero, J.M. Garcia-Martin, G. Armelles, A. Cebollada, L. Balcells, J.L. Menendez, F. Peiro, A. Cornet and M.F. Toney, Phys. Rev. B, 71 (2005) 014407.
- [29] R. B. Stinchcombe, Phase Transitions and Critical Phenomena vol. 7 ed. C. Domb and J. L. Leibowitz (London, Academic, 1983) p. 151.
- [30] D. Stauffer Phys. Rep., 5 (1979) 41.
- [31] H. J. G. Draaisma and W. J. M. de Jonge, J. Appl. Phys., 64 (1998) 3610.
- [32] B. Aktaş, B. Heinrich, G. Woltersdorf, R. Urban, L. R. Tagirov, F. Yildiz, K. Özdoğan, M. Özdemir, O. Yalçcin and B. Rameev, J. Appl. Phys., 182 (2007) 013912.