Chandra X-ray Observations of the redshift 1.53, radio-loud quasar: 3C 270.1.
Abstract
Chandra X-ray observations of the high redshift (=1.532) radio-loud quasar 3C 270.1 in 2008 February show the nucleus to have a power-law spectrum, , typical of a radio-loud quasar, and a marginally-detected Fe K emission line. The data also reveal extended X-ray emission, about half of which is associated with the radio emission from this source. The southern emission is co-spatial with the radio lobe and peaks at the position of the double radio hotspot. Modeling this hotspot including Spitzer upper limits rules out synchrotron emission from a single power-law population of electrons, favoring inverse-Compton emission with a field of 11 nT, roughly a third of the equipartition value. The northern emission is concentrated close to the location of a 40o bend where the radio jet is presumed to encounter external material. It can be explained by inverse Compton emission involving Cosmic Microwave Background photons with a field of 3 nT, roughly a factor of nine below the equipartition value. The remaining, more diffuse X-ray emission is harder (HR=0.22). With only 22.85.6 counts, the spectral form cannot be constrained. Assuming thermal emission with a temperature of 4 keV yields an estimate for the luminosity of 1.8 erg s-1, consistent with the luminosity-temperature relation of lower-redshift clusters. However deeper Chandra X-ray observations are required to delineate the spatial distribution, and better constrain the spectrum of the diffuse emission to verify that we have detected X-ray emission from a high-redshift cluster.
1 Introduction
With the aim of quantifying the orientation-dependence of the observed properties of quasars, we have embarked on multi-wavelength observations of high-redshift (1 2) radio sources with Chandra, Spitzer, Herschel and ground-based observatories. Given the known orientation dependence of the emission from quasars and active galactic nuclei (AGN) and the resulting strong selection bias against obscured/edge-on sources, isotropic, low-frequency radio emission provides a rare, unbiased view of the population based on optically thin emission far from the nucleus (i.e. lobe-selection). We chose high-redshift 3CR (selected at 178 MHz) sources to ensure the sample is largely unbiased and that it comprises powerful radio galaxies and quasars. Studies of high-redshift, radio-loud quasars also facilitate more lines of investigation: X-ray emission related to radio structure at high-redshift, and thus the interaction of the quasar with its environment, and searches for high-redshift clusters of galaxies.
X-ray emission is often observed from radio-emitting hotspots and lobes in quasars. It is generally interpreted (Harris & Krawczynski, 2002; Worrall, 2009) in terms of direct synchrotron emission from high-energy electrons, inverse-Compton (iC) emission due to up-scattering of radio photons within the radio hotspots (synchrotron self-Compton (SSC), Hardcastle et al. (2004)), or inverse-Compton (iC) up-scattering of external radio photons in the extended lobes, most likely from the Cosmic Microwave Background (iC/CMB, Croston et al. (2005)). The latter will be more luminous for larger radio-emitting structures and at higher redshift due to the higher energy density of the CMB.
Luminous high-redshift radio sources occur in massive galaxies and so, according to the hierarchical paradigm, form at peaks in the dark matter density. Thus they are beacons for high density regions in the early universe and for high-redshift clusters and groups, very few of which are yet known. Finding clusters at these high redshifts is key to the study of both cluster and galaxy formation and will provide critical constraints on theoretical models for cluster and galaxy evolution (Andreon et al., 2011; Hilton et al., 2010; Venemans et al., 2007) and the mass distribution of dark matter halos (Croton et al., 2007).
The radio-loud quasar 3C 270.1 (=1.532) has the double-lobed radio structure characteristic of FR-II (Fanaroff & Riley, 1974) radio sources and the strong, broad emission lines of a type 1 quasar. Optical and infrared (IR) data show an excess of galaxies within kpc (1.′3) of the quasar suggesting a surrounding cluster of galaxies (Haas et al., 2009). The sky distribution of the cluster galaxy candidates forms a loose concentration centered east of the quasar, although the centroid is not well constrained by the current data.
This paper reports Chandra observations of the X-ray emission from the vicinity of 3C 270.1. This includes unresolved emission from the quasar itself and extended X-ray emission within of the core. The extended X-rays have two components: softer emission associated with the radio emission north and south of the core; and harder, more diffuse emission which may originate in gas associated with the cluster in which the quasar is embedded (Haas et al., 2009) or in iC/CMB emission from low-surface brightness or older radio emission that is not easily detectable (Fabian et al., 2003).
We assume a CDM cosmology with Ho=71 km s-1 Mpc-1, , and (Larson et al., 2011).
2 Multi-wavelength Observations and Data
3C 270.1 was observed on-axis with the Chandra ACIS-S for 9.673 ks on 2008 February 16 (ObsId 9255 (catalog ADS/Sa.CXO#obs/09255)). The data were reprocessed in 2011 January with CIAO 4.3 to take advantage of the latest calibration files and CTI (charge transfer inefficiency) calibration as well as sub-pixel event repositioning, which improves the spatial resolution. The reprocessed data were used in the analysis presented here. The quasar is well-detected with counts consistent with the spatial distribution of a point source. There are also 40 excess counts within 10″ of the quasar but outside its’ point spread function (PSF).
Radio data from the VLA archive were reprocessed to generate high-resolution images at 1.43, 8.46, and 14.94 GHz, to provide comparison images at resolution similar to, or better than, that of the Chandra data. All processing was done in AIPS, and followed the usual steps of calibration, imaging, and a CLEANing/self-calibration cycle. The datasets used are listed in Table 1, with the angular sizes of the synthesized beams generated from the full datasets at uniform sampling.
| Project | Date Observed | Frequency | Full-resolution Gaussian |
| (GHz) | beam FWHM | ||
| major minor (PA) | |||
| (arcsec2) (deg) | |||
| AB796 | 1996-Nov-07 | 8.46 | 0.25 0.24 (+120.5∘) |
| AH480 | 1992-Dec-05 | 1.43 | 1.30 1.18 (+35.9∘) |
| AL073 | 1983-Oct-21 | 14.94 | 0.13 0.12 (+69.4∘) |
Spitzer/IRAC data for 3C 270.1 were obtained on 2007 June 28 and are reported by Haas et al. (2008, 2009). The on-source exposure times of 430s in each band allow us to detect point sources to Jy (3) at 3.6 and 4.5 m and Jy at 5.8 and 8 m.
We obtained ( Å, Fukugita et al. (1996)) imaging of 3C 270.1 in 2007 June with Megacam (McLeod et al., 2006) at the 6.5 m MMT. The total integration time was 40 minutes under conditions of subarcsecond seeing. The individual exposures were reduced using standard techniques to create a final flattened and flux-calibrated mosaic covering 3C 270.1.
3 Data Analysis
3.1 Radio Morphology and Analysis
An 8.46 GHz image of 3C 270.1 (contours displayed in Figure 1) shows strong, unresolved emission from the central quasar and more diffuse emission from the lobes north and south of the nucleus with some extension back towards the quasar nucleus. The peaks of emission in the northern hotspot, the core, and the southern hotspot are not co-linear.
The southern emission includes a jet with position angle (PA) close to 180o and an extensive lobe at the same position angle extending over ( kpc) which includes a hotspot at the south-east edge. The jet includes a bright knot just south of the quasar core. There is no apparent excess of X-ray counts at this position, although the resolution of the X-ray data is sufficiently low that a deconvolution would be challenging. Figure 2 shows higher-resolution 14.9 GHz radio contours of the southern hotspot region. There is a double radio hotspot: “precursor” and “southeast (SE)” components, with a pronounced zig-zag morphology similar to 3C 205 (Lonsdale & Barthel, 1984). A ridge of emission starts at the location of the precursor and extends towards the peak of the southeast (SE) hotspot at a position angle of 140o. The ridge is brighter close to the precursor hotspot in the 15 GHz image (Figure 2) and becomes fainter farther away from it. From the peak of the SE hotspot, the ridge line turns sharply west, curving through 90o to a secondary peak and decreasing in surface brightness. The length of this curving ridge is about 1 ″(9 kpc).
The northern lobe is skewed by 30o from the axis defined by the southern jet and consists of two distinct components (Lonsdale et al., 1993). The well defined lobe emission includes a hotspot at the end farthest from the quasar. The hotspot lies in an emission ridge with north-south orientation and is approximately 0.″3 (2.6 kpc) in length. A faint radio emission component extends southeast from the lobe with position angle and is a relatively diffuse, steep-spectrum feature with length 2.″2 (19 kpc). The feature turns through an angle of 40o back towards the quasar, suggesting an encounter between an outflow of radio plasma and a dense medium. We shall call this region the counter-jet-bend (N-C-jet-bend). There is no jet emission visible on the north side, and the lobe emission is significantly more depolarized (Garrington et al., 1991), further supporting the presence of hot gas surrounding the quasar and consistent with this being the counter-jet side.
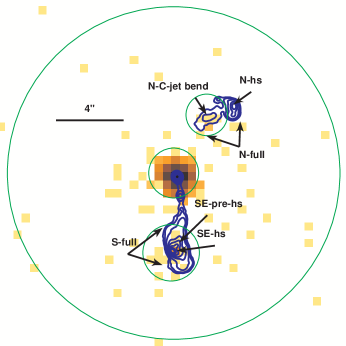
We used VLA X-band (8.46 GHz) and U-band (14.9 GHz) radio data (Figures 1, 2) to estimate radio emitting volumes, flux densities, and spectral slopes in six regions defined based on the radio morphology: N-hs (North hot spot), SE-hs (SouthEast hot spot), SE-pre-hs (SouthEast precursor hot spot), N-C-jet-bend (North counter-jet-bend ), N-full (North lobe), and S-full (South lobe) (Table 2). These regions are also used as the basis for determining the optical, IR and X-ray fluxes/limits, although the spatial resolution is lower in the latter two bands so that hotspot- or lobe-related emission cannot be separated.
| Region | RA | Dec | Dimensions1 | Angle2 | S1.43 | S8.46 | S14.93 | Spitzer |
| J2000 | J2000 | of extraction | mJy | mJy | mJy | Upper limits3 Jy | ||
| region | 3.6,4.5,5.8,8.0 m | |||||||
| N-hs | 12:20:33.61 | 33:43:16.1 | 0.16′′0.09′′ | 00∘ | 20 | |||
| N-C-jet-bend | 12:20:33.73 | 33:43:15.1 | 1.0′′0.7′′ | 30∘ | 60 | 7 | 2.1,3.6,23,27 | |
| N-full | 12:20:33.65 | 33:43:15.6 | 1.05′′1.05′′ | 00∘ | 570 | 65 | ||
| SE-hs | 12:20:33.90 | 33:43:07.5 | 0.27′′0.10′′ | 120∘ | 135 | 85 | 2.1,3.6,23,27 | |
| SE-pre-hs | 12:20:33.88 | 33:43:07.9 | 0.22′′0.16′′ | 00∘ | 10 | |||
| S-full4 | 12:20:33.87 | 33:43:07.8 | 2.1′′0.8′′ | 00∘ | 1630 | 230 | 7.8,11,49,72 |
1: Semi-major semi-minor axes of an ellipse, with volume determined as a uniformly filled, prolate ellipsoid, except for S-full where the dimensions are the height and radius of a right circular cylinder.
2: The angle of rotation of the major axis to the east of north.
3: 3.6 upper limits for a point/extended source as appropriate
4: Radio flux for the full lobe with the hotspot emission subtracted

3.2 X-ray Data Analysis
The unsmoothed, broad-band, X-ray data are shown in Figure 1 with the radio contours superposed. The X-ray spatial resolution is , about twice that of the radio data. The X-ray data were shifted 0.″32 to the SW (Chandra’s offset has 0.″4 rms radius, Proposers’ Observatory Guide) to align the peak of the nuclear emission with the VLA position of the radio core.
The analysis of the data from several regions in the vicinity of 3C 270.1 is described below along with that of a lower-redshift (=1.038) quasar NGC 4395 B06, north of 3C 270.1 (on the same ACIS-S chip and with similar point spread function), which is used as a comparison point source. Extracted counts and derived fluxes are listed in Table 3.
| Region Name | Net Counts | HR2 | Flux Density3 | Flux4 | Flux4 | Flux4 |
|---|---|---|---|---|---|---|
| 0.38keV | 1keV | 0.38keV | 0.32keV | 28keV | ||
| Quasar Core | 726 27 | 0.03 | 1.4 | 6.0 | 2.5 | 3.5 |
| Southern Hotspot5 | 16.7 4.1 | 0.034 | 0.111 | 0.062 | 0.049 | |
| N-C-jet-bend5 | 5.8 2.5 | 0.008 | 0.027 | 0.015 | 0.012 | |
| Diffuse Emission6 | 22.85.6 | 0.22 | 0.05 | 0.13 | 0.09 | 0.04 |
| NGC 4395 B06 | 351 19 | 0.04 | 0.8 | 2.5 | 1.4 | 1.1 |
1: Fluxes are determined using the best fit model in Table 4 unless otherwise noted. Errors are quoted at the 1 level.
2: Hardness ratio, HR=(H-S)/(H+S) (H(28 keV), S(0.32 keV)), determined using the BEHR method (Park et al., 2006)
3: in units of erg cm-2 s-1 keV-1
4: in units of erg cm-2 s-1, statistical errors in counts dominate for the extended emission
5: Assuming and Galactic =1.29 cm-2. Southern hotspot includes both SE-hs and pre-hs which are not resolved in the X-ray data
6: APEC model (Astrophysical Plasma Emission Code)111http://www.atomdb.org/ for collisionally-ionized thermal plasma assuming kT=4 keV; fluxes and flux density are corrected for the 28% excluded area encompassing the radio-linked X-ray emission.
3.2.1 The Quasar Core
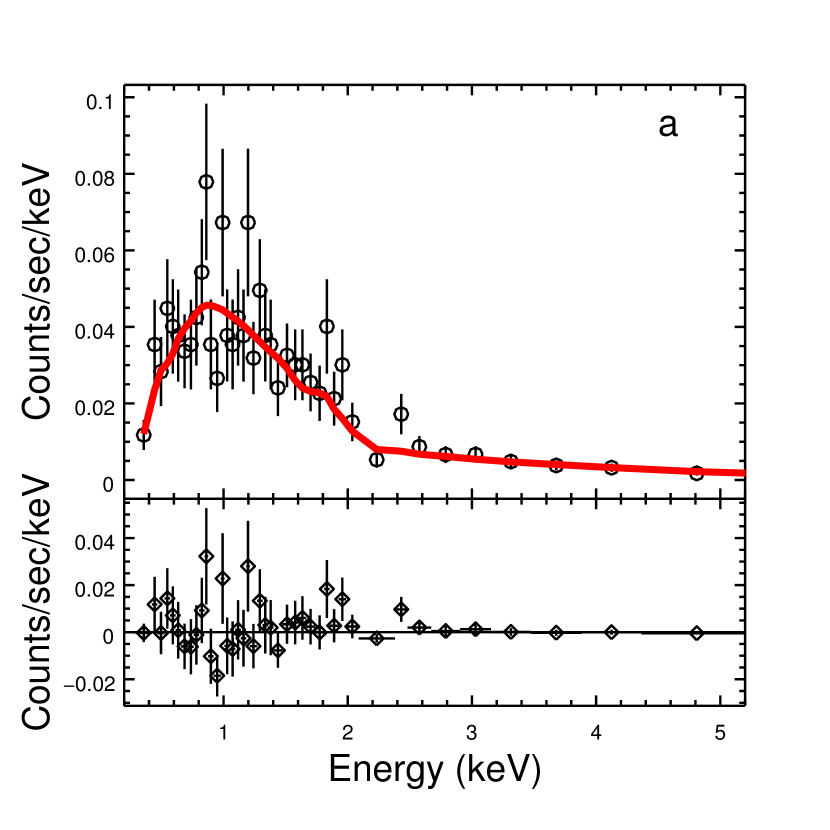
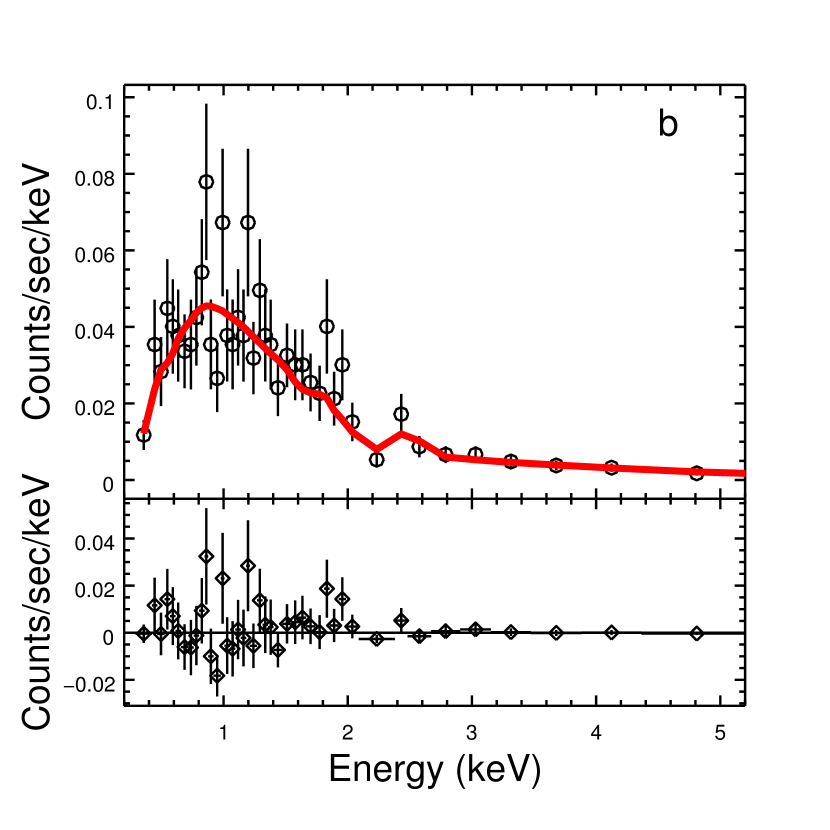
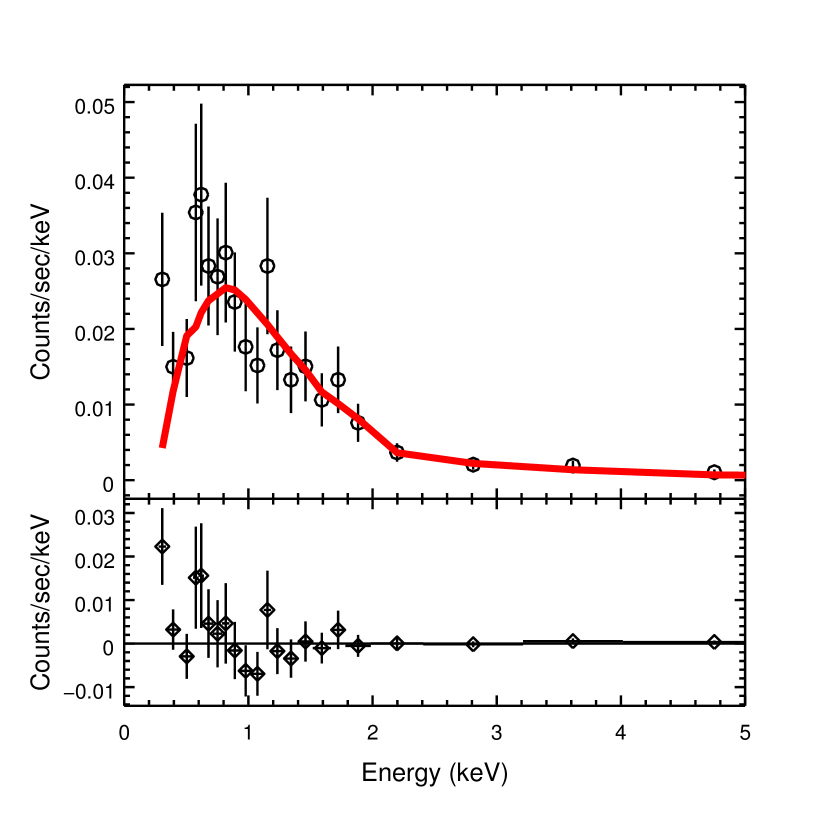
The quasar core is unresolved and well-detected. Counts were extracted from a 1.5′′ radius, circular region centered on the quasar position ( = 12 20 33.9; = +33 43 12), and background counts, estimated from an annulus with the same center, were subtracted yielding 72627 (0.38 keV) net counts (Table 3). A point source correction was applied for flux estimates using the CIAO tool arfcorr, which applies an energy-dependent PSF correction appropriate for the extraction region to the ARF (effective area) file. The counts were grouped to yield a minimum of 15 per bin to perform spectral fitting. A single, absorbed power-law spectral fit in the energy range (0.38 keV) shows absorption consistent with the Galactic =1.29 cm-2 (Stark et al., 1992), which was accordingly fixed to this value. The resulting best fit power-law slope, (, 42 degrees of freedom (dof)) is consistent with those generally reported for high-redshift, radio-loud quasars (e.g. Saez et al. (2011); Belsole et al. (2006), Marshall et al. (2005), Figure 3a, Cappi et al. (1997)). There is an emission line apparent at energy, E keV, consistent with cold Fe K in the rest frame of the quasar. Although only marginally significant, addition of a narrow Gaussian line at 2.5 keV improves the fit, while a higher energy line (2.7 keV, approximating ionized Fe) is clearly inconsistent. A spectral fit including a narrow line with energy, E keV yields an EW= eV with a power-law slope (, 41 dof). Given the large errors, the line energy and equivalent width are consistent with those reported for detected Fe K emission in radio-loud quasars (100 eV, Grandi et al. (2006)). There is a suggestion (Figure 3b) of further emission lines around 0.8 and 0.5 keV which roughly align with highly-ionized Si and Mg features in a photoionized spectrum in the quasar rest-frame. However they are not significant in this low-count spectrum. The fit parameters with and without the Fe K emission line are given in Table 4. Consistency of the data with the Galactic indicates no evidence for intrinsic absorption or the presence of a soft excess component, nor is there any improvement to the fit if a reflection component is added. Both intrinsic absorption and reflection components tend to be weak in face-on, type I quasars, particularly those that are radio-loud such as 3C 270.1 (Molina et al., 2008; Saez et al., 2011)
| Region Name | Model | Line E | Line EW2 | dof3 | ||
|---|---|---|---|---|---|---|
| keV | eV | |||||
| Quasar Core4 | PL+Gaus | 1.660.08 | 2.5 | 172110 | 28.7 | 41 |
| PL | 1.680.08 | 31.3 | 42 | |||
| NGC 4395 B06 | PL | 1.990.15 | 29.4 | 21 |
1: Assuming Galactic = 1.29 cm-2. Errors are quoted at the 1 level for one interesting parameter (unless otherwise noted)
2: Equivalent Width of emission line
3: Data were re-binned with a minimum of 15 counts per bin
4: Errors are 1 for 2 interesting parameters.
3.2.2 Radio–lobe-associated X-ray emission
X-ray emission is present coincident with the southern radio lobe, and the peak is close to the primary (SE) radio hot spot. The net counts were extracted from a circle of radius 1.7” centered on = 12 20 33.91, = +33 43 07.25, which includes the cluster of counts in this region and aligns well with the position of the double radio hotspot. The net counts, 16.74.1, are primarily soft, with hardness ratio HR=. There are too few counts for a spectral fit. Fluxes (Table 3) are insensitive to the assumed spectral form since statistical uncertainties dominate.
X-ray emission north of the quasar is centered south-east of the radio hotspot in the northern radio lobe, aligned with the position of the N-C-jet-bend in the radio emission (Figure 1). Counts were extracted from a circular region, radius 1.″25, centered on = 12:20:33.74, = 33:43:15.4, selecting the cluster of events apparently associated with the radio emission in this region of sky. We find 6 counts where 0.2 background counts are expected, a significant detection. The net counts, 5.82.5, in the broad-band (0.38 keV) are soft with all the counts below 2 keV giving a hardness ratio, HR= (Table 3).
There is no detected X-ray emission associated with the northern radio hotspot. The more extended lobe emission possibly includes faint X-ray emission at its southern edge, but the association is highly uncertain given the low signal-to-noise and the lack of alignment with the lobe.
3.2.3 Nearby X-ray source: NGC 4395 B06.
There is a strong point-like X-ray source 48″ off-axis, close enough that there is no significant change in the PSF, on the same ACIS S-3 chip, and located at the position of the radio-quiet quasar NGC 4395 B06 ( = 12 20 32.7; = +33 43 56, =1.038, Barkhouse & Hall (2001)). Extracting counts from a circular region of radius 1.5′′, as for 3C 270.1, and estimating background counts from a annulus centered on the quasar, yields 35119 net counts. The hardness ratio, HR= is similar to that of the nucleus of 3C 270.1 (Table 3). A power-law fit assuming Galactic yields (, 21 dof, Table 4). Fitting with free results in a slightly flatter power-law slope (, , 20 dof) and very low suggesting the presence of a soft excess. However the signal-to-noise is insufficient to distinguish between models for a soft excess and the power-law slope is typical of radio-quiet quasars (Piconcelli et al., 2005) so no more complex modeling was carried out. Fluxes were determined using the initial fit, assuming Galactic .
3.2.4 Diffuse Extended Emission around 3C 270.1
There are additional X-ray counts around the quasar core which are not associated with the envelopes of radio emission. The emission occurs on both sides of the quasar but the number of counts is too low to constrain its spatial distribution.
We extracted counts in the broad band (0.38 keV) from an annular region centered on 3C 270.1 and extending from (64 kpc) excluding two segments (opening angles: North: 60o, South: 40o) containing the radio-related regions, this excluded 28% of the annulus. Background counts (34) were estimated from an annular region extending from . Twenty-seven counts were detected where 4.30.7 are expected, a detection which is highly significant (Table 3). The net extended counts are 22.8 (0.38 keV) with an energy distribution harder (HR = ) than the quasar or the radio-linked X-rays. Extracting counts from a similar extended region (″5) around the bright, nearby quasar NGC4395 B06 yields only 9 counts where 5 are expected, a marginal detection of 3.9 counts. We thus conclude that % of the diffuse extended counts around 3C 270.1 could originate in the wings of the central quasar. Since the wings are more extended at soft energies, this would result in an even harder spectrum for the diffuse emission.
The hardness of the diffuse counts makes it unlikely that they are nuclear X-rays Thomson-scattered from an extended gaseous halo. They could be CMB photons Compton-scattered by electrons associated with fainter, more diffuse radio emission below the current radio flux limit, as suggested for the high-redshift radio source 3C 294 (Fabian et al., 2003), or thermal emission from hot gas in the optical/IR cluster (Haas et al., 2009).
Since the mean surface brightness of the diffuse emission is 0.18 cts arcsec-2, it might contribute 1.6 and 0.9 counts in the extraction regions for the southern hotspot and northen N-C-jet-bend, 6% and 15% of the detected counts respectively, assuming it is isotropic. Correction of the X-ray spectra of the radio features would result in even softer emission and somewhat lower fluxes in these regions (Table 3). Any contribution to the quasar core would be negligible ( of the 726 net counts).
3.3 Spitzer and Optical, Data Analysis
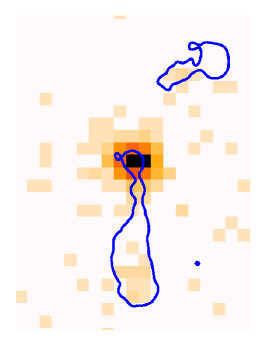
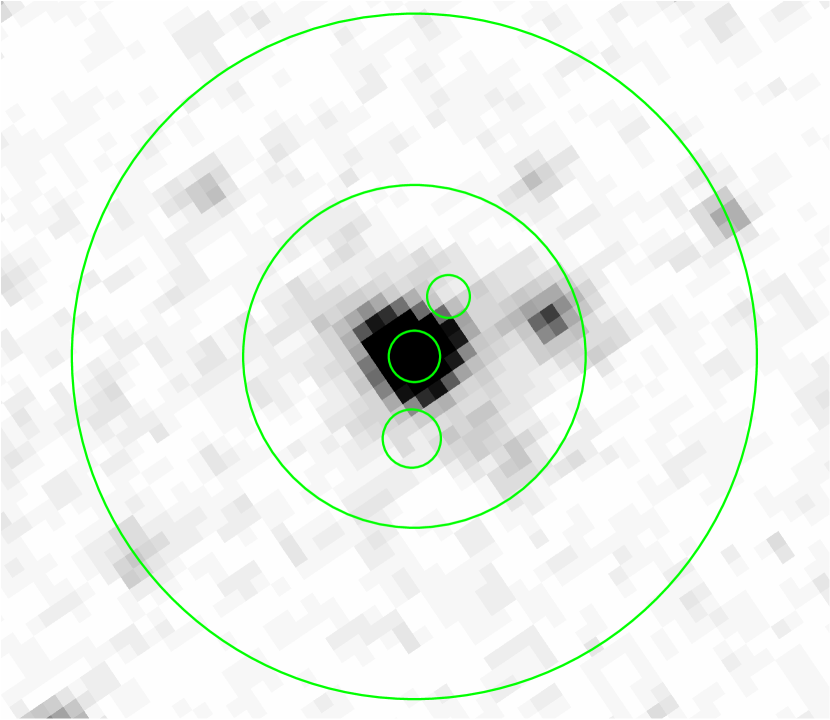
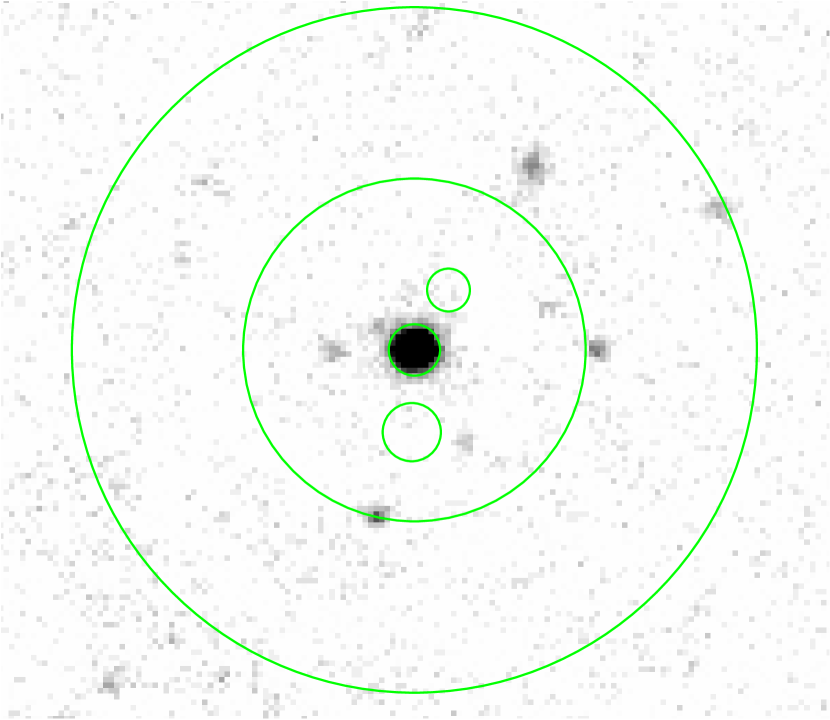
The 4.5 m IRAC data for 3C 270.1 are shown in Figure 5 with the X-ray extraction regions superposed. The quasar is well-detected in the IRAC data. There is no detected emission associated with either of the radio lobes. Upper limits were determined for the radio hotspots and the N-C-jet-bend appropriate for a point source since any associated IR emission would be unresolved with Spitzer. A second set of upper limits, appropriate for extended IR emission features, was determined for the full southern radio lobe based upon the radio contours. The upper limits are given in Table 2 and used to constrain the spectral energy distribution models described in Section 4.
The optical image is also shown in Figure 5 with the X-ray extraction regions superposed. There is no detectable optical emission at the position of the radio lobes. Upper limits were determined appropriate to the X-ray regions. We estimated the sensitivity from the fluctuations measured in source-free pixels to be 21.8 AB mag (6.9 Jy, ) within a 3″ diameter aperture.
There is a faint source ″ east of 3C 270.1, also marginally visible in the IRAC data. It is most likely a faint galaxy. The position is ″4 east of a small group of X-ray photons currently identified as part of the extended, diffuse emission. Given this offset, the X-ray counts are unlikely to be related, but deeper Chandra X-ray data would clarify any possible association.
4 Modeling the X-Ray Emission from Hot Spots and Radio Lobes
There are three mechanisms commonly invoked to explain radio-associated, extended X-ray emission: synchrotron, SSC and iC/CMB. All three were applied to the components of 3C 270.1 following the method described by Hardcastle et al. (1998). Given the lower spatial resolution and low signal-to-noise of the Chandra data, we are unable to uniquely identify the X-ray emission with specific radio structure based on spatial distribution alone. We therefore determined the fluxes from the north and south radio structures in regions appropriate for the observed X-ray emission and constructed radio through X-ray spectral energy distributions for the radio regions assuming, in each case, that all the X-ray emission is associated with the particular radio region being considered. The models were then applied to each SED.
The radio through X-ray SED for each region was fitted with a standard continuous injection electron spectrum with a minimum energy corresponding to eV and maximum energy corresponding to eV for the S-full and N-C-jet-bend. For the SE-hs, we used the identical minimum energy but a maximum energy of eV. The choice of high energy cutoff was due to the following two constraints: (i) it is as low as possible without being inconsistent with the radio data and (ii) the fitted synchrotron model to these data does not violate the Spitzer upper limits. There remain significant uncertainties in the maximum electron energy, but for and E Emin the derived physical parameters are not very sensitive to this value. We assume that non-radiating particles are insignificant in the radio plasma and use a filling factor of 1.
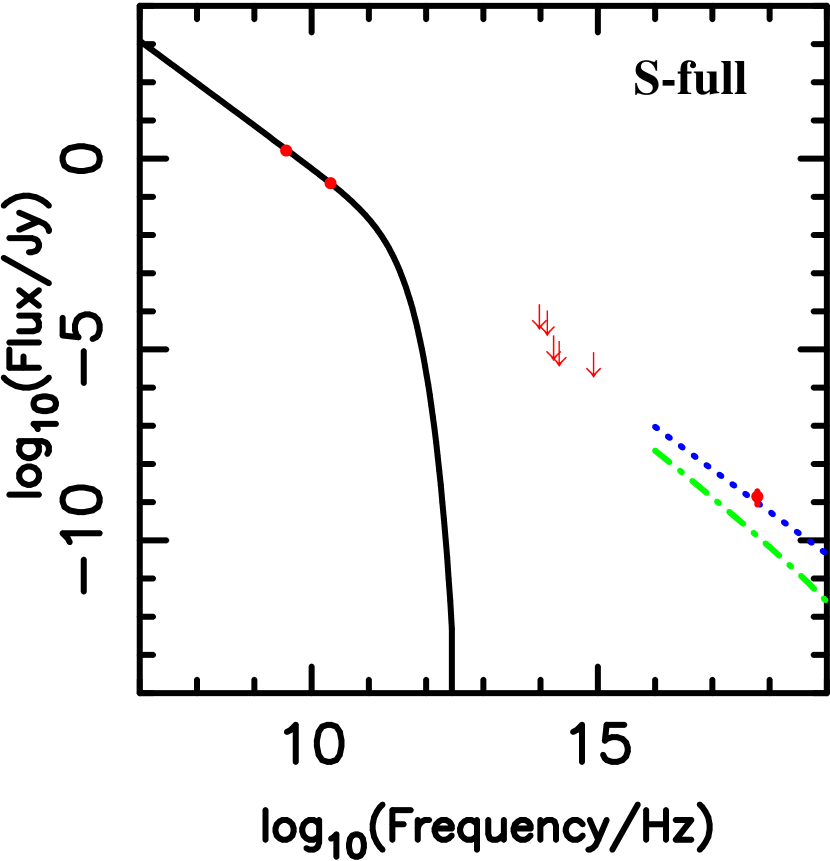
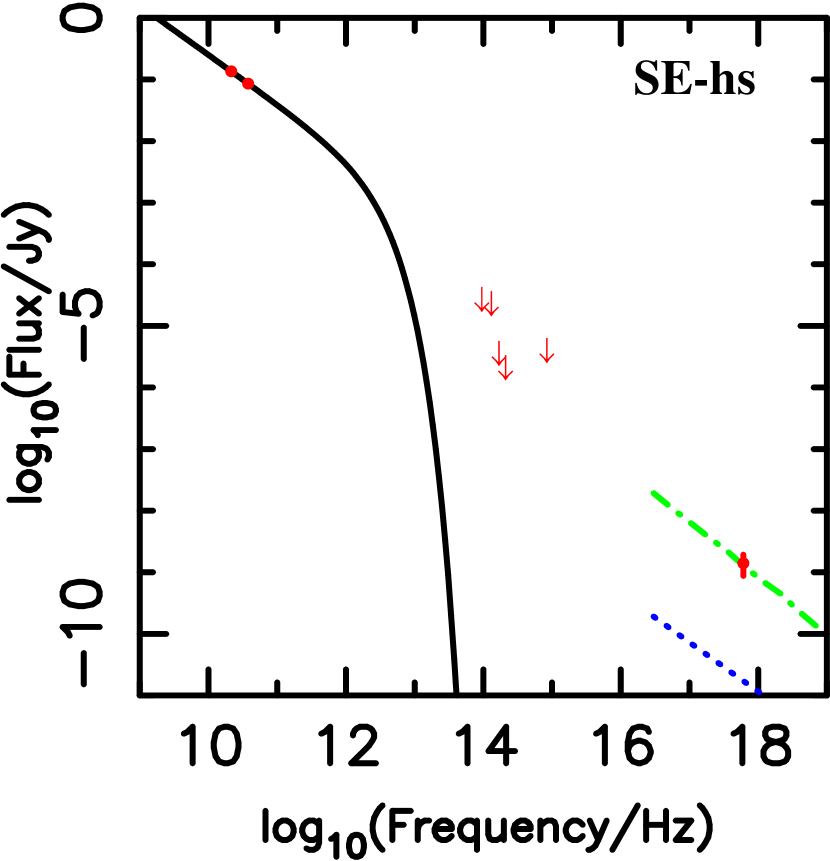
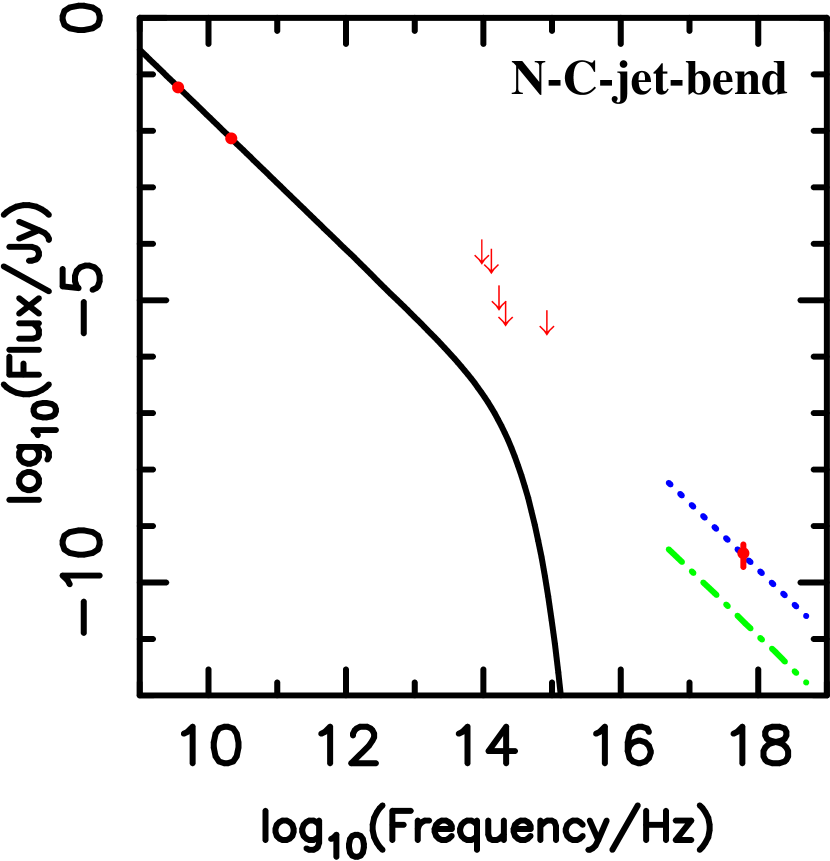
The predicted X-ray flux density for each region was determined for respectively, a broken power-law synchrotron model with a high-energy cutoff, a synchrotron self-Compton model (SSC) in which the X-ray emission is the result of iC scattering of the synchrotron radio photons off the relativistic electrons, and a model of iC scattering of CMB photons (iC/CMB) off the radio synchrotron-emitting, relativistic electrons. The models and predictions were determined in the quasar’s rest frame and are shown in Figures 6 and 7 superposed on the observed SED. The infrared upper limits (at 3.6) for each region from the Spitzer IRAC data sometimes constrain the highest energy electron populations. The figures also include a upper limit appropriate for a point source, but this does not provide an independent constraint.
4.1 Southern Radio Lobe/Hotspot
The signal-to-noise of the Chandra data is too low for us to determine whether the X-ray emission arises from the entire southern radio lobe or the hotspot(s). If the X-ray emission originates throughout the lobe, the synchrotron and SSC predictions are 1-2 orders of magnitude below the observed X-ray flux while the iC/CMB prediction is consistent with the observed X-ray flux if the magnetic field is set at 8 nT, about a quarter of the equipartition field for this region (Figure 6, left).
If instead all the X-ray emission originates in the SE hotspot, as suggested by the alignment of the peak emission, the Spitzer and optical upper limits rule out direct synchrotron as a viable mechanism for the emission at IRAC and shorter wavelengths, including the X-ray emission. The iC/CMB prediction for this small region is 3 orders of magnitude too low. The SSC prediction with a minimum-energy, equipartition magnetic field of 86 nT is also low but can be brought into agreement with a field of 24 nT (Figure 6, right), about a third of this value. This is not an unusual departure (Hardcastle et al., 2004) and not surprising given the uncertainties involved. For example, the X-ray emission could originate in more than one component and allow for a model closer to the equipartition field.
The radio emission from the precursor hotspot region (SE-pre-hs, Table 2) can only be determined at one frequency. Given the lower spatial resolution of the Chandra data and the lack of constraint on the optically-thin part of the radio spectrum and subsequent extrapolation of the electron spectrum to low energies, we cannot rule out a significant contribution from SSC emission from the precursor region.
In summary, the most likely interpretation, given the alignment between the X-ray emission and the radio emission, is that the X-rays primarily originate in the hotspot and/or the pre-cursor hotspot and are due to SSC. For emission from only the SE hotspot, the field is 24 nT, about a third of the equipartition field.
4.2 Northern Radio Emission
There is no detectable X-ray emission aligned with the northern hotspot. The SSC X-ray prediction for the northern hotspot, for an equipartition field of 77 nT based on the radio flux, assuming and constrained by the IR upper limits, is about a factor of 10 lower than the X-ray upper limit (1.3Jy, ) so that no X-ray emission is expected.
There is significant X-ray emission aligned with the N-C-jet-bend (Table 2), although with only a few counts the uncertainty on the flux is high. Assuming the radio plasma is static, the SSC predictions for an equipartition magnetic field of 28 nT are a factor lower than the X-ray flux density. The iC/CMB prediction is closer and can be brought into agreement with the observations if the magnetic field is 3 nT (Figure 7). This field is a factor of lower than equipartition, a larger departure than is generally observed (Croston et al., 2005). Since we do not have observations of radio emission from the low-energy electrons responsible for the iC/CMB X-rays, that radio-emitting region may be more extended (as e.g. in Schwartz et al. (2006)), which would result in a field closer to the equipartion value. Our upcoming, deeper Chandra observations (approved in Cycle 13) will provide improved constraints on these models.
5 Diffuse, Extended X-ray emission unassociated with radio structures.
There is evidence for a cluster surrounding 3C 270.1 in optical and infrared data (Haas et al., 2009). An obvious question, therefore, is whether the diffuse X-rays which are not associated with the radio structures could be thermal emission from X-ray gas in the cluster. For the X-rays to be cluster emission, we would expect a smooth and relatively isotropic distribution. The cluster center is not well-constrained. It was estimated to lie ″east of 3C 270.1 by Haas et al. (2009). The current dataset has insufficient observed counts (22.85.6, 0.3-8 keV) to constrain the spatial distribution of the diffuse emission. However the existence of an excess of counts around 3C 270.1, and the lack of a similar excess to the east suggest that the quasar may lie close to the center of the cluster.
The extended emission has too few counts to constrain the spectral parameters. The hardness ratio HR= indicates a temperature of keV in an APEC model but remains within of a power-law spectrum with , so we cannot rule out non-thermal emission. An APEC model was fitted, assuming abundance Z=0.5 Z⨀ and temperature 4 keV at the redshift of the source. With a grouping of 5 counts per bin to distribute them throughout the band, the spectrum looks reasonable, but the signal-to-noise is too low to provide meaningful constraints. The fitted normalization yields a broad-band flux, F(0.38 keV)= erg cm-2 s-1 including a correction for the excluded sky area assuming isotropic emission. This translates to a broad-band X-ray luminosity erg s-1 for our assumed cosmology, consistent with the luminosity of a 4 keV cluster based on the low-redshift luminosity-temperature (L-T, R500) relation of Pratt et al. (2009). The few high-redshift () clusters with X-ray measurements tend to be faint for their temperature based on a self-similar model for their evolution in comparison with similarly selected, lower-redshift clusters (Andreon et al., 2011; Hilton et al., 2010). Our uncertainties are too large to test this for 3C 270.1. Early cluster formation, consistent with a cluster around 3C 270.1, would be challenging for cluster formation models, which suggest that massive dark matter halos form primarily at 1.2 (Croton et al., 2007).
The data are too limited to constrain the X-ray spatial distribution, temperature, or abundances of the diffuse component. Our analysis is based on kpc close to or at the center of the cluster, where the physical conditions and the relation to the full R500 luminosity and temperature depend on the presence/absence of a cooling core (Pratt et al., 2009) and can be disturbed by heat input by the quasar. Deeper Chandra X-ray observations are required to confirm the extended nature and constrain the spatial distribution, spectral properties, and luminosity of the diffuse X-ray emission.
Qualitatively, the observations of extended X-ray emission are consistent with the asymmetric depolarization of the radio source observed by Garrington et al. (1991) (see §3.1). For a more quantitative comparison we can consider the simple analysis of Garrington & Conway (1991), which assumes that the density profile of the cluster can be modeled as a model and that the energy density in the magnetic field of the depolarizing medium scales as the energy density in thermal particles. The observed ratio of the dispersions in the Faraday depth in the two lobes, in the notation of Garrington & Conway, is . Since we detect an excess of counts close to the quasar, the core radius of any model that represents the observed X-ray emission must be comparable to or less than the size of our extraction region, with outer radius (64 kpc). From the radio data, the projected linear size of each lobe is 6″ ( kpc). The combination of these values and the observed suggest that the gas distribution is rather flat () and that the lobes are not aligned close to the line of sight. However the current quality of X-ray data on the gas near 3C 270.1 is too low to provide useful constraints. Our upcoming, deeper Chandra observations of this source, or Chandra observations of a larger sample of objects with observed depolarization, will give us a probe of the run of gas density and magnetic field strength with radius in high- clusters which will be difficult to obtain in any other way.
6 Conclusions
Chandra X-ray observations of the bright, high-redshift (=1.532) quasar 3C 270.1 show strong, unabsorbed power-law emission with a slope , consistent with expectations for radio-loud quasars.
Extended X-ray emission associated with the southern radio lobe of 3C 270.1 most likely originates in one/both components of the double hotspot within that lobe. Spitzer upper limits for the hotspot are inconsistent with synchrotron emission from a single power-law population of electrons as the emission mechanism. The X-ray emission is consistent with SSC for a magnetic field of 24 nT, about a third of the equipartition field for that region.
No X-ray emission is detected from the northern radio hotspot as expected from our models based on the observed SED. Faint emission is present just south of the lobe but seems unlikely to be associated given the lack of alignment.
Weak but significant X-ray emission associated with the south-eastern extension of the northern radio-lobe, coincident with a bend in the radio counter-jet (“N-C-jet-bend”), can be explained by iC/CMB emission with a field of 3 nT, a factor of lower than the equipartition field. This is a larger departure than is typical suggesting that, for example, the emitting region may be larger than our estimate. Our upcoming, deeper Chandra observations will better contrain the emission in this region.
Extended X-ray emission unassociated with the observed radio structures may be thermal emission from gas within the cluster believed to be surrounding the quasar or iC emission associated with radio emission below the present detection limit. There are too few counts to constrain its spatial distribution or spectrum, but assuming a temperature of keV yields a luminosity erg s-1, consistent with the low-redshift L-T relation and suggestive of a fully-formed cluster at redshift 1.532.
Upcoming deeper Chandra and radio (EVLA) observations will allow us to confirm the location and origin of the radio-associated X-ray emission for both northern and southern radio emission structures, to study the spatial distribution of the diffuse X-ray emission and its relation to any fainter, diffuse radio emission or to the optical/IR cluster, and to constrain its spectral form.
Acknowledgements
Support for this work was provided by the National Aeronautics and Space Administration through Chandra Award Number G08-9106X issued by the Chandra X-ray Center, which is operated by the Smithsonian Astrophysical Observatory for and on behalf of the National Aeronautics Space Administration under contract NAS8-03060 (Chandra X-ray Center). The National Radio Astronomy Observatory is a facility of the National Science Foundation operated under cooperative agreement by Associated Universities, Inc.. Observations reported here were obtained at the MMT Observatory, a joint facility of the Smithsonian Institution and the University of Arizona. This work is based in part on observations made with the Spitzer Space Telescope, which is operated by the Jet Propulsion Laboratory, California Institute of Technology under a contract with NASA.
References
- Andreon et al. (2011) Andreon, S., Trinchieri, G., & Pizzolato, F. 2011, MNRAS, 73
- Barkhouse & Hall (2001) Barkhouse, W. A. & Hall, P. B. 2001, AJ, 121, 2843
- Belsole et al. (2006) Belsole, E., Worrall, D. M., & Hardcastle, M. J. 2006, MNRAS, 366, 339
- Cappi et al. (1997) Cappi, M., Matsuoka, M., Comastri, A., Brinkmann, W., Elvis, M., Palumbo, G. G. C., & Vignali, C. 1997, ApJ, 478, 492
- Croston et al. (2005) Croston, J. H., Hardcastle, M. J., Harris, D. E., Belsole, E., Birkinshaw, M., & Worrall, D. M. 2005, ApJ, 626, 733
- Croton et al. (2007) Croton, D. J., Gao, L., & White, S. D. M. 2007, MNRAS, 374, 1303
- Fabian et al. (2003) Fabian, A. C., Sanders, J. S., Crawford, C. S., & Ettori, S. 2003, MNRAS, 341, 729
- Fanaroff & Riley (1974) Fanaroff, B. L. & Riley, J. M. 1974, MNRAS, 167, 31P
- Fukugita et al. (1996) Fukugita, M., Ichikawa, T., Gunn, J. E., Doi, M., Shimasaku, K., & Schneider, D. P. 1996, AJ, 111, 1748
- Garrington & Conway (1991) Garrington, S. T. & Conway, R. G. 1991, MNRAS, 250, 198
- Garrington et al. (1991) Garrington, S. T., Conway, R. G., & Leahy, J. P. 1991, MNRAS, 250, 171
- Grandi et al. (2006) Grandi, P., Malaguti, G., & Fiocchi, M. 2006, ApJ, 642, 113
- Haas et al. (2008) Haas, M., Willner, S. P., Heymann, F., Ashby, M. L. N., Fazio, G. G., Wilkes, B. J., Chini, R., & Siebenmorgen, R. 2008, ApJ, 688, 122
- Haas et al. (2009) Haas, M., Willner, S. P., Heymann, F., Ashby, M. L. N., Fazio, G. G., Wilkes, B. J., Chini, R., Siebenmorgen, R., & Stern, D. 2009, ApJ, 695, 724
- Hardcastle et al. (1998) Hardcastle, M. J., Birkinshaw, M., & Worrall, D. M. 1998, MNRAS, 294, 615
- Hardcastle et al. (2004) Hardcastle, M. J., Harris, D. E., Worrall, D. M., & Birkinshaw, M. 2004, ApJ, 612, 729
- Harris & Krawczynski (2002) Harris, D. E. & Krawczynski, H. 2002, ApJ, 565, 244
- Hilton et al. (2010) Hilton, M., Lloyd-Davies, E., Stanford, S. A., Stott, J. P., Collins, C. A., Romer, A. K., Hosmer, M., Hoyle, B., Kay, S. T., Liddle, A. R., Mehrtens, N., Miller, C. J., Sahlén, M., & Viana, P. T. P. 2010, ApJ, 718, 133
- Larson et al. (2011) Larson, D., Dunkley, J., Hinshaw, G., Komatsu, E., Nolta, M. R., Bennett, C. L., Gold, B., Halpern, M., Hill, R. S., Jarosik, N., Kogut, A., Limon, M., Meyer, S. S., Odegard, N., Page, L., Smith, K. M., Spergel, D. N., Tucker, G. S., Weiland, J. L., Wollack, E., & Wright, E. L. 2011, ApJS, 192, 16
- Lonsdale & Barthel (1984) Lonsdale, C. J. & Barthel, P. D. 1984, A&A, 135, 45
- Lonsdale et al. (1993) Lonsdale, C. J., Barthel, P. D., & Miley, G. K. 1993, ApJS, 87, 63
- Marshall et al. (2005) Marshall, H. L., Schwartz, D. A., Lovell, J. E. J., Murphy, D. W., Worrall, D. M., Birkinshaw, M., Gelbord, J. M., Perlman, E. S., & Jauncey, D. L. 2005, ApJS, 156, 13
- McLeod et al. (2006) McLeod, B., Geary, J., Ordway, M., Amato, S., Conroy, M., & Gauron, T. 2006, in Scientific Detectors for Astronomy 2005, ed. J. E. Beletic, J. W. Beletic, & P. Amico, 337
- Molina et al. (2008) Molina, M., Bassani, L., Malizia, A., Bird, A. J., Dean, A. J., Fiocchi, M., Panessa, F., de Rosa, A., & Landi, R. 2008, MNRAS, 390, 1217
- Park et al. (2006) Park, T., Kashyap, V. L., Siemiginowska, A., van Dyk, D. A., Zezas, A., Heinke, C., & Wargelin, B. J. 2006, ApJ, 652, 610
- Piconcelli et al. (2005) Piconcelli, E., Jimenez-Bailón, E., Guainazzi, M., Schartel, N., Rodríguez-Pascual, P. M., & Santos-Lleó, M. 2005, A&A, 432, 15
- Pratt et al. (2009) Pratt, G. W., Croston, J. H., Arnaud, M., & Böhringer, H. 2009, A&A, 498, 361
- Saez et al. (2011) Saez, C., Brandt, W. N., Shemmer, O., Chomiuk, L., Lopez, L. A., Marshall, H. L., Miller, B. P., & Vignali, C. 2011, ApJ, 738, 53
- Schwartz et al. (2006) Schwartz, D. A., Marshall, H. L., Lovell, J. E. J., Murphy, D. W., Bicknell, G. V., Birkinshaw, M., Gelbord, J. M., Georganopoulos, M., Godfrey, L., Jauncey, D. L., Jester, S., Perlman, E. S., & Worrall, D. M. 2006, ApJ, 647, L107
- Stark et al. (1992) Stark, A. A., Gammie, C. F., Wilson, R. W., Bally, J., Linke, R. A., Heiles, C., & Hurwitz, M. 1992, ApJS, 79, 77
- Venemans et al. (2007) Venemans, B. P., Röttgering, H. J. A., Miley, G. K., van Breugel, W. J. M., de Breuck, C., Kurk, J. D., Pentericci, L., Stanford, S. A., Overzier, R. A., Croft, S., & Ford, H. 2007, A&A, 461, 823
- Worrall (2009) Worrall, D. M. 2009, A&A Rev., 17, 1