Universidade Tecnológica Federal do Paraná, Campus Campo Mourão, 87301-006, Campo Mourão, Paraná, Brazil
Social and economic systems Systems obeying scaling laws Complex systems
Scaling laws and universality in the choice of election candidates
Abstract
Nowadays there is an increasing interest of physicists in finding regularities related to social phenomena. This interest is clearly motivated by applications that a statistical mechanical description of the human behavior may have in our society. By using this framework, we address this work to cover an open question related to elections: the choice of elections candidates (candidature process). Our analysis reveals that, apart from the social motivations, this system displays features of traditional out-of-equilibrium physical phenomena such as scale-free statistics and universality. Basically, we found a non-linear (power law) mean correspondence between the number of candidates and the size of the electorate (number of voters), and also that this choice has a multiplicative underlying process (lognormal behavior). The universality of our findings is supported by data from elections from countries. In addition, we show that aspects of network scale-free can be connected to this universal behavior.
pacs:
89.65.-spacs:
89.75.Dapacs:
89.75.-k1 Introduction
Social phenomena are nowadays ubiquitous in the research performed by many physicists. In these investigations, the human behavior plays a central role and it constitutes the basic ingredient of the emergent picture. However, despite the complex scenario related to human activities, statistical physics models have been successfully applied to explain collective aspects of social systems [3, 6, 2, 8, 7, 4, 1, 5]. This success gives rise to the possibility that, similarly to large-scale physical thermodynamic systems, large groups of interacting humans may exhibit universal statistical properties. For the society organization in general, this statistical mechanical description of the human activities seems to be promising in resource management, service allocation, political strategies, among others.
In this context, aspects related to the formation and spreading of opinions have attracted great interest. However, while several models [9] such as the voter [10], Axelrod [11], majority [12] or the Sznajd [13] have been proposed aiming to investigate this scenario, far less attention has been paid to empirical investigations. An exception is the electoral process which has been extensively studied concerning the election results. In fact, Costa Filho et al. [14] (see also Ref. [15]) reported that the distribution of votes among candidates for one Brazilian federal election follows a power law in a limited interval of the number of votes. Bernardes et al. [16] reproduced this behavior employing a network model coupled with the Sznajd rule. By using Brazilian results of federal and local elections Lyra et al. [17] showed that the distribution of votes is well adjusted by a generalized Zipf’s law. Gonzalez et al. [18] found a similar behavior for Indian elections. Travieso and Costa [19] investigated a network model which qualitatively reproduces the distribution profile of votes. Araripe et al. [20] studied the vote percentage in mayoral elections taking the number of candidates into account. For the case of proportional elections Fortunato and Castellano [21] reported that a universality class of vote distribution emerges when considering the party and the personal votes. The distribution profile is quite similar to a lognormal and was modelated by a branching process. Correlations and memory were reported by Andresen et al. [22] for Norwegian polling time series and Hernández-Saldaña [23] investigated the vote distributions for one mexican party. Araripe and Costa Filho [24] showed that the universality class of Fortunato and Castellano is not fully verified for the Brazilian elections. Borghesi and Bouchaud [25] reported a logarithmic decay of the spatial correlations for turnout rates and winning fraction votes with the distance among towns. Finally, in a recent article, Araujo et al. [26] proposed a model to investigate plurality elections.
Naturally, two aspects are essentials in an election: have a prior set of candidates (candidature process) from which some of them are elected by voters. This last aspect was investigated in Refs. [14, 15, 16, 17, 18, 19, 20, 21, 22, 23, 24, 25, 26]. However, the candidature process, which is intrinsically related with the final results of an election since it drastically limits the choice of voting, has not been investigated yet. In this letter we fill this hiatus showing that, despite social or cultural or even psychological characteristics, a robust regularity emerges. In the following we present our data set as well as some particularities of each analyzed election, the statistical analysis of the data and results from our model, and our conclusions.
2 Data presentation and analysis
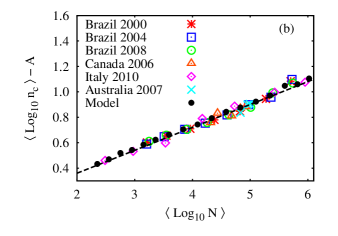
As database, we have 16 elections [27] from Brazil (1996, 2000, 2004, 2008 - mayoral and city council elections), Italy (2010 - mayoral elections), England (2006, 2010 - city council elections), Canada (2006, 2008 - parliamentary elections), and Australia (2004, 2007, 2010 - parliamentary elections). There are 5 mayoral elections, 6 city council elections and 5 national elections. The data are constituted by the number of candidates in each local political division as well as the number of voters. In Brazil, general elections are held every four years and each city votes for executive (mayor) and legislative (councilor). The executive is composed by one mayor and the number of legislative representatives is limited by the size of the local populations. Therefore we have taken only towns with up to 47600 inhabitants, for which the number of councilor is 9. They correspond to of the Brazilian cities and the non-use of this limitation does not affect our results. For the Italian elections we have only mayoral elections (Provinciali and Comunali). In the case of English elections, we have taken the council elections standing in all 624 wards in the London boroughs, where most of the wards have 3 seats (only 9 wards have a smaller number). In the case of Canada and Australia the data are from the “House of Commons” and the “House of Representatives” elections, each one having 308 and 160 members respectively. In both cases, the candidates are elected in single-member elections disputed in each electoral district.
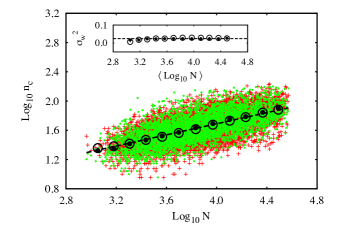
We start by investigating how the number of candidates () increases with number of voters (). In Fig. 1 we show the scatter plot of these two variables taking the base-10 logarithms for the 2008 Brazilian city council election into account. Notice that a clear tendency emerges suggesting that increases with following a power law, i.e., . The linear behavior (in a log-log plot) is evidenced by the Pearson correlation coefficient . This value of as well as the scatter plot also reveals that this power law correspondence is subjected to fluctuations. A possible method to overcome the fluctuations is constructing windows logarithmically spaced in and evaluating the average value of the inside points. These mean values are also shown in Fig. 1 represented by open circles and empirical results showed to be very robust with respect to the number of windows . Now, the power law relation becomes evident where we have with the brackets representing the averages and for this election.
Figure 2(a) shows these mean values for city council elections and Fig. 2(b) does the same for mayoral and parliamentary elections. Note that we have ploted these relations discounting the constant value aiming to collapse the data. The good quality collapse and the values of suggest two classes of universality: one for single-member elections characterized by and another for the city council elections (multi-member elections) with . The previous result indicates that a voter also ponders the number of available seats in their candidature process. However, it is interesting to note that for London boroughs election there are 3 seats for each ward while in the Brazilian city council elections 9 seats are disputed and nevertheless the value of the exponent is approximately the same. This suggests that the responsibilities of public position have also a central role in the candidature process since the mayor or parliamentarian functions are in a different plateau of those ones of a local representative. Moreover, local candidates may have only a “short-range” popularity restricted to their community while mayors or a parliamentarians should have a greater influence.
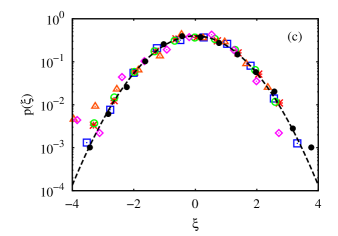
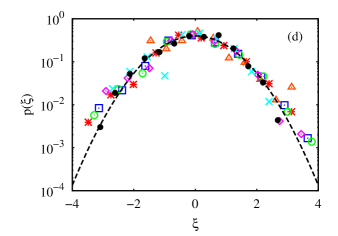
Let us now address the fluctuation question by first considering the variance of the logarithm of the number of candidates . We evaluate the variance by employing the same procedure used for the mean values, i.e., constructing windows logarithmically spaced. Our findings basically indicate that the variance does not depend on , fact that can be observed from the inset of Fig. 1. In addition to the variance, we may also investigate the fluctuations around the power law mean relation. For this, consider the variable where represents the function adjusted to averaged values considering windows. Figures 2(c) and 2(d) show the probability distribution function (PDF) of for the same elections of figures 2(a) and 2(b). From these figures we observe that follows very close to the standard Gaussian. Moreover, we also found that, like the mean values, the distributions does not depend on the number of windows .

At this point, it is interesting to summarize our empirical findings through the following expression:
| (1) |
or equivalently where and . Here, we use the variable to indicate that and are stochastic-like variables. While is normally distributed, should be distributed according to a lognormal PDF. Therefore, Eq.(1) represents a stochastic process where the number of candidates follows a power law mean relation with driven by a multiplicative stochastic noise following a lognormal PDF. Naturally, simulations using Eq.(1) are amazingly similar to the empirical ones. It is worth mentioning that, by averaging this equation, we have since .
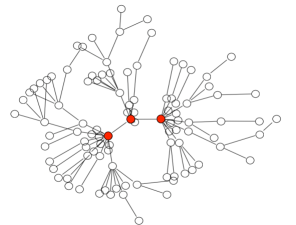
A possible direction to go beyond Eq.(1) is to employ the complex networks formalism [28]. Within this framework, the social agents are represented by nodes in a graph and the interactions or relationships are expressed by links among them. In our case, the social agents are the voters and the connections among them represent a kind of desire to be a candidate. In a first approximation, we may directly relate the degree number (number of links) to a kind of popularity measure, as more links (large degree) a voter has, the larger their popularity is and, consequently, larger is their probability to be a candidate (see Fig. 3). Naturally, other networks investigations and measurements could have been employed such as those ones related to centrality [29] but, as minimal model, we focus only on the degree distribution . Moreover, it is reasonable to consider that one voter will becomes a candidate if his popularity (degree) exceeds a characteristic value . Consequently, the number of candidates existing in a given electorate will be . At this point it is interesting to remark that there is no reason the suppose that also sensibly depends on and thereby, the only way to behaves non-linearly is to consider that the threshold value is a function dependent on . In fact, regarding our data, we do not have any information related to the connections existing among the voters in such way that we can not indicate a specific network to represent the system.
On the other hand, a remarkable fingerprint of many social networks is the scale-free distribution of the degree number, in other words, the distribution of the number of links (degree) is often well described by a power law . This universal feature is usually related to the existence of preferential attachment inside social networks [30] and has been found in several social systems (for examples see table II of Ref. [28]). Thus, in this context, a scale-free network where sounds as a natural choice for model our social system. Therefore, and since we empirically know that , the characteristic value should depend on the number of voters following another power law, i.e., with . Of course that candidates are not always popular persons, since in general there is no restrictions to be a candidate. In this way, may not be purely deterministic which can be accomplished employing that where is positive constant and is a random number with unitary mean and standard-deviation (negative numbers are avoided). At this point, it is worth mentioning that other choices for will lead to other functional dependences for , which are generally more complicated. For instance, when considering the Erdös-Rényi model [31] (or random network) for which , should be obtained from the transcendental equation .
To be more specific, we investigate the above scenario employing the Barabási and Albert [30] scale-free network (BA model) for which [30, 32]. In our simulations, we constructed networks where the numbers of nodes are identical to the empirical values of and the values were obtained directly from the values. The parameters and should be adjusted for each election by minimizing, for example, the difference between the simulated and empirical values of the quantities and , as we show in Fig. 1. We have found that is always a small number (smaller than 1) and for the single-member elections this parameter does not need to be considered, since the intrinsic fluctuations of the BA model are able to reproduce and the PDFs, indicating that the BA model can mimic the multiplicative noise existing in the data. It is also interesting to note that both parameters are not important when employing the scaled variables of Fig. 2(a)-(d). From these figures we can observe that the model reproduces the scatter plot very well, as well as the mean values and PDFs.
3 Summary and Conclusions
To sum up, we investigated how the number of candidates () is related with the number of voters () of each electoral district. Analyzing data from 16 elections we found that increases with following a power law mean relation, . The exponent was found to be divided in two classes: for single-member elections and for multi-member elections. We have also examined the fluctuations existing along the average relation revealing that the candidature is driven by a multiplicative noise following a lognormal PDF. A scale-free network model representing the social relationships was employed to reproduce the data behavior. The model results agree very well with the empirical data. The findings showed to be robust in the sense that they are independent of complex situation related to social and cultural differences among the countries as well as of individual psychological attributes of the candidates. This robustness is frequently found in out-of-equilibrium systems or systems poised at criticality, where few mechanisms can lead to scale-free statistics and self-organized criticality[33]. Finally, we believe that our findings may have implications on the political scene concerning the candidature process. In particular our work shows that popularity-like measures may depend on the system size.
Acknowledgements.
We thank CNPq and CAPES (Brazilian agencies) for financial support.References
- [1] \NameRadicchi F. \REVIEWPhys. Rev. E802009026118.
- [2] \NameAusloos M. Petroni F. \REVIEWEurophys. Lett.77200738002.
- [3] \NameGonzález M. C., Hidalgo C. A. Barabási A. L. \REVIEWNature4532007779.
- [4] \NameRybski D., Buldyrev S. V., Havlin S., Liljeros F.Makse H. A. \REVIEWProc. Natl. Acad. Sci.106200912640.
- [5] \NameRibeiro H. V., de Souza R. T., Lenzi E. K., Mendes R. S. Evangelista L. R. \REVIEWNew J. Phys.132011023028.
- [6] \NameRatkiewicz J., Fortunato S., Flammini A., Menczer F. Vespignani A. \REVIEWPhys. Rev. Lett.1052010158701.
- [7] \NameCattuto C., Barrat A., Baldassarri A. Schehr G. \REVIEWProc. Natl. Acad. Sci.26200910511.
- [8] \NameRozenfeld H. D., Rybski D., Andrade J. S., Batty M., Stanley H. E. Maks H. A. \REVIEWProc. Natl. Acad. Sci.105200818702.
- [9] \NameCastellano C., Fortunato S. Loreto V. \REVIEWRev. Mod. Phys.812009591.
- [10] \NameClifford P. Sudbury A. \REVIEWBiometrika601973581.
- [11] \NameAxelrod R. \REVIEWJ. Conflict Resolut.411997203.
- [12] \NameGalam S. \REVIEWPhysica A2741999132.
- [13] \NameSznajd-Weron K. Sznajd J. \REVIEWInt. J. Mod. Phys. C1120001167.
- [14] \NameCosta Filho R. N., Almeida M. P., Andrade J. S. Moreira J. E. \REVIEWPhys. Rev. E6019991067.
- [15] \NameCosta Filho R. N., Almeida M. P., Moreira J. E. Andrade J. S. \REVIEWPhysica A3222003698.
- [16] \NameBernardes A. T., Stauffer D. Kertész J. \REVIEWEur. Phys. J. B252002123.
- [17] \NameLyra M. L., Costa U. M. S., Costa Filho R. N. Andrade J. S. \REVIEWEurophys. Lett.622003131.
- [18] \NameGonzalez M. C., Sousa A. O. Herrmann H. J. \REVIEWInt. J. Mod. Phys. C16200445.
- [19] \NameTravieso G. da Fontoura Costa L. \REVIEWPhys. Rev. E742006036112.
- [20] \NameAraripe L. E., Costa Filho R. N., Herrmann H. J.Andrade J. S. \REVIEWInt. J. Mod. Phys. C1720061809.
- [21] \NameFortunato S. Castellano C. \REVIEWPhys. Rev. Lett.992007138701.
- [22] \NameAndresen C. A., Hansen H. F., Hansen A., Vasconcelos G. L. Andrade J. S. \REVIEWInt. J. Mod. Phys. C1920081647.
- [23] \NameHernández-Saldaña H. \REVIEWPhysica A38820092699.
- [24] \NameAraripe L. E. Costa Filho R. N. \REVIEWPhysica A38820094167.
- [25] \NameBorghesi C.Bouchaud J.-P. \REVIEWEur. Phys. J. B752010395.
- [26] \NameAraújo N. A. M., Andrade J. S. Herrmann H. J. \REVIEWPLoS ONE52010e12446.
- [27] \REVIEWhttp://www.tse.gov.br, http://elezionistorico.interno.it, http://data.london.gov.uk/taxonomy/keywords/elections, http://www.aec.gov.au, http://www.elections.ca/accessed in january 2011.
- [28] \NameAlbert R. Barabási A. L. \REVIEWRev. Mod. Phys.74200247.
- [29] \NameBorgatti S. P. Everett M. G. \REVIEWSocial Networks282006466.
- [30] \NameBarabási A. L. Albert R. \REVIEWScience2861999509.
- [31] \NameErdös P. Rényi A. \REVIEWPubl. Math (Debrecen)61959290.
- [32] \NameBarabási A. L., Albert R. Jeong H. \REVIEWPhysica A2721999173.
- [33] \NameBak P. \BookHow nature works \PublSpringer-Verlag, New York \Year1996.