Finding Fossil Groups: Optical Identification and X-ray Confirmation
Abstract
We report the discovery of 12 new fossil groups of galaxies, systems dominated by a single giant elliptical galaxy and cluster-scale gravitational potential, but lacking the population of bright galaxies typically seen in galaxy clusters. These fossil groups (FGs), selected from the maxBCG optical cluster catalog, were detected in snapshot observations with the Chandra X-ray Observatory. We detail the highly successful selection method, with an 80% success rate in identifying 12 FGs from our target sample of 15 candidates. For 11 of the systems, we determine the X-ray luminosity, temperature, and hydrostatic mass, which do not deviate significantly from expectations for normal systems, spanning a range typical of rich groups and poor clusters of galaxies. A small number of detected FGs are morphologically irregular, possibly due to past mergers, interaction of the intra-group medium (IGM) with a central AGN, or superposition of multiple massive halos. Two-thirds of the X-ray-detected FGs exhibit X-ray emission associated with the central BCG, although we are unable to distinguish between AGN and extended thermal galaxy emission using the current data. This sample, a large increase in the number of known FGs, will be invaluable for future planned observations to determine FG temperature, gas density, metal abundance, and mass distributions, and to compare to normal (non-fossil) systems. Finally, the presence of a population of galaxy-poor systems may bias mass function determinations that measure richness from galaxy counts. When used to constrain power spectrum normalization and , these biased mass functions may in turn bias these results.
Subject headings:
galaxies: clusters: general, galaxies: groups: general, galaxies: clusters: intracluster medium, X-rays: galaxies: clusters, surveys1. INTRODUCTION
Fossil groups (FGs) are systems dominated by a single, giant elliptical galaxy, yet their X-ray emission indicates a deeper cluster-scale gravitational potential. They are generally defined as systems with a = 2 magnitude difference between the first and second rank galaxies within 111 is the radius within which the mean cluster mass density is 200 times the critical density., and they have an extended thermal X-ray halo with erg s-1 (Jones et al., 2003). FGs are thought to be old, isolated galaxy groups and clusters in which the large galaxies have coalesced through dynamical friction (Ponman et al., 1994; Mulchaey & Zabludoff, 1999; Jones et al., 2003). This coalesced cluster scenario is further supported by high X-ray temperature measurements (up to 4 keV) and by the galaxy velocity dispersions (e.g., Mendes de Oliveira et al., 2006, 2009; Cypriano et al., 2006; Proctor et al., 2011). The high NFW (Navarro et al., 1997) halo concentration parameters, lack of spectral star formation indicators, and large magnitude difference suggest these systems finished merging in the distant past, perhaps before (Jones et al., 2000; Wechsler et al., 2002; D’Onghia et al., 2005; Khosroshahi et al., 2007).
Recent studies of X-ray selected FGs paint a more complicated picture. The cooling time of FGs is significantly shorter than the Hubble time (e.g., Sun et al., 2004; Khosroshahi et al., 2004, 2006a), yet they typically lack cool cores, suggesting that these systems may be younger or more active than previously thought (Mendes de Oliveira et al., 2009). Regular (non-fossil) rich groups often possess cool cores (e.g., Finoguenov & Ponman, 1999), even in the presence of AGN activity. In addition, there is evidence for enhanced SN II metal fraction in the central regions of FGs, suggesting a scenario where SN II powered winds resulting from merging late type galaxies erase the original central SN Ia Fe mass fraction dominance (Dupke et al., 2010). This is consistent with the previously found disky isophotes of the central dominant galaxies in FGs by Khosroshahi et al. (2006b) and also with the presence of shells in the stellar component in at least one of these galaxies, indicative of multiple past mergers (Eigenthaler & Zeilinger, 2009). Furthermore, some authors suggest that the FGs we see are the tail of the cluster distribution, possessing few galaxies at their current epoch for any number of reasons: failure to form those galaxies, early merging, or a quiescent state during a cycle of galaxy accretion (Mulchaey & Zabludoff, 1999; von Benda-Beckmann et al., 2008; La Barbera et al., 2009; Dariush et al., 2010; Smith et al., 2010; Cui et al., 2011). The truth about fossil groups is somewhat muddled by the phenomenological rather than physical definition of the class. Extracting a useful physical definition is in turn complicated by the relatively small number of FGs with deep X-ray observations. Indeed, what we call “fossil groups” perhaps comprise a heterogeneous set of galaxy systems with different formation and evolution histories.
To characterize the ages and structural properties of FGs, it is crucial to have good data, especially X-ray observations. Detailed study of the intra-group medium (IGM) metal abundance, temperature structure, and inferred mass distribution help to constrain the halo formation epoch and the importance of recent star formation or AGN activity. The available X-ray data are typically photon-poor due to the serendipitous nature of FG detections, and this has limited their study. To address this problem, we have embarked on a project to identify a large sample of FGs for future detailed follow-up studies. In the work presented here, we have constructed a sample of 15 fossil group candidates, using the maxBCG cluster catalog (Koester et al., 2007a) to optically identify the candidates, which are then targeted with X-ray snapshots using the Chandra X-ray Observatory to confirm the existence of a bright X-ray halo. This initial sample of confirmed FGs (using the phenomenological classification) will be invaluable for follow-up, including deep X-ray observations to study the metallicity structure of the gas and concentration of the mass distribution; and optical spectroscopy to compare the velocity dispersion to the X-ray mass.
Throughout this paper we use a CDM cosmology with , , and km s-1 Mpc-1 (or ). Except where specified with notation, all numerical values from the literature have been scaled to correspond to this cosmology. Uncertainties are 1 and upper/lower limits are 3, unless stated otherwise.
2. OPTICAL SAMPLE SELECTION
To select a large sample of FG targets, we used the maxBCG cluster catalog (Koester et al., 2007a). This is a volume-limited catalog of over 17,000 optically selected red-sequence clusters in the redshift range with precise photometric redshifts () and optical richness estimates from the Sloan Digital Sky Survey DR4 (SDSS; York et al., 2000; Adelman-McCarthy et al., 2006). The optical richness employed, , is the number of red-sequence member galaxies brighter than (in the -band) found within a scale radius of the brightest cluster galaxy (BCG; Hansen et al., 2005). The mean properties of this catalog have been studied in detail, and we have obtained mean X-ray luminosities (Rykoff et al., 2008), velocity dispersions (Becker et al., 2007), and a mass calibration via the mean weak-lensing shear profile around maxBCG clusters (Johnston et al., 2007; Sheldon et al., 2009). Simulations have shown that the catalog purity and completeness are very high (90%; Koester et al., 2007b; Rozo et al., 2007).
We selected for several optical characteristics that are expected of FGs from the empirical definition of the class. In particular, at a given optical richness, these systems should have a larger magnitude difference between the BCG and the next brightest galaxy and should have highly luminous BCGs typical of massive clusters. In our initial selection we restricted ourselves to systems in the richness range , corresponding to a mass range of (Johnston et al., 2007). Our aim was to select systems rich enough to have sufficient X-ray luminosity for detection and analysis, and at the same time remain in the FG range where the BCG can truly dominate the system. We note that the publicly released maxBCG catalog was restricted to ; we used a slightly extended catalog described by Rykoff et al. (2008), including an additional 3532 clusters with and allowing us to use the same richness bins studied in the analysis of maxBCG galaxy dynamics (Becker et al., 2007) and weak lensing (Johnston et al., 2007; Sheldon et al., 2009). To maximize the flux in the X-ray, we restricted the sample to those systems with a confirmed spectroscopic BCG redshift in the range ; the lower redshift cut is imposed by the maxBCG photometric redshift lower limit of . At the time of selection from SDSS DR4, 42% of all maxBCG clusters in this redshift range had a spectroscopically determined BCG redshift.
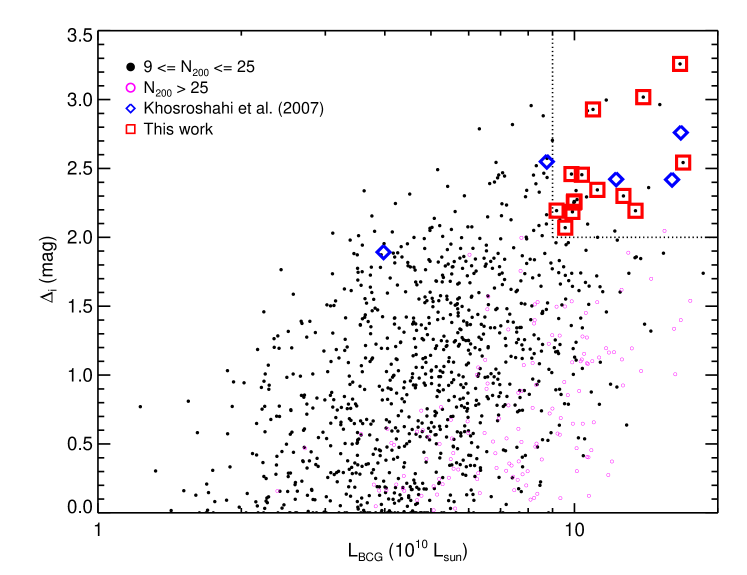
To quantify the galaxy magnitude gap representative of FGs, we used the difference in -band magnitude of the BCG and the next brightest red-sequence cluster member within , denoted by . The values were estimated from the mass-scaling relation of Johnston et al. (2007). Bright non-red-sequence galaxies projected within were not considered because the majority of these are foreground galaxies unassociated with the cluster. Thus, we have opted for a more complete sample of systems with this magnitude gap at the risk of a small amount of impurity. We refined our selection to all the systems with and BCG -band luminosity ( in our adopted cosmological framework). There were 26 maxBCG systems that passed this selection cut. We illustrate the maxBCG selection in Figure 1, plotting as a function of ; these two values are correlated, as the most luminous BCGs also tend to have a large . However, richer maxBCG clusters () in the same redshift range (magenta points) do not extend this trend to the largest , despite having relatively larger . We discuss selection effects of our sample more fully in a companion paper by Proctor et al. (2011). The cuts based on these parameters are consistent with the majority of known FG systems (e.g. Khosroshahi et al., 2007) that overlap the SDSS footprint, marked with blue diamonds in Figure 1. These five systems are present in the maxBCG catalog, however they each fail one or more of our selection criteria, with four falling out of our redshift range and the fifth having .
Deeper X-ray follow-up is a major goal of this sample assembly, and the most efficient current instrument for this purpose is the XMM-Newton X-ray Observatory. The 15 arcsec spatial resolution of XMM-Newton corresponds to 30 kpc at . This is a sizeable fraction of the typical group core radius, so to maximize the utility of these targets for deeper X-ray spectroscopic analysis we sought to reduce the possibility of bright central AGN emission that might contaminate the diffuse IGM emission. We rejected all BCGs that have evidence of Seyfert or LINER-like line emission with (e.g. Kauffmann et al., 2003). This eliminated 3 of the 26 systems. Additionally, we rejected all BCGs that match radio sources in the FIRST catalog (White et al., 1997) within 3 arcsec of the BCG position (6 kpc at ), eliminating another 6 candidates. Finally, we rejected 2 systems that have bright stars with in the field-of-view that exceed the bright star limit for XMM-Newton. In total, we identified 15 candidate FGs, marked with red squares in Figure 1 and summarized in Table 1.
The elimination of candidates based on AGN activity, especially in the radio, could produce a selection bias. The motivation for this selection was based on Allen et al. (2006) and Balmaverde et al. (2008), who find a clear correlation between Bondi accretion rate and central engine jet power in samples of low-power radio galaxies. The presence of radio emission from a jet or expanding bubbles is a signal of strong accretion, with rate . As the X-ray emission measure of this plasma is , the flux within the central few kpc can be quite bright and contaminate the XMM-Newton surface brightness profile, and through an abundance of caution, we expunged these radio-bright candidates. The direct correlation between AGN radio and X-ray luminosity in BCGs is not well constrained, although Hickox et al. (2009) find a small overlap ( 10%) between radio- and X-ray-bright AGN in general, with the former tending to live in luminous red sequence galaxies and the latter tending to “green valley” galaxies. The possible effects of this selection on our sample are discussed in Section 4.1.
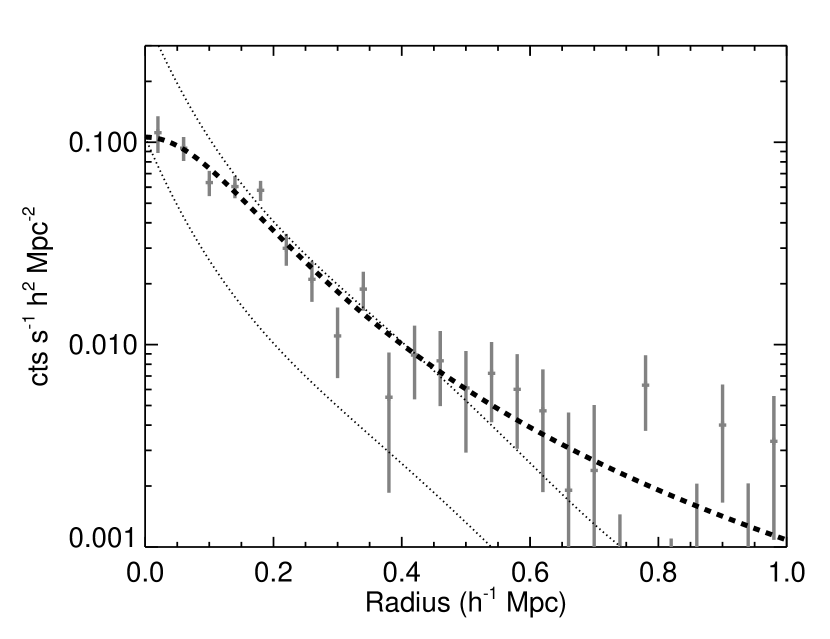
The final criterion in the FG definition is a cluster-scale X-ray halo, which also serves as confirmation of a collapsed system rather than a projection of unrelated galaxies. While six of the FG candidates are bright enough to be detected at the level in the ROSAT All Sky Survey (RASS), a majority of these optically selected targets do not have sufficient flux to be detected in RASS (see Table 1). We therefore estimated the mean and radial profile using the stacking procedure described by Rykoff et al. (2008), selecting 170 maxBCG systems chosen with criteria used for the 15 FG targets (; ; and ). In order to select enough systems for the stacking analysis we expanded the redshift range to , and we did not require BCG spectroscopic redshifts nor did we filter for active galaxies or bright stars. The stacked RASS profile is shown in Figure 2 along with a model fit with . To show that the stacked FG profile is significantly extended, we also stacked a representative sample of RASS point sources treated as if these sources were at the redshifts of the maxBCG targets (see Section 3.3.1 in Rykoff et al., 2008). The stacked point source profile is shown with dotted lines with two scalings in Figure 2. In one scaling the central flux is matched to the stacked FG profile; in the second, the flux at is matched to the FG profile. In both cases it is clear that the stacked FG emission is significantly extended when compared to RASS point sources.
| Target BCG | short nameaaThe short names for each target are used throughout this work. | RAbbRA, Dec are the J2000 coordinates of the BCG, in degrees. | DecbbRA, Dec are the J2000 coordinates of the BCG, in degrees. | ccThe redshift is the BCG spectroscopic value from SDSS DR4 (Adelman-McCarthy et al., 2006). | dd, a richness estimate, is the number of red-sequence cluster galaxies brighter than (in the -band) found within of the BCG. | ee is the difference in -band magnitude of the BCG and the next brightest red-sequence cluster member within . | ff is the -band luminosity of the BCG. | RASSggRASS indicates a 2 or better detection in the ROSAT All Sky Survey. | obs. date (OBSID) | hhEffective exposure time of cleaned event data. |
|---|---|---|---|---|---|---|---|---|---|---|
| (mag) | ( ) | (ksec) | ||||||||
| SDSS J013325.87102618.6 (catalog SDSS J013325.87-102618.6) | J01331026 | 23.3578 | 10.4385 | 0.113 | 12 | 2.45 | 10.4 | 2009-05-29 (10753) | 10.0 | |
| SDSS J081526.59395935.5 (catalog SDSS J081526.59+395935.5) | J08153959 | 123.8608 | 39.9932 | 0.129 | 12 | 3.26 | 16.7 | 2008-12-12 (10758) | 5.1 | |
| SDSS J082122.54405123.7 (catalog SDSS J082122.54+405123.7) | J08214051 | 125.3439 | 40.8566 | 0.125 | 10 | 2.19 | 9.9 | 2009-01-04 (10474) | 10.0 | |
| SDSS J085640.72055347.3 (catalog SDSS J085640.72+055347.3) | J08560553 | 134.1697 | 5.8965 | 0.094 | 16 | 2.26 | 10.0 | 2009-01-09 (10750) | 5.5 | |
| SDSS J090638.27030139.1 (catalog SDSS J090638.27+030139.1) | J09060301 | 136.6595 | 3.0276 | 0.136 | 9 | 2.93 | 10.9 | 2009-01-14 (10475) | 10.0 | |
| SDSS J100742.53380046.6 (catalog SDSS J100742.53+380046.6) | J10073800 | 151.9272 | 38.0130 | 0.112 | 24 | 2.54 | 16.9 | 2009-02-09 (10755) | 4.7 | |
| SDSS J101745.57015645.8 (catalog SDSS J101745.57+015645.8) | J10170156 | 154.4399 | 1.9461 | 0.118 | 12 | 2.34 | 11.2 | 2009-03-23 (10754) | 9.9 | |
| SDSS J103930.43394718.9 (catalog SDSS J103930.43+394718.9) | J10393947 | 159.8768 | 39.7886 | 0.093 | 14 | 2.46 | 9.9 | 2009-01-14 (10749) | 5.1 | |
| SDSS J104548.50042032.5 (catalog SDSS J104548.50+042032.5) | J10450420 | 161.4521 | 4.3424 | 0.154 | 13 | 2.07 | 9.6 | 2009-02-01 (10476) | 9.9 | |
| SDSS J113305.51592013.7 (catalog SDSS J113305.51+592013.7) | J11335920 | 173.2730 | 59.3372 | 0.133 | 13 | 2.26 | 10.0 | 2009-07-08 (10472) | 5.7 | |
| SDSS J113623.71071337.5 (catalog SDSS J113623.71+071337.5) | J11360713 | 174.0988 | 7.2271 | 0.103 | 17 | 2.25 | 10.0 | 2009-02-09 (10756) | 5.0 | |
| SDSS J115305.32675351.5 (catalog SDSS J115305.32+675351.5) | J11536753 | 178.2722 | 67.8977 | 0.117 | 17 | 2.19 | 13.4 | 2009-06-21 (10473) | 5.0 | |
| SDSS J133626.96545353.8 (catalog SDSS J133626.96+545353.8) | J13365453 | 204.1124 | 54.8983 | 0.107 | 10 | 3.02 | 13.9 | 2009-09-25 (10752) | 7.1 | |
| SDSS J141004.19414520.8 (catalog SDSS J141004.19+414520.8) | J14104145 | 212.5175 | 41.7558 | 0.094 | 21 | 2.30 | 12.7 | 2009-07-07 (10757) | 5.1 | |
| SDSS J141115.89573609.0 (catalog SDSS J141115.89+573609.0) | J14115736 | 212.8162 | 57.6025 | 0.106 | 16 | 2.19 | 9.2 | 2009-07-23 (10751) | 6.9 |
The derived estimates were used to plan our follow-up X-ray observations with Chandra, described in the next Section. Rykoff et al. (2008) show that the mean of maxBCG systems scales as a power-law with (over two orders of magnitude in ) and also scales with for the poorer clusters and groups. Thus, the FGs are expected to be more X-ray luminous than typical maxBCG systems at a similar richness.
3. X-RAY OBSERVATIONS AND DATA ANALYSIS
3.1. X-Ray Data and Reduction
The X-ray observations were performed with the Chandra X-ray Observatory between December 2008 and September 2009 in the form of 5–10 ksec snapshots (see Table 1). Data were obtained using the ACIS-S3 chip, with the candidate fossil group BCG centered in the field of view. Standard processing was performed on the raw event files, including the background reduction tools applicable to the VFAINT observing mode222See http://cxc.harvard.edu/cal/Acis/Cal_prods/bkgrnd/current/background.html.. The resulting 0.3–7 keV light curves were filtered to remove additional times of high background and applied to produce cleaned event files. Point sources were identified from the 0.3–7 keV events using the CIAO tool wavdetect and masked out for the analysis of the extended emission. This included any emission clearly identified with the optical extent of the BCG, whether point-like or slightly extended. A separate analysis of these features is presented in Section 3.4.
3.2. X-Ray Spectral Analysis
Spectral extraction regions were identified from images in the 0.5–2 keV band, where the group emission should dominate, and chosen to encompass the bulk of the extended X-ray emission, with radii in the range – (129–356 kpc) centered on the peak of the X-ray emission. For two targets with irregular X-ray morphology (J01331026 and J10450420), the region was centered on the apparent centroid of the emission. Targets without obvious group emission (J08214051, J09060301, and J13365453) were assigned an extraction region of 250 kpc (–) centered on the optical BCG location to estimate an upper limit on the flux. A background region was defined for each observation from the remaining area of the ACIS-S3 chip, excluding the inner radius, the identified point sources, and the outer edge of the field of view. The outer extent of each background region was typically in size, oriented along the direction of the ACIS-S CCD array. This choice was made to reduce the effects of non-uniform molecular contamination on the CCD, which is thought to be thicker near the edges of the ACIS-S array and which substantially reduces the soft X-ray transmittance (Vikhlinin, 2004).
The spectral analysis was performed in XSPEC v12.6.0 utilizing the C-statistic, a modified Cash (1979) likelihood function that allows for inclusion of a background spectrum and a goodness-of-fit estimator similar to in the limit of many counts333The XSPEC implementation of the C-statistic is described in detail at http://heasarc.gsfc.nasa.gov/docs/xanadu/xspec/manual/XSappendixCash.html.. The X-ray spectrum for each group (see Figure 3) was fit with an absorbed APEC model (Smith et al., 2001) in the 0.4–7 keV band, with the redshift fixed at the BCG spectroscopic value from SDSS. The intervening Galactic column was fixed at the average value reported by the Leiden/Argentine/Bonn (LAB) merged survey (Kalberla et al., 2005); in all cases it was less than . The temperature and normalization were allowed to vary. For several groups, the metal abundance (using Anders & Grevesse (1989) photospheric solar abundances) was unconstrained during the initial fit and was frozen at 0.3 solar, the weighted mean value from the well-constrained fits and similar to that measured in 2 keV systems (Osmond & Ponman, 2004; Rasmussen & Ponman, 2007). The spectral fitting results are shown in Table 2.

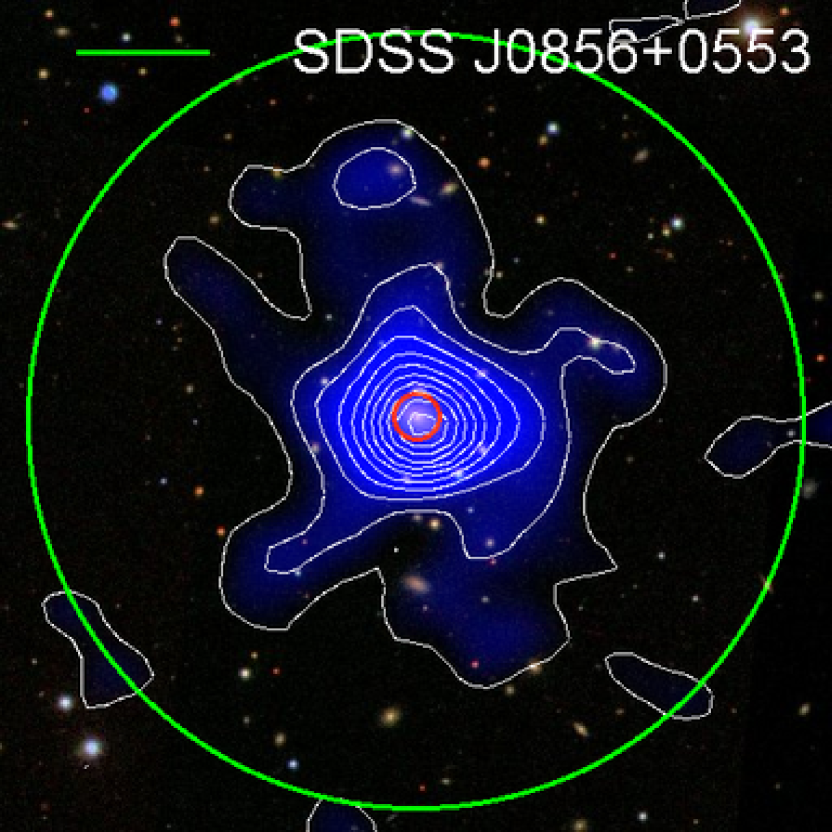
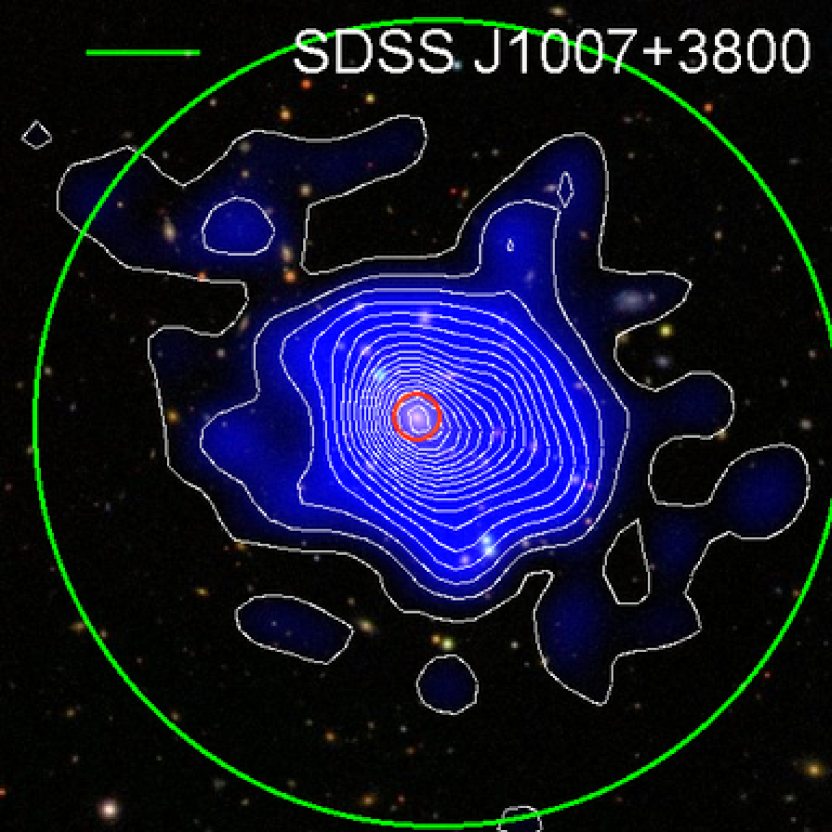
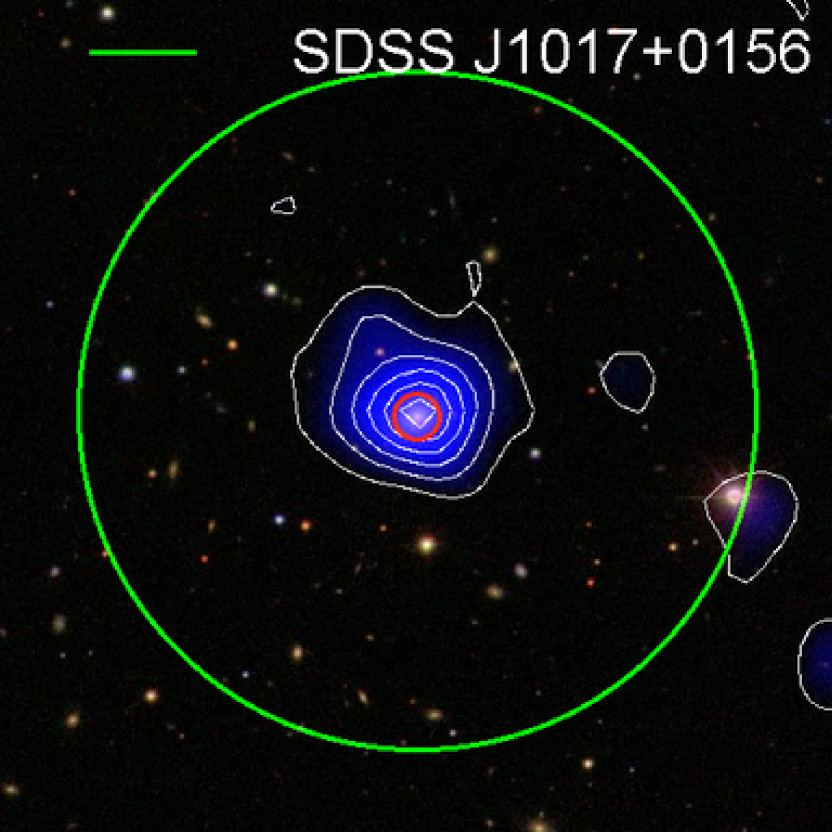
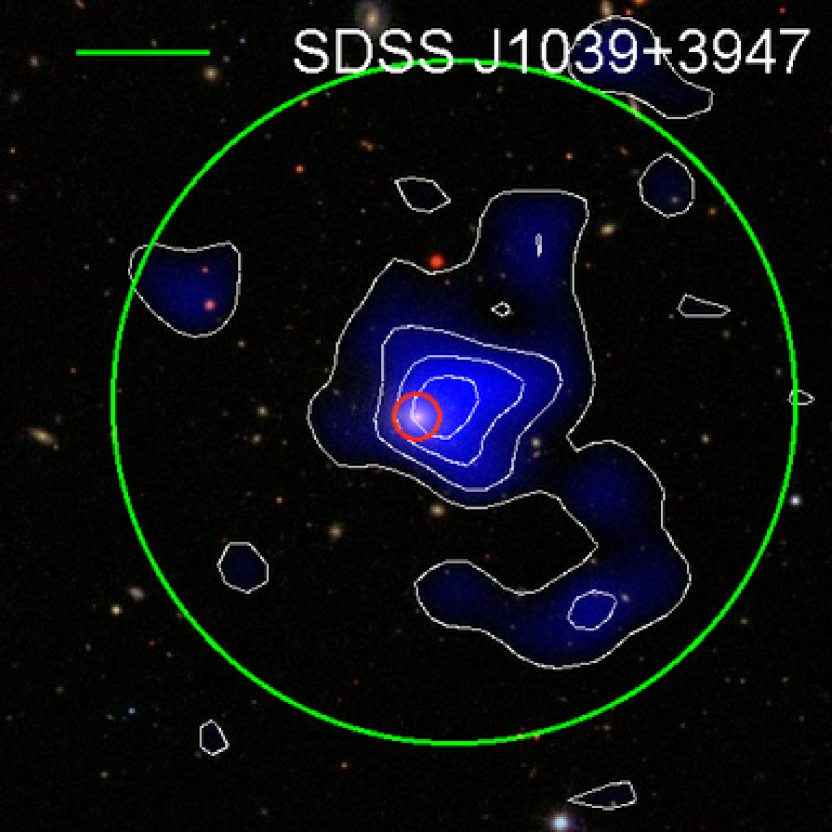
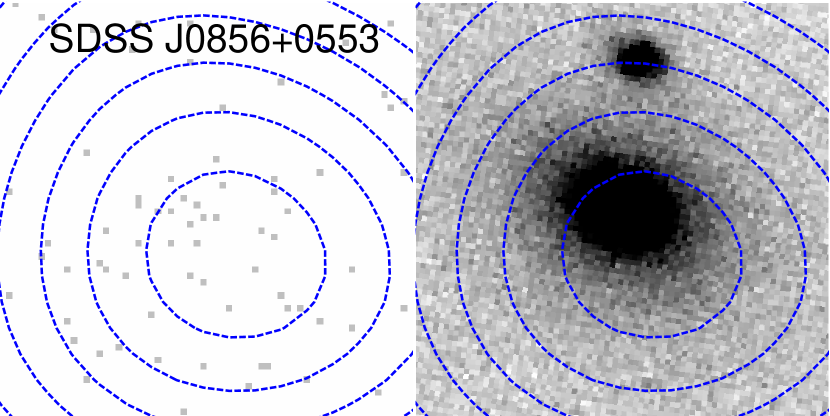
We consider a detection to be a 3 or greater excess of counts in the 0.5–2 keV band compared to the expected background within the extraction region. Twelve of the 15 targets were detected using this definition; all of the detections are easily visible to the eye in point-source-excluded images (see Figure 4). Eleven of these detected systems have well-constrained temperatures in the range 1–3 keV; while J01331026 is detected at 4.9, the 104 source counts are insufficient to constrain the spectral model. Errors on the spectral parameters were determined by sampling parameter space for each parameter, marginalizing over the other free parameters. For the systems with fixed abundance, we estimated the errors in other parameters by stepping (with XSPEC steppar) the abundance over the expected range of 0.1–1 solar. Absorbed fluxes and unabsorbed “soft” (0.5–2.0 keV rest frame) luminosities were determined from the best-fit spectral models. A “bolometric” (0.008–100 keV rest frame) luminosity with errors was determined for each group by extrapolating the unabsorbed spectral model. We assumed keV and abundance of 0.3 solar for the three undetected targets, and used this model along with the background counts estimate to determine upper limits on the diffuse X-ray flux and luminosity. An identical model was assumed for J01331026 to calculate its flux and luminosity. The source and total counts are shown in Table 2, along with the flux and luminosity estimates.
3.3. X-Ray Spatial Analysis
To compare to existing results and expectations for self-similar scaling, cluster X-ray luminosities and masses are typically scaled to a common radius in terms of the average interior overdensity , where is the mean cluster mass density within radius , and is the critical density at (e.g., Maughan et al., 2006). The extraction regions we have applied are considerably smaller than the typical radius for for group potentials ( kpc, compared to kpc; see Table 3). Therefore we must estimate the luminosity correction factor by extrapolating the X-ray surface brightness profile, similar to the approach in previous studies (e.g., Jeltema et al., 2006). In the following analysis, we use the working assumption that the intra-group medium is spherical, non-rotating, isothermal, and in hydrostatic equilibrium to within the group gravitational potential.
Counts images of the ACIS-S3 field of view were constructed from the cleaned event lists, binning to pixels ( arcsec) and restricting the energy band to 0.5–2 keV, where the group emission dominates the background. For each detected group, two-dimensional spatial fitting was performed with the Sherpa package available in CIAO, using a circular model surface brightness profile for the FG emission and a constant baseline to account for the combined cosmic and instrumental background. The model was multiplied by an exposure map during the fit, while the background was multiplied by a mask containing the bad pixels and columns of the CCD, dithered according to the aspect solution of the observation. Fits were performed in two dimensions to a region oriented along the direction of the ACIS-S array, encompassing the region defined as the background for spectral fitting (see Section 3.2), chosen in such a way as to to reduce the effects of non-uniform molecular contamination on the CCD. Point source regions were excluded in the fitting, which was done using the Cash (1979) statistic, allowing , core radius , the emission center, and the FG and background amplitude to vary. The fit results are summarized in Table 3.
| FG | aa was fixed to 2 keV to estimate detection limits for undetected sources and J01331026. | abundbbAbundance assumes the solar photospheric values of Anders & Grevesse (1989). The value was fixed to 0.3 for fits with unconstrained abundance. | fluxccAbsorbed model flux in the 0.5–2 keV band. Upper limits are 3. | ddUnabsorbed model luminosity in the 0.5–2 keV band, rest frame. Upper limits are 3. | eeUnabsorbed model luminosity in the 0.008–100 keV band, rest frame. Upper limits are 3. | src/totffCounts in the spectral extraction region in the 0.5–2 keV band, observed frame. Source counts are estimated from the spectral model. | sig.ggDetection significance in units of . | |
|---|---|---|---|---|---|---|---|---|
| ( ) | (keV) | (solar) | ( cgs) | ( cgs) | ( cgs) | counts | () | |
| J01331026 | 3.2 | 2.00 | 0.30 | 3.4 | 1.2 | 2.9 | 104/455 | 4.9 |
| J0815+3959 | 4.5 | 1.26 | 0.30 | 6.8 | 3.5 | 7.3 | 87/308 | 5.0 |
| J0821+4051 | 4.6 | 2.00 | 0.30 | 7.6 | 3.5 | 8.4 | /742 | |
| J0856+0553 | 3.6 | 2.73 | 0.30 | 20.0 | 4.8 | 12.6 | 283/498 | 12.7 |
| J0906+0301 | 2.9 | 2.00 | 0.30 | 3.8 | 2.0 | 4.8 | /226 | |
| J1007+3800 | 1.4 | 2.60 | 0.24 | 33.3 | 11.0 | 28.2 | 396/598 | 16.2 |
| J1017+0156 | 3.9 | 2.13 | 0.30 | 4.7 | 1.9 | 4.5 | 118/400 | 5.9 |
| J1039+3947 | 1.6 | 1.68 | 0.30 | 4.8 | 1.1 | 2.5 | 63/123 | 5.7 |
| J1045+0420 | 3.5 | 2.47 | 0.11 | 24.5 | 17.2 | 43.7 | 610/1023 | 19.1 |
| J1133+5920 | 0.9 | 1.57 | 0.41 | 7.1 | 3.4 | 7.5 | 110/184 | 8.1 |
| J1136+0713 | 3.3 | 2.64 | 0.30 | 10.1 | 2.9 | 7.6 | 122/195 | 8.7 |
| J1153+6753 | 1.5 | 1.75 | 0.06 | 10.9 | 4.1 | 9.7 | 128/224 | 8.6 |
| J1336+5453 | 1.0 | 2.00 | 0.30 | 4.9 | 1.5 | 3.5 | /259 | |
| J1410+4145 | 1.5 | 1.62 | 0.33 | 25.1 | 5.8 | 13.0 | 334/508 | 14.8 |
| J1411+5736 | 1.2 | 1.57 | 0.14 | 5.4 | 1.6 | 3.7 | 109/213 | 7.5 |
| FG | kpc/arcmin | ap. cor.aaAperture correction factor to convert through the observed aperture to . | bbUnabsorbed model luminosity in the 0.5–2 keV band, rest frame, corrected to . | ccUnabsorbed model luminosity in the 0.008–100 keV band, rest frame, corrected to . | |||||
|---|---|---|---|---|---|---|---|---|---|
| (arcmin, kpc) | (kpc) | (kpc) | ( ) | ( cgs) | ( cgs) | ||||
| J01331026 | 124 | 2.07 256 | |||||||
| J0815+3959 | 139 | 1.80 249 | 0.40 | 25 | 443 | 2.5 | 1.5 | 5.4 | 11.4 |
| J0821+4051 | 135 | 1.85 250 | |||||||
| J0856+0553 | 105 | 2.12 223 | 0.32 | 7 | 587 | 5.7 | 2.8 | 13.7 | 35.9 |
| J0906+0301 | 145 | 1.72 250 | |||||||
| J1007+3800 | 123 | 2.07 253 | 0.50 | 50 | 712 | 10.3 | 1.6 | 17.6 | 45.5 |
| J1017+0156 | 128 | 1.46 187 | 0.47 | 20 | 626 | 7.0 | 1.7 | 3.2 | 7.8 |
| J1039+3947 | 104 | 1.24 129 | 0.40 | 25 | 512 | 3.8 | 3.0 | 3.2 | 7.4 |
| J1045+0420 | 161 | 2.21 356 | 0.40 | 25 | 621 | 6.8 | 1.5 | 25.7 | 65.3 |
| J1133+5920 | 142 | 1.20 171 | 0.40 | 25 | 496 | 3.5 | 2.3 | 7.7 | 17.0 |
| J1136+0713 | 114 | 1.25 142 | 0.40 | 25 | 642 | 7.5 | 3.2 | 9.5 | 24.6 |
| J1153+6753 | 127 | 1.37 174 | 0.40 | 25 | 522 | 4.0 | 2.3 | 9.5 | 22.6 |
| J1336+5453 | 118 | 2.12 250 | |||||||
| J1410+4145 | 105 | 2.03 213 | 0.39 | 25 | 496 | 3.5 | 2.0 | 11.5 | 25.9 |
| J1411+5736 | 117 | 1.34 156 | 0.40 | 25 | 495 | 3.4 | 2.5 | 4.0 | 9.3 |
Of the 12 FGs detected in extended X-ray emission, four have sufficient counts to constrain the model parameters. These are four of the five brightest targets, with erg cm-2 s-1 (0.5–2 keV). The fifth bright target, J10450420, is morphologically irregular and obviously not well-fit by a simple profile (see Section 4.3). The best-fit values range from 0.3 to 0.5, smaller than the value of 0.67 commonly found for clusters (e.g., Jones & Forman, 1999) but not unusually small for rich groups and poor clusters of similar temperature in this redshift range (Willis et al., 2005; Jeltema et al., 2006) or at (Osmond & Ponman, 2004). The values for the core radius are all comparatively small, ranging from 7 to 50 kpc, but consistent with the previously cited results. For the seven detections with unconstrained model parameters, we assumed the average best-fit values of and kpc to estimate the spatial extent of the X-ray emission and the luminosity corrections. Note that despite an X-ray detection, J01331026 was excluded from the remaining analysis, since its lack of a measured temperature rendered the spatial extrapolation too uncertain.
Based on the best-fit , , and with associated errors, we estimated and for each group. The mass within radius can be given as (e.g., Arnaud & Evrard, 1999):
| (1) |
Since , we can estimate with a simple analytic approximation (e.g., Arnaud & Evrard, 1999, Eq. 17). We chose to iteratively solve Eq. 1 for and , using the definition
| (2) |
The results are shown in Table 3; = 443–712 kpc and = 0.3–1.0 for the sample, typical values for groups and clusters in this temperature and redshift range (Willis et al., 2005; Jeltema et al., 2006; Finoguenov et al., 2007; Jeltema et al., 2009). These values are equivalent to what we derive from the analytic approximation.
Aperture corrections were calculated to scale the observed luminosity to that within , including the small () correction for excluded point source regions. The aperture corrections range from 1.5 to 3.0 with an average correction of 2.2. While these are large corrections, the attendant errors take into account the uncertainty in the model parameters. The corrections for the four groups with well-constrained models are 1.6–2.8, with errors of less than 30%. The aperture corrections and corrected luminosities are listed in Table 3.
To analyze the structure of the hot intra-cluster medium (ICM), researchers typically employ power ratios (multipole moments of the X-ray surface brightness) and centroid shifts that are sensitive to substructure and irregular morphology (e.g., Jeltema et al., 2008). Power ratios require thousands of counts and a well-constrained surface brightness out to , therefore we cannot employ them with the current snapshot data. We attempted to calculate centroid shifts for the detected FGs, however the results were inconclusive, with large errors driven by the low counting statistics. We present a qualitative analysis of the morphology, specifically the fraction of disturbed and relaxed clusters, in Section 4.1.
| FG | aa is the power law index, fixed to 1.7 for all but one source. | fluxbbAbsorbed model flux in the 0.5–2 keV band. | BCG | ddUnabsorbed model luminosity in the 0.5–2 keV band, rest frame. | ctseeCounts in BCG region, 0.3–7 keV. No background has been
subtracted. |
|---|---|---|---|---|---|
| ( cgs) | IGMccRatio of the BCG 0.5-2 keV flux to the detected diffuse flux from
Table 2. |
( cgs) | |||
| J01331026 | 1.8 | 1.03 | 0.30 | 0.33 | 35 |
| J10073800 | 1.7 | 1.38 | 0.04 | 0.45 | 23 |
| J10170156 | 1.7 | 0.42 | 0.09 | 0.17 | 15 |
| J10393947 | 1.7 | 0.94 | 0.20 | 0.21 | 17 |
| J10450420 | 1.7 | 0.22 | 0.01 | 0.14 | 7 |
| J11536753 | 1.7 | 1.50 | 0.14 | 0.55 | 20 |
| J14104145 | 1.7 | 1.67 | 0.07 | 0.38 | 30 |
| J14115736 | 1.7 | 1.25 | 0.23 | 0.37 | 22 |
3.4. BCG X-ray Emission
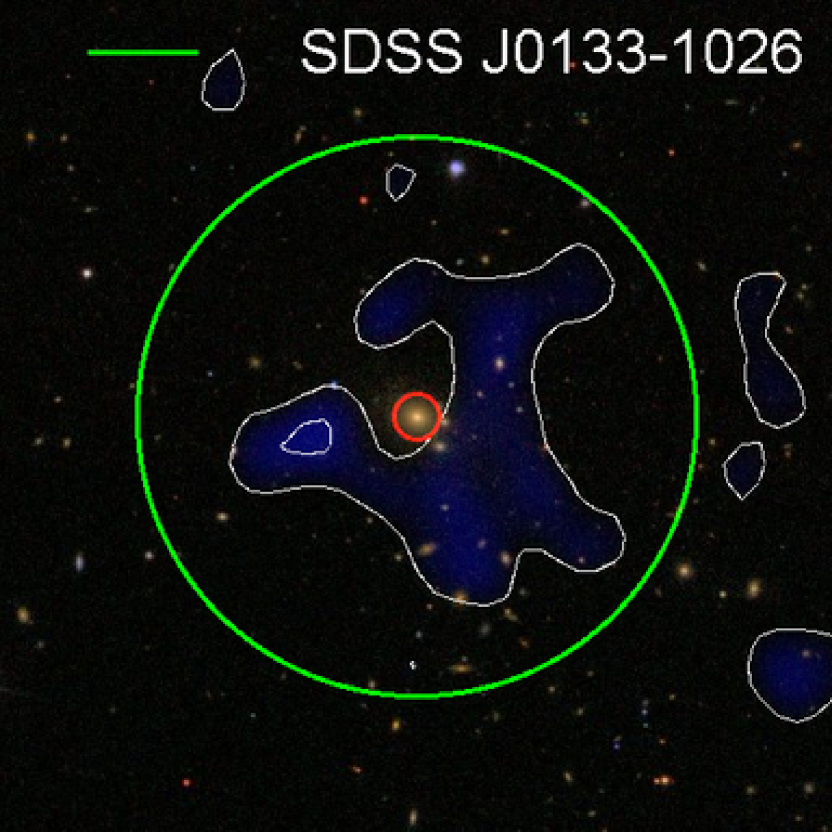
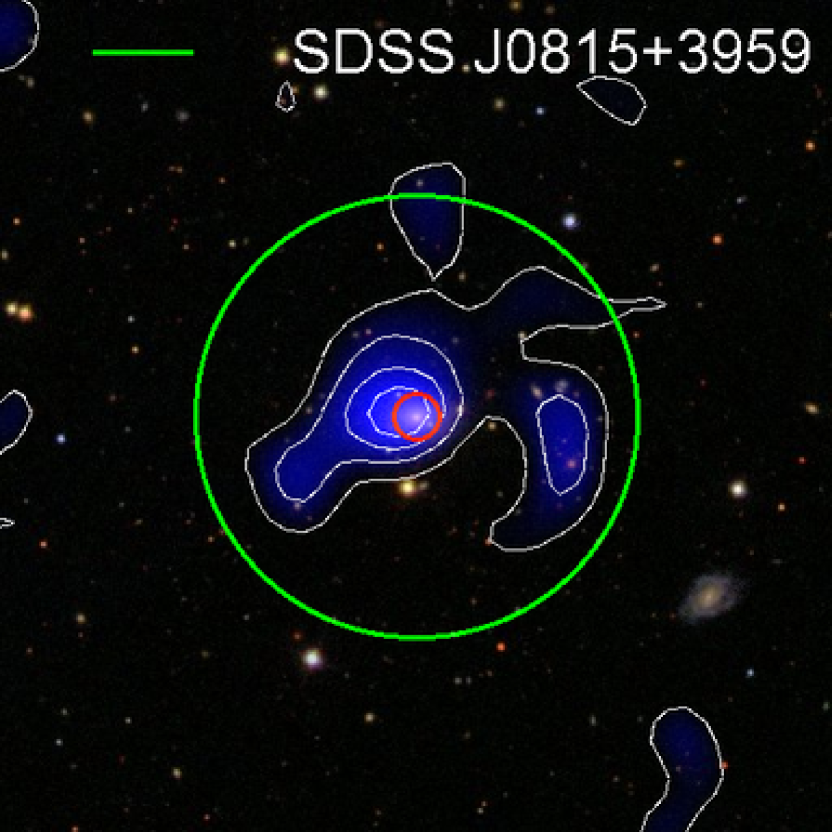
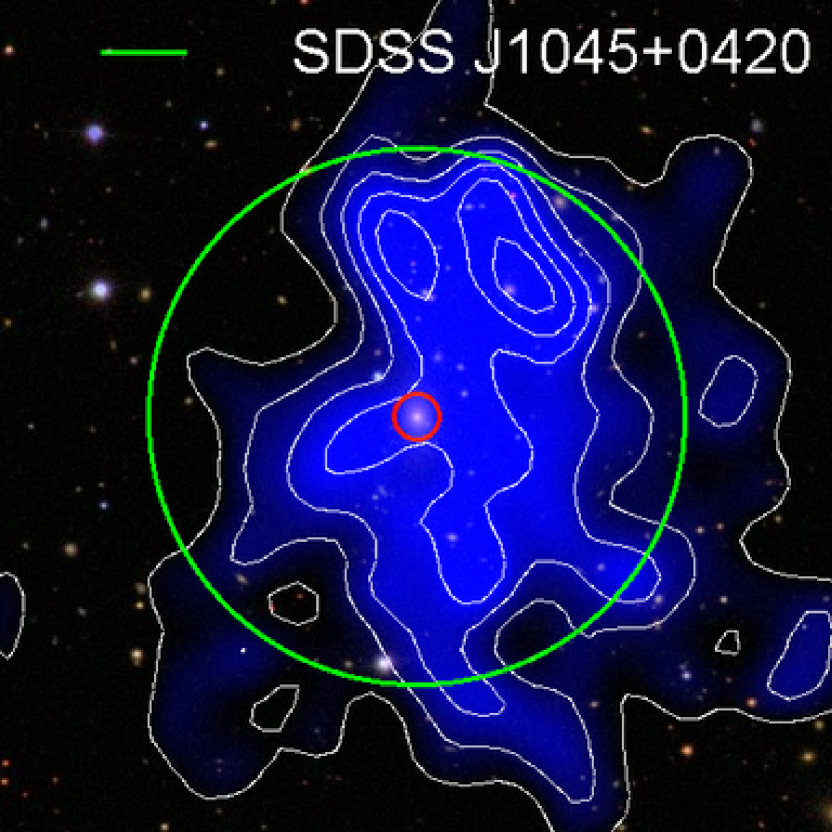
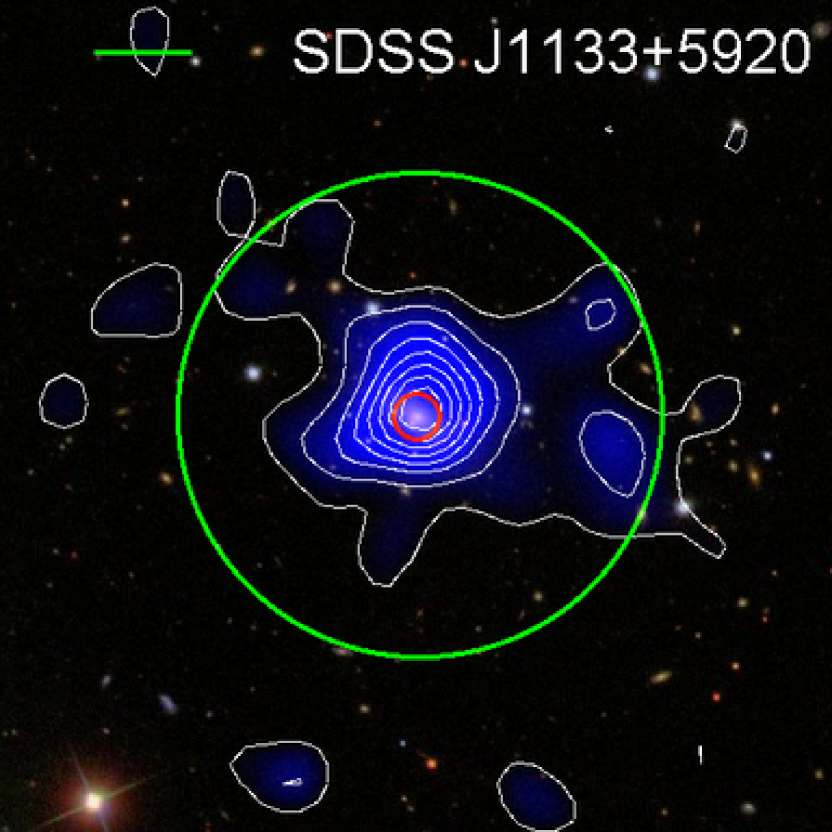
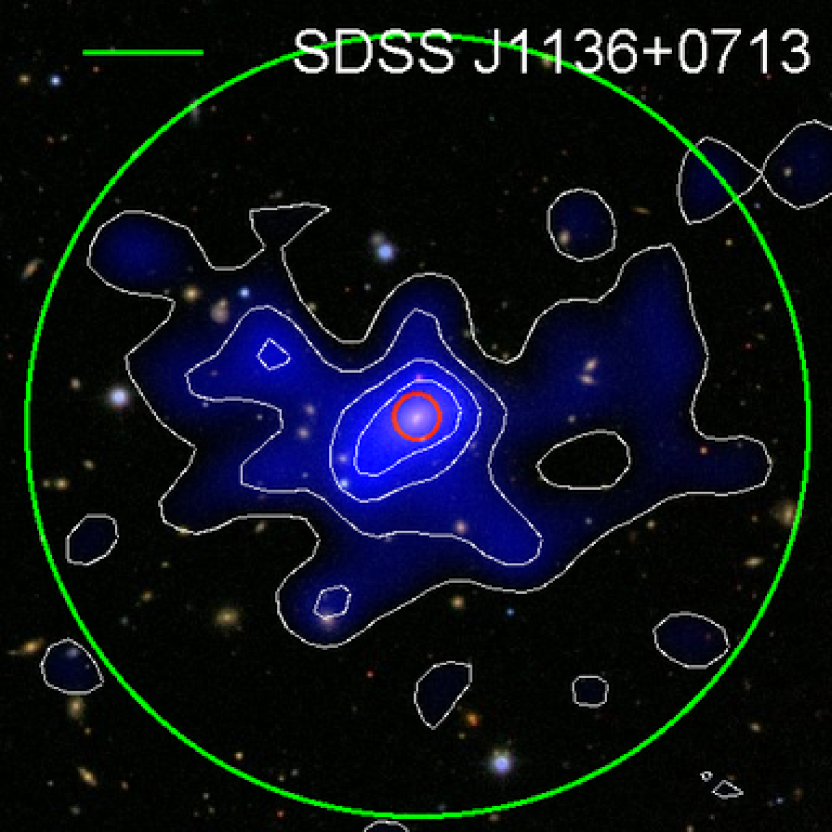
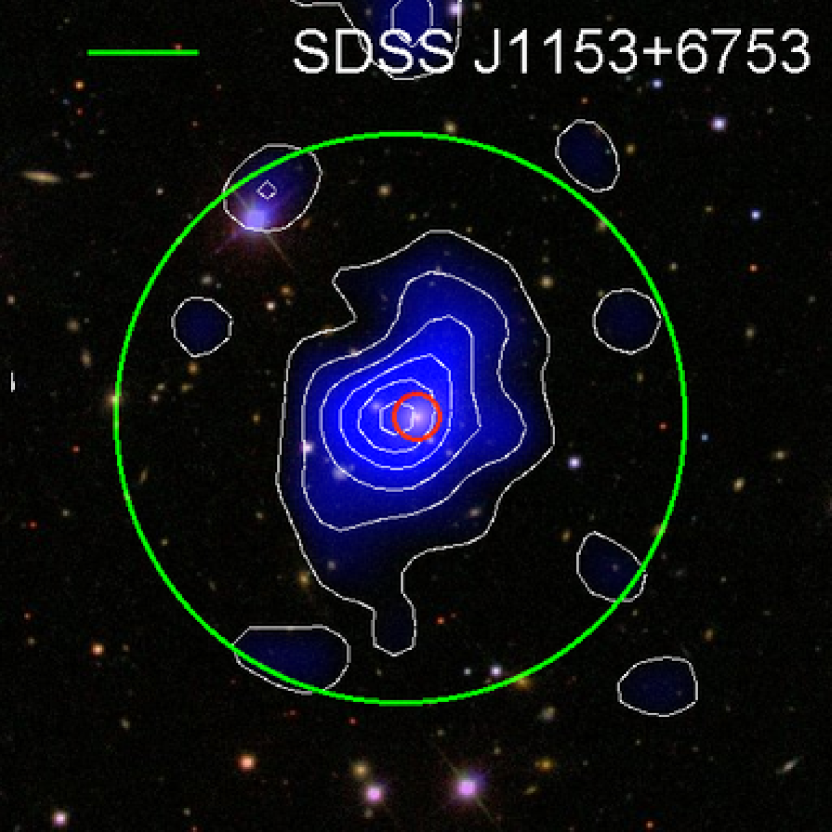
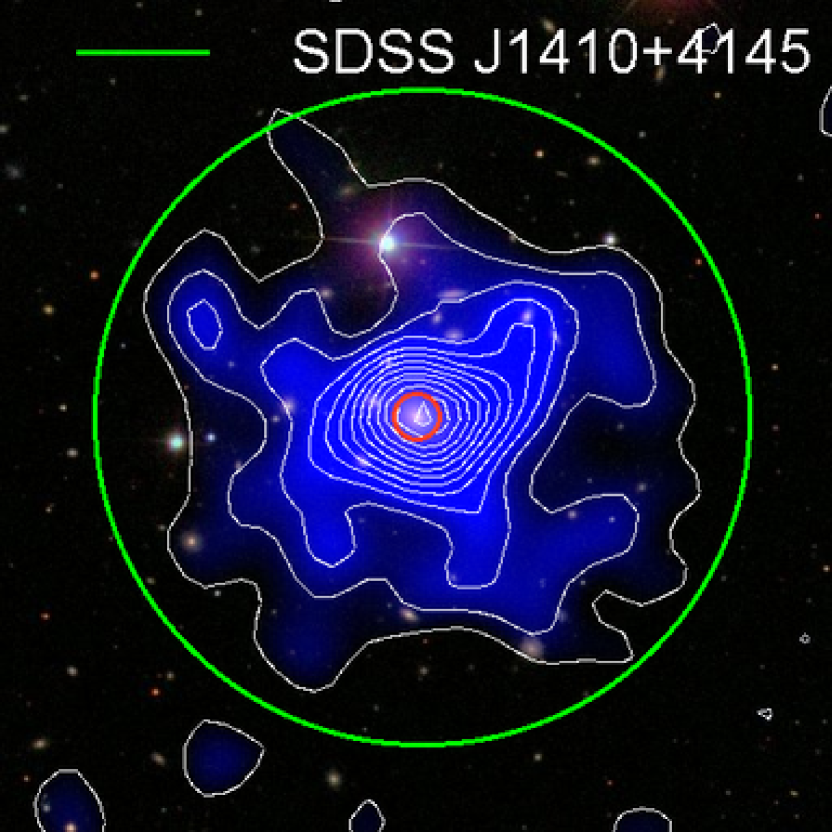
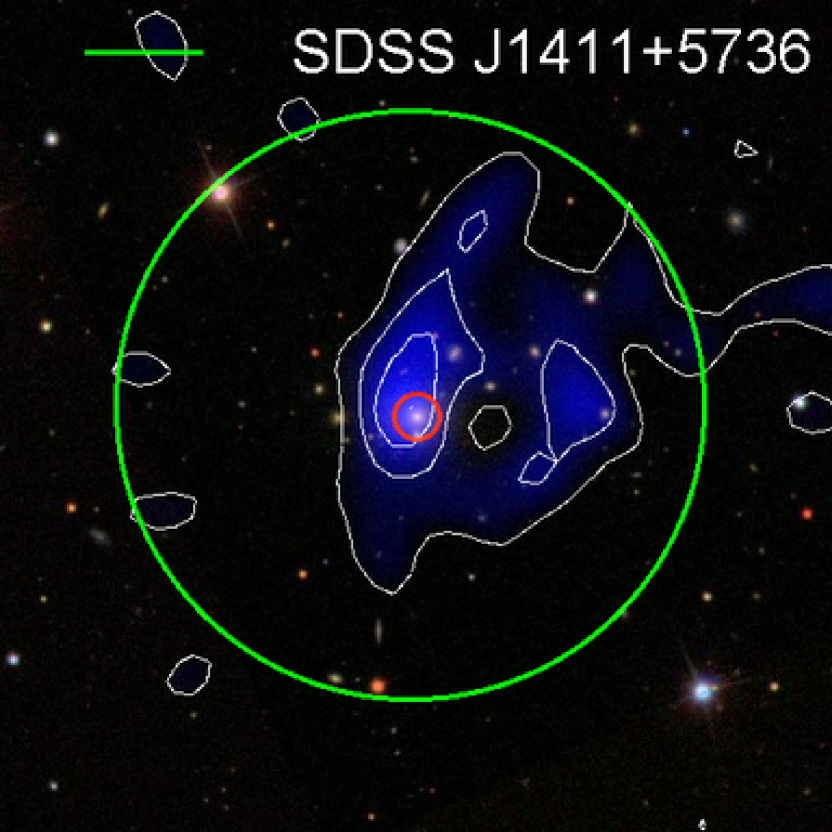
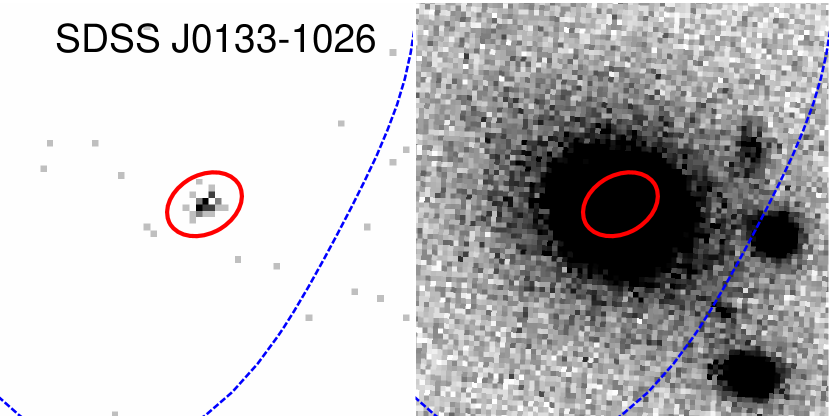
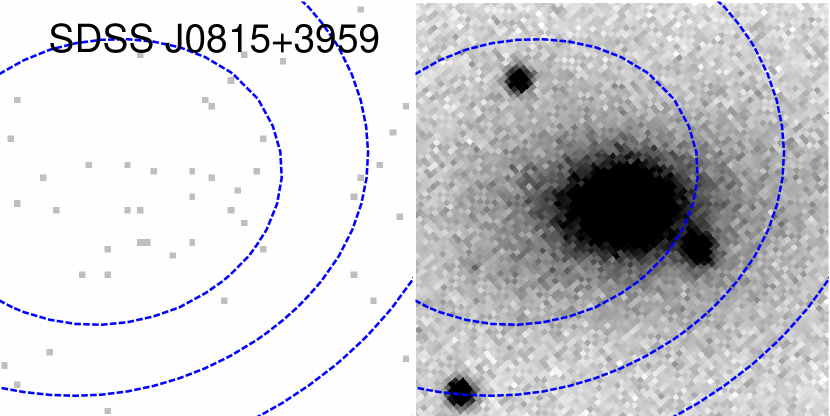
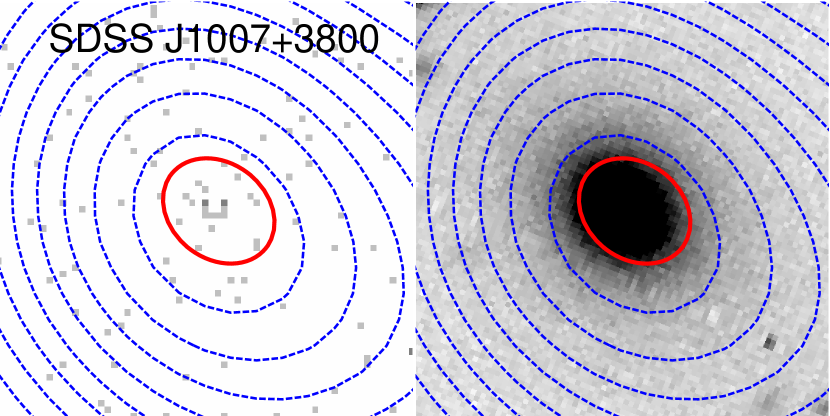
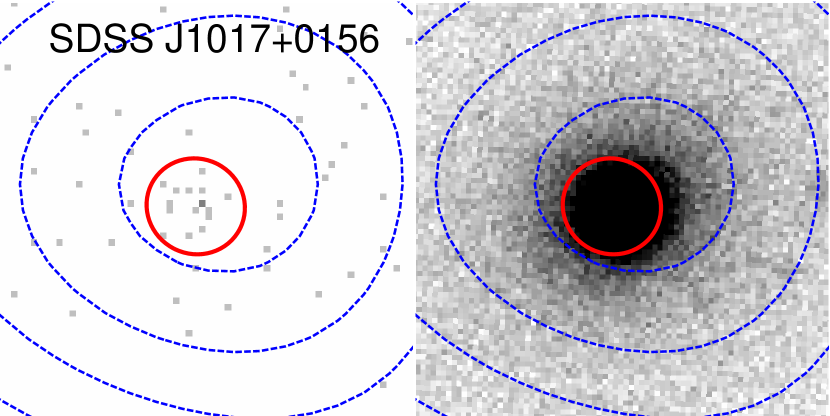
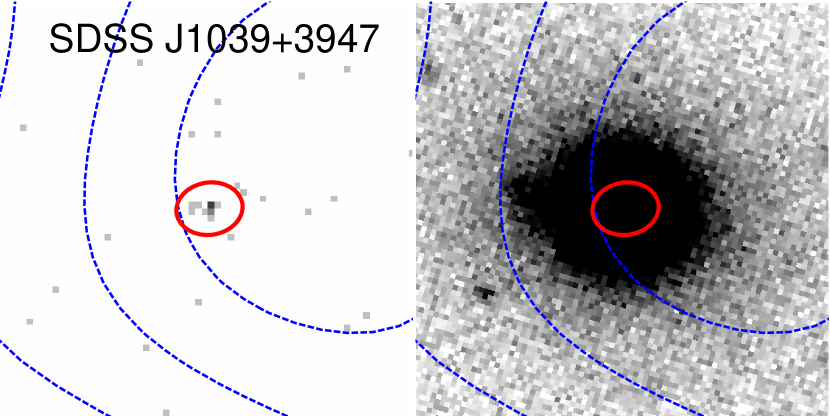
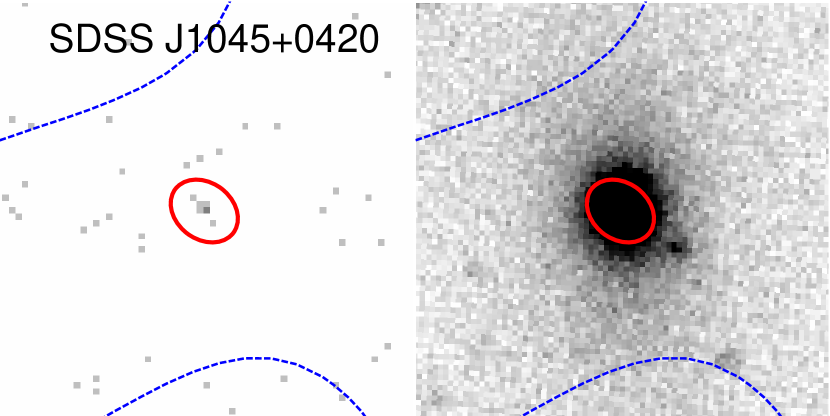
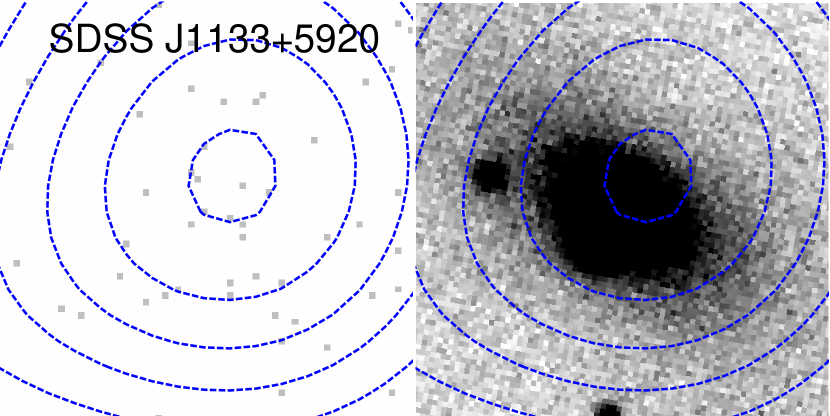
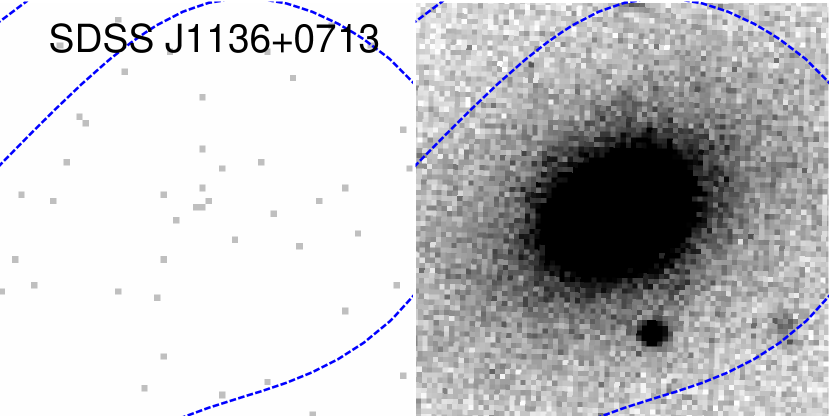
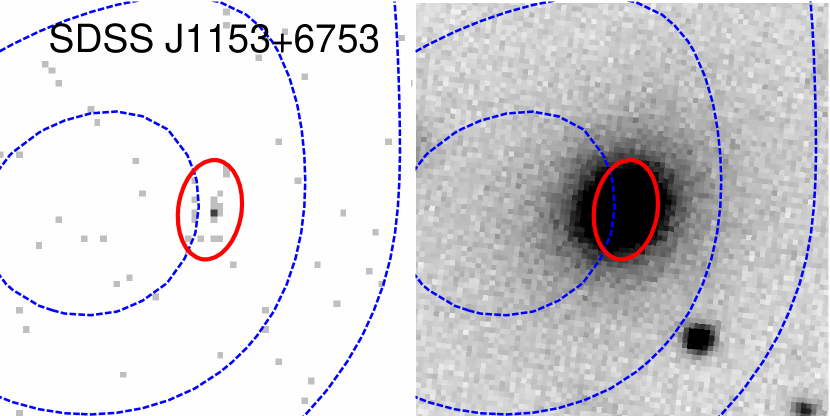
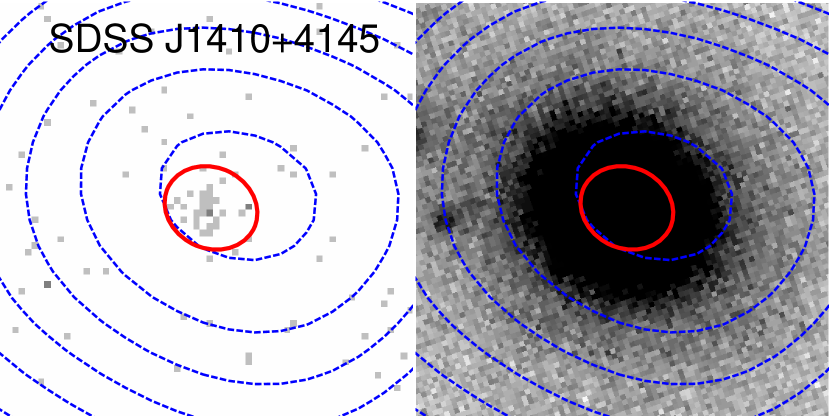
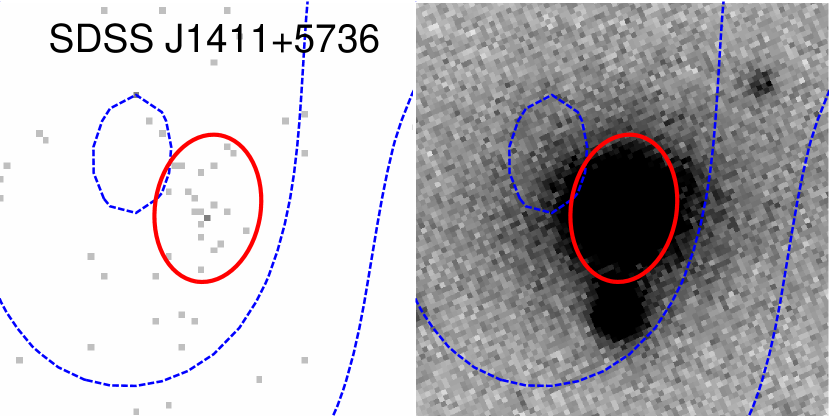
To reduce the possibility of contamination from AGN or diffuse emission in the BCG, we excluded sources found by wavdetect in Section 3.1 that fall within the -band optical extent of the BCG. As the images in Figure 5 show, 8 of the 12 BCGs possess a detected central source with emission in the 0.3–7 keV band, ranging from 7 to 35 counts in the regions outlined by red ellipses. Several of these sources appear to be point-like AGN, but all 12 FGs have some extended component as well, either from the BCG, the core of the IGM, or some combination thereof.
We estimated the contribution of these detected sources to the total X-ray flux by extracting a spectrum for each source and fitting with XSPEC. We assumed a spectral model typical of an AGN, an absorbed power law with fixed power law index , and used the fixed and redshift values from Table 2. The power law normalization was allowed to vary, which provided a confidence interval for the source flux. For one of the targets, the source in J01331026 with 35 counts, we allowed to vary and obtained a good constraint of . The 0.5–2 keV flux estimates (see Table 4) range from a few percent to 30 percent of the flux from the diffuse IGM emission.
One or more of the detected central X-ray sources could be thermal in origin, along the lines of the embedded coronae identified in cluster galaxies by Sun et al. (2007). This is especially true of the more extended emission sources, such as those in SDSS J10073800, SDSS J14104145, and SDSS J1411+5736. While the spectral model used here is inappropriate for thermal BCG X-ray emission, it nevertheless provides a reasonable estimate of the flux in the observed band for planning future deep X-ray observations. Due to the paucity of counts from these sources, a detailed spectral analysis is not possible with the current data. FGs with notable BCG X-ray flux are discussed in more detail in Section 4.3. We emphasize that we have excluded the BCG emission in our spectral (Section 3.2) and spatial (Section 3.3) analysis for the 8 clusters in which we detect it. Therefore the total X-ray flux for an instrument which is unable to resolve and exclude these central sources would be the sum of the values listed in Tables 2 and 4.
4. RESULTS AND DISCUSSION
4.1. Success of the Method: Are They
“Real” Fossil Groups?
The primary goal of this work, to optically identify a sizable sample of fossil groups, has met with great success. Out of a sample of 15 candidates, we have confirmed 12 gravitationally bound systems through their IGM X-ray emission. One additional target, SDSS J0906+0301, is undetected in the short Chandra exposure but is clearly a bound system from follow-up optical spectroscopy, with a velocity dispersion of based on 25 member redshifts (Proctor et al., 2011). This 87% success rate demonstrates the value of the maxBCG survey for selecting FGs; moreover, since these galaxy-poor systems are the most difficult to identify optically, we expect a very high success rate for this method in selecting clusters and groups in general. However, we note two caveats that must be addressed.
First, our original FG criteria were based on a mass-scaling relation from SDSS systems (Johnston et al., 2007). From the current analysis and the results of Proctor et al. (2011), the systems in our sample are very massive for their richness, and in fact they are underluminous in the optical (including the BCG luminosity) by about a factor of three. Simply scaling for the observed richness could dramatically underestimate , which in turn could exclude bright galaxies from our magnitude difference criterion and render our systems non-fossil groups. To address this, we have calculated new values for based on the X-ray results presented here. In addition to the the model approach with which we estimated , we adopt the scaling relation of Helsdon & Ponman (2003),
| (3) |
where for a CDM universe (e.g., Maughan et al., 2006). These values and the model extrapolation values (denoted ) are presented in Table 5, along with the magnitude difference determined for each and its 1 spread of values. The values originally used for the maxBCG optical selection are hereafter denoted .
| FG | aa is defined in Table 1. | bb estimate from Johnston et al. (2007) used in our maxBCG optical selection, as discussed in Section 2. | cc is defined in Table 1. Each column is determined from the preceding it, with values in parentheses from the 1 extrema of . | dd estimate from extrapolating our model fit, with 1 extrema in parentheses. | cc is defined in Table 1. Each column is determined from the preceding it, with values in parentheses from the 1 extrema of . | ee estimate from Helsdon & Ponman (2003) (also see Eq. 3), with 1 extrema in parentheses. | cc is defined in Table 1. Each column is determined from the preceding it, with values in parentheses from the 1 extrema of . | ||
|---|---|---|---|---|---|---|---|---|---|
| (kpc) | (mag) | (kpc) | (mag) | (kpc) | (mag) | ||||
| J08153959 | 12 | 738 | 3.3 | 700 ( | 589,795) | 3.3 (3.3,3.1) | 863 ( | 799,924) | 3.1 (3.1,3.1) |
| J08560553 | 16 | 833 | 2.3 | 928 ( | 817,1103) | 2.3 (2.3,2.3) | 1291 ( | 1156,1553) | 1.7 (2.3,1.7) |
| J10073800 | 24 | 988 | 2.4 | 1128 ( | 981,1291) | 2.2 (2.4,2.2) | 1252 ( | 1123,1403) | 2.2 (2.2,1.6) |
| J10170156 | 12 | 738 | 2.3 | 991 ( | 825,1238) | 1.8 (1.8,1.8) | 1130 ( | 983,1413) | 1.8 (1.8,1.8) |
| J10393947 | 14 | 788 | 2.5 | 809 ( | 669,1016) | 2.5 (2.5,1.4) | 1014 ( | 916,1273) | 1.4 (2.5,1.4) |
| J10450420 | 13 | 764 | 2.1 | 981 ( | 812,1144) | 2.1 (2.1,2.1) | 1195 ( | 1082,1350) | 2.1 (2.1,1.2) |
| J11335920 | 13 | 764 | 2.3 | 784 ( | 655,925) | 2.3 (2.3,2.3) | 964 ( | 882,1108) | 2.3 (2.3,2.3) |
| J11360713 | 17 | 855 | 2.3 | 1016 ( | 827,1284) | 0.5 (2.3,0.5) | 1266 ( | 1123,1608) | 0.5 (0.5,0.5) |
| J11536753 | 17 | 855 | 2.2 | 825 ( | 661,1041) | 2.2 (2.2,2.2) | 1023 ( | 892,1295) | 2.2 (2.2,1.2) |
| J14104145 | 21 | 934 | 2.3 | 784 ( | 720,869) | 2.3 (2.3,2.3) | 997 ( | 937,1084) | 2.3 (2.3,2.3) |
| J14115736 | 16 | 833 | 2.2 | 783 ( | 584,978) | 2.2 (2.2,2.2) | 974 ( | 797,1221) | 2.2 (2.2,1.6) |
The original values are consistent within the errors of the model results for all but two FGs. For J14104145, was an overestimate, so no additional bright galaxies are included using the value. For J10170156, was an underestimate, and one bright galaxy falls within such that mag. This barely fails the magnitude difference criterion of mag; in the -band, the difference is only 1.9 mag (Proctor et al., 2011). Two other FGs (J10393947 and J11360713) are consistent with the criterion at the lower bound of , but inconsistent at its upper bound.
The values are systematically higher than and , however, the confidence intervals overlap for 8 out of the 11 FGs. Only the uncertainty in the X-ray measurement has been propagated to the confidence estimates, therefore any intrinsic scatter in the Eq. 3 scaling relation would increase the uncertainty. With the current confidence intervals, two FGs (J10170156 and J11360713) fail the criterion for all values of . These systems are noted in Figure 6 with blue squares. A total of 8 FGs fail that criterion for the extreme value, but nevertheless agree with the criterion within the uncertainty. Proctor et al. (2011) reach identical conclusions for the subset of 5 of these FGs for which they have -band photometry.
The second caveat concerns our X-ray surface brightness extrapolation. The and core radii we have used are somewhat smaller than what is typically found for clusters (, –200 kpc; Jones & Forman, 1999). Indeed, our extraction radii are not much larger than the typical value, and it is possible the low values result from fitting a fairly flat core of emission. For and our assumed kpc, the luminosity aperture corrections to would be about 50% lower than what is listed in Table 3. For kpc, the aperture corrections are 25% lower, and for kpc, they are 20% higher. These systematic uncertainties are within the statistical errors quoted for the aperture corrections.
In summary, the magnitude difference criterion is satisfied for the majority of our FGs with measured temperature, insofar as our knowledge of is correct, and therefore we conclude that these systems are real fossil groups. Deeper X-ray observations will more precisely constrain the and surface brightness profiles to allow more accurate hydrostatic mass determinations. Regardless of the details of whether these systems strictly meet the empirical FG definition, the results presented by Proctor et al. (2011) clearly demonstrate that a subset of our FGs are different from other systems of similar mass.
As noted in Section 2, the exclusion of candidates with known central radio sources could bias our sample. In particular, galaxy clusters with strong cool cores are very likely to have radio AGN (Sun et al., 2009; Mittal et al., 2009). Thus to first appearances we have selected against strong cool core FGs. In fact, our screening criterion turns out to be insufficient to remove all radio sources, as 4 of the 12 confirmed FGs have radio lobes that are outside of the 3″ radius cut that we imposed (see Section 4.3). Thus while some strong cool core FGs may have escaped our sample, it remains useful for future radio studies, and we expect little bias in given the large measurement uncertainties in the current analysis. A deeper XMM-Newton study will allow removal of the core emission when assembling scaling relations, a technique that greatly reduces scatter and does not produce any apparent bias (Pratt et al., 2009; Vikhlinin et al., 2009a).
Fossil groups typically have relaxed X-ray morphology, and the morphological differences in our sample are at first glance somewhat puzzling. As pointed out in Section 3.3, the modest signal-to-noise of our snapshot data precludes a detailed analysis of the structure of each FG. From a qualitative standpoint, we conclude that much of the appearance of disturbed morphology is due to lack of photons; this is likely the case for J01331026, J08153959, J10393947, and J14115736, and little can be said about the relaxed state of these four FGs. Five of the FGs are qualitatively relaxed, having bright core regions and elliptical isophotes excluding the outer few contour levels (see Figure 4); these are J08560553, J10170156, J11335920, J11536753, and J14104145. Of the three remaining FGs, J10450420 is clearly disturbed, J10073800 has irregular isophotes that are compressed on the east compared to the west, and J11360713 has broad but low-level irregular emission. Therefore, we can qualitatively say that between 10% (1 out of 8) and 40% (3 out of 8) of the FGs are apparently not relaxed.
These estimates for disturbed fraction are a bit lower than what is seen in observations and simulations of normal systems. Böhringer et al. (2010) derive power ratios and centroid shifts for 31 clusters from the Representative XMM-Newton Cluster Structure Survey (REXCESS) and identify two discrete samples in these parameter distributions, with 40% of the clusters identified as disturbed systems. This is in line with previous estimates of the disturbed fraction (e.g., Jones & Forman, 1999). Jeltema et al. (2008) perform simulations of clusters and measure the same structure observables, and find that 30% of the systems would appear disturbed in Chandra-quality X-ray images. Obviously the exact fraction of disturbed and relaxed clusters depends on how these classes are observationally defined and what metrics are used. From a qualitative view, the fraction of relaxed FGs in our sample is similar to what is seen and predicted in normal systems, and in fact could be significantly higher than that, more consistent with the expectation for FGs.
4.2. Fossil Group Scaling Relations
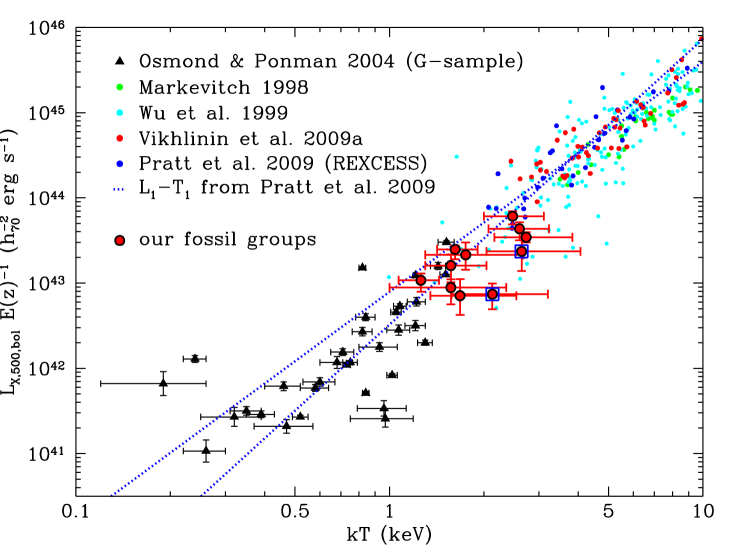
With the scaled luminosities, and with the caveats outlined in Section 4.1 in mind, we are able to place the FGs on a – relation. This is shown in Figure 6 along with a number of low- groups (Osmond & Ponman, 2004) and clusters (Markevitch, 1998; Wu et al., 1999; Vikhlinin et al., 2009a; Pratt et al., 2009), with all values corrected with scaling for self-similar evolution. All values have been scaled to and are measured within or corrected to with the exception of the Wu et al. (1999) clusters, which are measured within 1 Mpc. The FGs fall close to the locus of points traced by low- systems, although they are consistent with rich groups and poor clusters instead of the poor group scales that one would infer from their richness. This is expected from previous observations of FGs (e.g. Khosroshahi et al., 2007) and indeed from the empirical definition of a fossil group. There is a hint from Figure 6 that these FGs are either hotter or less luminous than normal systems, although the errors are large. The slightly larger aperture correction favored by a , kpc surface brightness model would move the FG points closer in to the locus of points from normal systems.
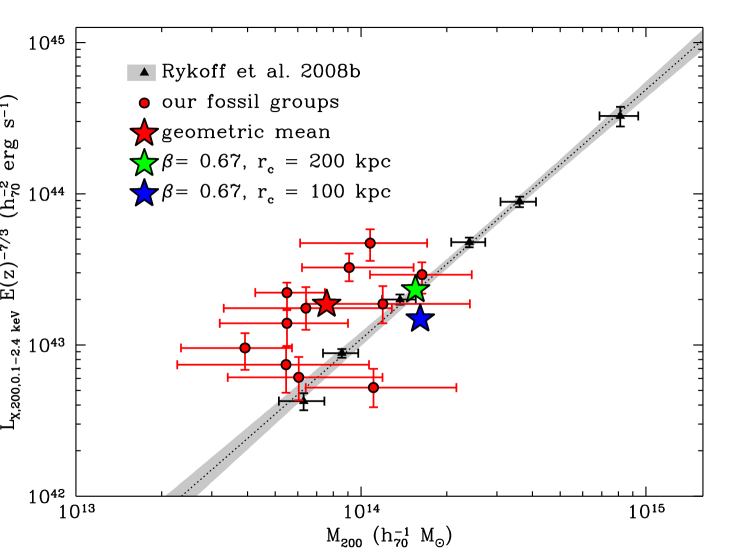
With our modest X-ray data we can explore other scaling relations that constrain different cluster characteristics. The – relation is a useful probe of total baryon fraction, which is dominated by the hot ICM. Using Eq. 1 for , we calculate for our FGs and extrapolate the X-ray luminosity to , using the method described in Section 3.3. The – relation is shown in Figure 7, along with the relation from Rykoff et al. (2008b) for maxBCG clusters. We correct for self-similar evolution at the redshift used in this work, which uses stacked weak lensing measurements to estimate masses. Our FGs fall above the Rykoff et al. (2008b) fit, at higher luminosity for a given mass, which would indicate an enhanced baryon fraction. However, the systematic error due to -model extrapolation (described above) is much larger than this typical offset; as illustrated in Figure 7, this systematic effect is more likely to underestimate the mass. The FGs are therefore consistent with – scaling relation of all maxBCG clusters, to the extent that we can constrain the hydrostatic masses of our FGs.
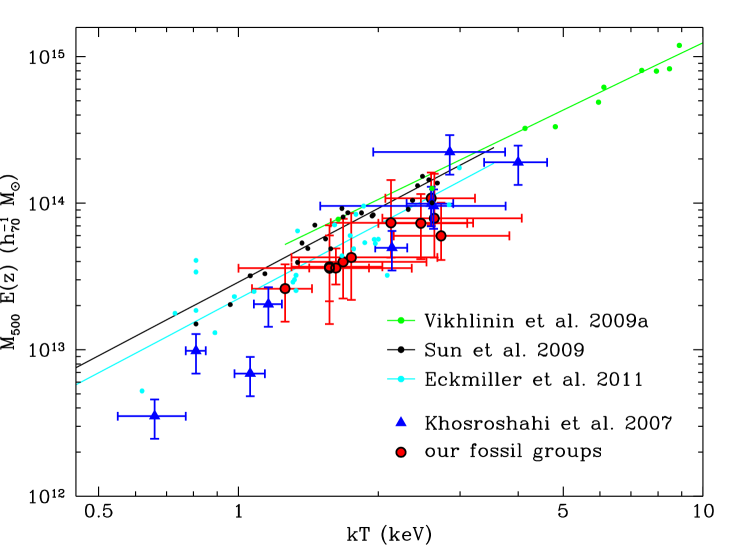
Likewise, we compare the – relation to recent results from the literature (Vikhlinin et al., 2009a; Sun et al., 2009; Eckmiller et al., 2011) that have again been corrected for self-similar evolution (see Figure 8). Khosroshahi et al. (2007) suggest that their sample of FGs and “overluminous elliptical galaxies” (OLEGs), also shown in Figure 8, are hotter for a given mass compared to normal systems, an effect that increases toward lower mass. They tentatively attribute this to a lack of cool cores in the FGs driving the emission-weighted temperature to higher values compared to normal systems. We also find a systematically higher for a given mass in our sample; however, the factor of systematic error in the mass is more than adequate to explain this offset, and as shown in the – relation, it is more likely we have underestimated the masses than overestimated them. We note that Vikhlinin et al. (2009a) and Sun et al. (2009) exclude the core of the X-ray emission within 0.15 in their analyses, so cool cores (or lack thereof) cannot directly cause the temperature differences seen in Figure 8. Our derived – for FGs is stil consistent with that of normal groups within the relatively large statistical and systematic errors.
4.3. Notes on Individual Systems
J01331026—The X-ray IGM of this system is the faintest in our sample, and we are unable to constrain its temperature or mass. In contrast, the BCG contains a bright apparent point source with a flux about one-third that of the thermal group emission. This source is well-fit by a power law with , as described above, and we conclude that it is an AGN in the BCG. This conclusion is supported by two FIRST radio lobes projected 8″ (17 kpc) and 11″ (23 kpc) from the BCG center, with a total flux density of 370 mJy. While very bright, these sources were missed in our filtering discussed in Section 2, which only eliminated FIRST sources within 3″. The optical spectrum lacks emission lines indicative of an AGN (Mauch & Sadler, 2007). The extended X-ray emission does not peak at the BCG but appears as a clumpy ring out to a few hundred kpc. The exclusion of the central point source is unlikely to cause this structure, since the region we excluded is quite small compared to the extent of the diffuse emission. Deeper observations will clarify the morphology and temperature of the IGM.
J08153959, J10393947, J14115736—These three systems share some morphological traits. The diffuse X-ray emission is not centrally concentrated in these shallow observations, and each BCG is separated from the peak of the diffuse X-ray emission by more than the uncertainty in the center of the model fit (typically 6″). J08153959 is devoid of an obvious BCG X-ray source, while J14115736 has an extended BCG source that produces 23% of the flux of the IGM. This latter source might simply be the peak of the IGM, and its exclusion could explain the unusual morphology seen in Figure 4. J10393947 has a point-like BCG X-ray source, as well as a 17 mJy FIRST source projected 3.2″ (6 kpc) away, just missing our radio source filtering. J10393947 fails the mag criterion using the value derived from the temperature, –1273 kpc (see Table 5). It meets this criterion for the smaller value derived from the -model fit; kpc.
J09060301—As mentioned in Section 4.1, this target was not detected in our 10 ksec Chandra observation, yet 25 galaxies around the BCG exhibit a similar redshift with a velocity dispersion of (Proctor et al., 2011). From the scaling relation presented by those authors, we infer – erg s-1; this is mildly inconsistent with our 3 upper limit of erg s-1. Deeper observations of this target will be illuminating, as it could be both optically and X-ray faint for its inferred mass.
J08560553, J10073800, J14104145—Three of the four most X-ray luminous FGs, these systems have well-constrained temperatures and -model surface brightness profiles. The X-ray isophotes are regular for each FG, with the optical BCG projected near the peak of the diffuse X-ray emission, although J10073800 has somewhat compressed isophotes on the east side compared to the west. J08560553 contains no detected BCG X-ray source, while the other two have extended BCG X-ray sources producing a small fraction of the total X-ray flux. J08560553 fails the mag criterion at the upper range of allowed , but is otherwise consistent with the FG definition.
J10170156, J11335920, J11536753—These systems appear relaxed and quite compact, with the detectable diffuse X-ray emission all within a radius of 190 kpc. All three have X-ray centers within 6″ (12 kpc) of the BCG location, which is within the typical uncertainty for the center of the model surface brightness fit. J11536753 clearly has compact emission associated with the BCG; we note that this target falls outside of the FIRST survey field, but there are no other cataloged radio sources consistent with this position. J10170156 has a more extended X-ray source associated with the BCG. J11335920 has no obvious source in the center aside from the extended IGM emission, although there are FIRST radio lobes projected 3″–4″ (7–9 kpc) from the BCG, with a total flux density of 11 mJy. With the updated values shown in Table 5, J10170156 strictly fails the mag criterion, with . Nevertheless, it is clearly an optically underluminous system (Proctor et al., 2011).
J10450420—This is the most X-ray luminous FG in the sample and also the most distant. The morphology of the diffuse emission is strikingly irregular; the peak X-ray surface brightness is projected 1.2′ (190 kpc) northwest of the BCG, and a fairly uniform bright region extends from this point through the BCG to nearly in the south. A simple model centered on the BCG or X-ray centroid is clearly not a representative surface brightness model, therefore the estimated mass and extrapolation of the luminosity to are likely incorrect. There are two bright radio lobes projected 15″ (40 kpc) east and 25″ (67 kpc) west of the BCG, with a total FIRST flux density of 160 mJy. The irregular morphology and bright radio lobes could be evidence of a recent merger or other activity. Deeper X-ray observations will help clarify this puzzling system.
J11360713—This group has a bright red-sequence member 0.5 mag fainter than the BCG and projected about 3.8′ (440 kpc) to the west. Thus the mag criterion is not met at the upper range of allowed , although it is consistent at smaller derived from the -model extrapolation. Deeper X-ray observation will better constrain and determine whether this is a real FG. The diffuse X-ray emission is fairly regular and peaks at the location of the BCG. No separate BCG X-ray source is detected in this target.
5. SUMMARY
Fossil groups present a puzzle to current theories of structure formation. Despite the low number of bright galaxies, their high velocity dispersions (e.g., Proctor et al., 2011) and high gas temperatures seem to indicate cluster-like gravitational potential wells. There have been very few FGs with good quality X-ray data observed until recently, and their idiosyncratic characteristics may contribute to enhance their apparent contradictions. We have embarked on a project to assemble a large sample of optically identified FGs with a view toward dramatically increasing the number of such systems with high quality X-ray data.
The principal observational results in this work are:
(1) New Chandra X-ray detections were made for 12 new FGs, from a sample of 15 optically selected groups from the maxBCG cluster catalog with richness ranging from .
(2) The new X-ray data yielded temperatures for 11 of the FGs, ranging from 1.3 to 2.7 keV. From these temperatures and an analysis of the surface brightness profiles, we have estimated ranging from 440 to 710 kpc and masses ranging from to . These values of masses and scaled radii are typical for groups and clusters in this temperature range.
(3) The – relation for these new FGs does not deviate significantly from the expectation for normal systems intermediate between clusters and groups, although they tend to be more similar to galaxy clusters.
(4) The – and – relations suggest that the FGs are on average hotter and more luminous than normal systems, similar to the results of Khosroshahi et al. (2007). However, the systematic error from luminosity correction and mass extrapolation are large enough to explain these differences.
(5) A small number (10–40%) of the detected groups are morphologically irregular, possibly due to past mergers, interaction of the IGM with a central AGN, or superposition of multiple massive halos. Two-thirds of the X-ray-detected FGs exhibit X-ray emission associated with the central BCG, although we are unable with the current data to distinguish between AGN and extended thermal galaxy emission (e.g., embedded galactic coronae, Sun et al., 2007).
We conclude from these results that the selection criteria devised in Section 2 were successful in finding real fossil groups, and we have greatly increased the number of known fossil groups, a crucial step for further statistical analysis. The results obtained from further detailed studies of this sample will have implications for current and future cluster population studies, and also for cosmology using galaxy clusters. The presence of a population of intermediate mass clusters with small numbers of galaxies may bias determinations of the mass function which measure richness by galaxy counts. This potentially biased mass function, when used to set strong constraints on power spectrum normalization and (e.g., Allen et al., 2011, and references therein), may in turn bias these results. Furthermore, such bias would also affect the measurement of the mass function redshift evolution, which is used to constrain the equation of state of dark energy (Vikhlinin et al., 2009b). In contrast to X-ray surveys, where good proxies are being refined very quickly (e.g., Kravtsov et al., 2006), the largest current and near-future cosmological surveys (e.g., DES444http://www.darkenergysurvey.org, BOSS555http://cosmology.lbl.gov/BOSS, J-PAS; Benítez et al. 2009) estimate the mass of clusters through optical mass proxies, using some type of richness indicator (e.g., Rozo et al., 2009, 2010; Rykoff et al., 2011). This dependence on a possibly biased mass proxy drives the need to determine the mass range of the effect, the relative abundance for this massive but optically poor cluster population, and proper statistical correction methods for cosmology.
With these data in hand, we have begun a systematic study of this sample. The addition of optical radial velocities obtained for hundreds of galaxies in these new fossil groups will allow us to study the scaling relations of fossil groups presented in our companion paper (Proctor et al., 2011). With our planned deep X-ray follow-up with XMM-Newton, we will better constrain the IGM temperature, luminosity, metal abundance, and halo mass, and thoroughly explore the morphology of the hot gas. Finally, with additional proposed Chandra snapshot observations, we will extend our sample to fainter , further testing the validity of our selection method and pushing the scaling relations to lower masses.
References
- Adelman-McCarthy et al. (2006) Adelman-McCarthy, J. K., et al. 2006, ApJS, 162, 38
- Allen et al. (2006) Allen, S. W., Dunn, R. J. H., Fabian, A. C., Taylor, G. B., & Reynolds, C. S. 2006, MNRAS, 372, 21
- Allen et al. (2011) Allen, S. W., Evrard, A. E., & Mantz, A. B. 2011, ARA&A, 49, 409
- Anders & Grevesse (1989) Anders, E., & Grevesse, N. 1989, Geochim. Cosmochim. Acta, 53, 197
- Arnaud & Evrard (1999) Arnaud, M., & Evrard, A. E. 1999, MNRAS, 305, 631
- Balmaverde et al. (2008) Balmaverde, B., Baldi, R. D., & Capetti, A. 2008, A&A, 486, 119
- Becker et al. (2007) Becker, M. R., et al. 2007, ApJ, 669, 905
- Benítez et al. (2009) Benítez, N., et al. 2009, ApJ, 691, 241
- Böhringer et al. (2010) Böhringer, H., et al. 2010, A&A, 514, A32
- Cash (1979) Cash, W. 1979, ApJ, 228, 939
- Cui et al. (2011) Cui, W., Springel, V., Yang, X., De Lucia, G., & Borgani, S. 2011, MNRAS, 416, 2997
- Cypriano et al. (2006) Cypriano, E. S., Mendes de Oliveira, C. L., & Sodré, Jr., L. 2006, AJ, 132, 514
- Dariush et al. (2010) Dariush, A. A., Raychaudhury, S., Ponman, T. J., Khosroshahi, H. G., Benson, A. J., Bower, R. G., & Pearce, F. 2010, MNRAS, 405, 1873
- D’Onghia et al. (2005) D’Onghia, E., Sommer-Larsen, J., Romeo, A. D., Burkert, A., Pedersen, K., Portinari, L., & Rasmussen, J. 2005, ApJ, 630, L109
- Dupke et al. (2010) Dupke, R., Miller, E., de Oliveira, C. M., Sodre, L., Rykoff, E., de Oliveira, R. L., & Proctor, R. 2010, Highlights of Astronomy, 15, 287
- Eckmiller et al. (2011) Eckmiller, H. J., Hudson, D. S., & Reiprich, T. H. 2011, A&A, in press (arXiv:1109.6498)
- Eigenthaler & Zeilinger (2009) Eigenthaler, P., & Zeilinger, W. W. 2009, Astronomische Nachrichten, 330, 978
- Finoguenov & Ponman (1999) Finoguenov, A., & Ponman, T. J. 1999, MNRAS, 305, 325
- Finoguenov et al. (2007) Finoguenov, A., et al. 2007, ApJS, 172, 182
- Hansen et al. (2005) Hansen, S. M., McKay, T. A., Wechsler, R. H., Annis, J., Sheldon, E. S., & Kimball, A. 2005, ApJ, 633, 122
- Helsdon & Ponman (2003) Helsdon, S. F., & Ponman, T. J. 2003, MNRAS, 340, 485
- Hickox et al. (2009) Hickox, R. C., et al. 2009, ApJ, 696, 891
- Jeltema et al. (2008) Jeltema, T. E., Hallman, E. J., Burns, J. O., & Motl, P. M. 2008, ApJ, 681, 167
- Jeltema et al. (2006) Jeltema, T. E., Mulchaey, J. S., Lubin, L. M., Rosati, P., & Böhringer, H. 2006, ApJ, 649, 649
- Jeltema et al. (2009) Jeltema, T. E., et al. 2009, MNRAS, 399, 715
- Johnston et al. (2007) Johnston, D. E., et al. 2007, ApJ, submitted (arXiv:0709.1159)
- Jones & Forman (1999) Jones, C., & Forman, W. 1999, ApJ, 511, 65
- Jones et al. (2000) Jones, L. R., Ponman, T. J., & Forbes, D. A. 2000, MNRAS, 312, 139
- Jones et al. (2003) Jones, L. R., Ponman, T. J., Horton, A., Babul, A., Ebeling, H., & Burke, D. J. 2003, MNRAS, 343, 627
- Kalberla et al. (2005) Kalberla, P. M. W., Burton, W. B., Hartmann, D., Arnal, E. M., Bajaja, E., Morras, R., & Pöppel, W. G. L. 2005, A&A, 440, 775
- Kauffmann et al. (2003) Kauffmann, G., et al. 2003, MNRAS, 346, 1055
- Khosroshahi et al. (2004) Khosroshahi, H. G., Jones, L. R., & Ponman, T. J. 2004, MNRAS, 349, 1240
- Khosroshahi et al. (2006a) Khosroshahi, H. G., Maughan, B. J., Ponman, T. J., & Jones, L. R. 2006a, MNRAS, 369, 1211
- Khosroshahi et al. (2006b) Khosroshahi, H. G., Ponman, T. J., & Jones, L. R. 2006b, MNRAS, 372, L68
- Khosroshahi et al. (2007) —. 2007, MNRAS, 377, 595
- Koester et al. (2007a) Koester, B. P., et al. 2007a, ApJ, 660, 239
- Koester et al. (2007b) —. 2007b, ApJ, 660, 221
- Kravtsov et al. (2006) Kravtsov, A. V., Vikhlinin, A., & Nagai, D. 2006, ApJ, 650, 128
- La Barbera et al. (2009) La Barbera, F., de Carvalho, R. R., de la Rosa, I. G., Sorrentino, G., Gal, R. R., & Kohl-Moreira, J. L. 2009, AJ, 137, 3942
- Markevitch (1998) Markevitch, M. 1998, ApJ, 504, 27
- Mauch & Sadler (2007) Mauch, T., & Sadler, E. M. 2007, MNRAS, 375, 931
- Maughan et al. (2006) Maughan, B. J., Jones, L. R., Ebeling, H., & Scharf, C. 2006, MNRAS, 365, 509
- Mendes de Oliveira et al. (2009) Mendes de Oliveira, C. L., Cypriano, E. S., Dupke, R. A., & Sodré, L. 2009, AJ, 138, 502
- Mendes de Oliveira et al. (2006) Mendes de Oliveira, C. L., Cypriano, E. S., & Sodré, Jr., L. 2006, AJ, 131, 158
- Mittal et al. (2009) Mittal, R., Hudson, D. S., Reiprich, T. H., & Clarke, T. 2009, A&A, 501, 835
- Mulchaey & Zabludoff (1999) Mulchaey, J. S., & Zabludoff, A. I. 1999, ApJ, 514, 133
- Navarro et al. (1997) Navarro, J. F., Frenk, C. S., & White, S. D. M. 1997, ApJ, 490, 493
- Osmond & Ponman (2004) Osmond, J. P. F., & Ponman, T. J. 2004, MNRAS, 350, 1511
- Ponman et al. (1994) Ponman, T. J., Allan, D. J., Jones, L. R., Merrifield, M., McHardy, I. M., Lehto, H. J., & Luppino, G. A. 1994, Nature, 369, 462
- Pratt et al. (2009) Pratt, G. W., Croston, J. H., Arnaud, M., & Böhringer, H. 2009, A&A, 498, 361
- Proctor et al. (2011) Proctor, R. N., Mendes de Oliveira, C. L., Dupke, R. A., Lopes de Oliveira, R., Cypriano, E. S., Miller, E. D., & Rykoff, E. S. 2011, MNRAS, in press (arXiv:1108.1349)
- Rasmussen & Ponman (2007) Rasmussen, J., & Ponman, T. J. 2007, MNRAS, 380, 1554
- Rozo et al. (2007) Rozo, E., et al. 2007, arXiv:astro-ph/0703571
- Rozo et al. (2009) —. 2009, ApJ, 703, 601
- Rozo et al. (2010) —. 2010, ApJ, 708, 645
- Rykoff et al. (2008) Rykoff, E. S., et al. 2008, ApJ, 675, 1106
- Rykoff et al. (2008b) —. 2008b, MNRAS, 387, L28
- Rykoff et al. (2011) —. 2011, ApJ, submitted (arXiv:1104.2089)
- Sheldon et al. (2009) Sheldon, E. S., et al. 2009, ApJ, 703, 2217
- Smith et al. (2010) Smith, G. P., et al. 2010, MNRAS, 409, 169
- Smith et al. (2001) Smith, R. K., Brickhouse, N. S., Liedahl, D. A., & Raymond, J. C. 2001, ApJ, 556, L91
- Sun et al. (2004) Sun, M., Forman, W., Vikhlinin, A., Hornstrup, A., Jones, C., & Murray, S. S. 2004, ApJ, 612, 805
- Sun et al. (2007) Sun, M., Jones, C., Forman, W., Vikhlinin, A., Donahue, M., & Voit, M. 2007, ApJ, 657, 197
- Sun et al. (2009) Sun, M., Voit, G. M., Donahue, M., Jones, C., Forman, W., & Vikhlinin, A. 2009, ApJ, 693, 1142
- Vikhlinin (2004) Vikhlinin, A. 2004, in Chandra Calibration Memo (http://cxc.harvard.edu/contrib/alexey/contmap.pdf: Cambridge: CXC)
- Vikhlinin et al. (2009a) Vikhlinin, A., et al. 2009a, ApJ, 692, 1033
- Vikhlinin et al. (2009b) —. 2009b, ApJ, 692, 1060
- von Benda-Beckmann et al. (2008) von Benda-Beckmann, A. M., D’Onghia, E., Gottlöber, S., Hoeft, M., Khalatyan, A., Klypin, A., & Müller, V. 2008, MNRAS, 386, 2345
- Wechsler et al. (2002) Wechsler, R. H., Bullock, J. S., Primack, J. R., Kravtsov, A. V., & Dekel, A. 2002, ApJ, 568, 52
- White et al. (1997) White, R. L., Becker, R. H., Helfand, D. J., & Gregg, M. D. 1997, ApJ, 475, 479
- Willis et al. (2005) Willis, J. P., et al. 2005, MNRAS, 363, 675
- Wu et al. (1999) Wu, X., Xue, Y., & Fang, L. 1999, ApJ, 524, 22
- York et al. (2000) York, D. G., et al. 2000, AJ, 120, 1579