A Lyman alpha halo around a quasar at redshift
Abstract
We present long-slit spectroscopic data which reveals extended Ly emission around the radio-quiet quasar CFHQS J2329-0301. The Ly emission is extended over 15 kpc and has a luminosity of W, comparable to the most luminous Ly halos known. The emission has complex kinematics, in part due to foreground absorption which only partly covers the extended nebula. The velocity ranges from km s-1 to km s-1, with a peak remarkably close to the systemic velocity identified by broad Mg ii emission of the quasar. There is no evidence for infall or outflow of the halo gas. We speculate that the Ly emission mechanism is recombination after quasar photo-ionization of gas sitting within a high-mass dark matter halo. The immense Ly luminosity indicates a higher covering factor of cold gas compared to typical radio-quiet quasars at lower redshift.
Subject headings:
cosmology: observations — quasars: general — quasars: emission lines1. Introduction
There are still many mysteries surrounding the cosmological evolution of the most massive galaxies. Did these galaxies undergo a monolithic collapse with extremely high star formation efficiency at an early epoch? Did they all build up supermassive black holes rapidly at their centers? What processes are responsible for the subsequent halt in star formation, so that today they appear red and dead?
At high redshift, massive galaxies are extremely rare and are not found by small area surveys such as with the Hubble Space Telescope. One of the best ways to locate massive galaxies at is by finding luminous quasars, since these quasars contain supermassive black holes with masses accreting at the Eddington limit (Jiang et al. 2007; Kurk et al. 2007; Kurk et al. 2009; Willott et al. 2010). The space density of black holes at this epoch is a factor of times lower than today (Willott et al. 2010). They are located in rare high matter density peaks where galaxy formation got underway rapidly (Volonteri & Rees 2006).
Cosmological simulations show that massive galaxies located within hot gas halos can accrete a substantial amount of cold gas, so long as the cold gas is fed into the galaxy in narrow filaments (Dekel et al. 2009). These cold streams may be the dominant mode of star formation at high redshift. This is difficult to prove observationally by Ly absorption, due to the small covering factor of the cold streams (Faucher-Giguère & Keres 2011).
Cold gas accretion can also have effects on the Ly emission around galaxies. As cold, neutral gas falls toward the central galaxy it can be heated and ionized by shocks and recombines emitting Ly photons (Haiman et al. 2000). Cold gas within galaxies could also be ionized by an intense starburst or an active galactic nucleus (AGN) at the galaxy center (Haiman & Rees 2001). Ly “blobs” or halos have been discovered around active and inactive galaxies (e.g. Heckman et al. 1991; Fynbo et al. 1999; Steidel et al. 2000; Matsuda et al. 2004; Weidinger et al. 2004; Christensen et al. 2006; Hennawi et al. 2009). All of the above mechanisms have been proposed to explain the Ly emission from these objects and it is likely that a range of mechanisms are at work.
CFHQS J232908-030158 (hereafter CFHQS J2329-0301) is a quasar at discovered in the Canada-France High-z Quasar Survey (CFHQS; Willott et al. 2007). It is radio-quiet (Wang et al. 2008) and powered by a black hole with mass (Willott et al. 2010). There is some evidence for a protocluster of companion star-forming galaxies based on deep multi-color imaging (Utsumi et al. 2010). However, most of these objects are visible in the band thumbnail images and therefore likely lie at redshift lower than . Goto et al. (2009; hereafter G09) presented deep broad-band imaging observations of this quasar and showed that it is spatially extended at band and possibly also at band. The high level of extended emission at band suggests that there is a large flux due to extended Ly emission. Willott et al. (2007) found that the broad Ly line in this quasar has twice the equivalent width of typical quasars.
We present a deep long-slit spectroscopic observation of CFHQS J2329-0301 with the aim of determining how much of the extended flux of G09 is due to Ly emission and its spatial and kinematic distributions. In Section 2 we analyze the imaging data of G09. In Section 3 we describe the spectroscopic observations and their analysis. Section 4 discusses the physical nature of this galaxy. All optical and near-IR magnitudes in this paper are on the AB system. Cosmological parameters of , and (Komatsu et al. 2009) are assumed throughout. One arcsecond on the sky corresponds to a physical size of 5.6 kpc at .
2. Extended emission in broad-band images
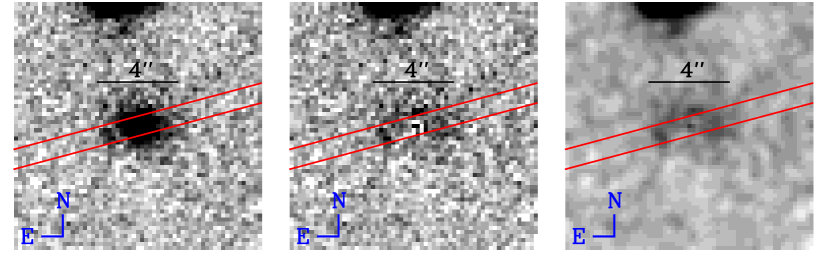
G09 presented Subaru Suprime-Cam images of CFHQS J2329-0301 in three broad-band filters: , and . The data were obtained in excellent conditions with seeing of 0.5”. The quasar is very faint in the band () due to IGM absorption shortward of the Ly emission line. Therefore no extended emission in this filter is observed. However, the data are useful to check that none of the extended emission found at longer wavelengths is due to a contaminating object such as a low redshift galaxy. At band the object is clearly more resolved than stars in the field. G09 carried out point-spread function (PSF) subtraction revealing an elongated (roughly E-W) object extended over 4 arcsec with magnitude in a 2.6” radius aperture. Due to the lower sensitivity of Suprime-Cam at band, G09 found only a tentative detection of extended flux in this filter (which probes longward of the Ly emission line) with magnitude . The band contains the Ly line and the brightness of the extended emission in this filter suggests that at least some fraction of the extended emission is from Ly .
In order to compare these imaging observations with our spectroscopy to be presented in the following section, we have obtained the processed Suprime-Cam band image from the authors of G09. We performed an independent PSF subtraction using field stars of similar magnitude to the quasar. Six stars were used to construct a model PSF which has FWHM 2.4 pixels or 0.48”. The PSF was scaled to match the total magnitude of the quasar in a circular aperture of radius 2”. This PSF was then subtracted from the quasar image. By trial and error it was found that the model PSF should be scaled by a factor of 0.87 such that the integrated flux within the central few pixels was just above zero. Note that this method (maximal PSF-subtraction) therefore gives a lower limit on the extended flux. We determined an upper limit to the PSF scaling by considering when the integrated flux within the central few pixels was more negative than the noise across clean parts of the image. It was found that the PSF scaling had to be at the 4 level.
The PSF-subtracted residual image (center panel of Figure 1) shows a similar structure to that in G09. The ring-like nature of the residuals could be real or could be an artifact of the maximal PSF-subtraction. We measure a magnitude of within a 2” radius aperture, consistent with the magnitude measured by G09. Note the uncertainty on the magnitude quoted above is only due to the measured pixel-to-pixel noise in the sky aperture. It does not include the uncertainty due to PSF scaling or the effect of correlated pixels. The 4 limit based on the PSF scaling discussed previously corresponds to an extended component magnitude limit of .
Inspection of the image suggests substantial correlation between nearby pixels due to a spatially variable background. To ascertain the significance of the extended emission in the band image, we placed 2” radius apertures at random across the image (after masking of real sources) and measured the distribution of fluxes in these apertures. A flux equivalent to magnitude fainter than is found in 68% of the random apertures and magnitude fainter than is found 95% of the time. Assuming a Gaussian distribution, we extrapolate this to infer that the extended emission has a significance of . G09 stated that the extended emission has significance . However, their random aperture results are similar to ours; they found a 1 sky noise of , which would make the detection significant at only . In conclusion, the extended emission at band is significant at at least the level (recalling that we subtracted off a maximal PSF). With a magnitude of the extended emission comprises at least 13% of the total flux from this object in this filter passband.
3. Long-slit spectroscopic observations of the extended emission
3.1. Observations
The quasar CFHQS J2329-0301 was observed with the Echelle Spectrograph and Imager (ESI) spectrograph (Sheinis et al. 2002) at the Keck-II telescope during the nights of 4+5 October 2007 and 24 September 2008. The atmospheric conditions were variable and only the data taken in reasonable conditions were included. The total integration time was 8.5 hours, split into 30 minute exposures with the quasar position offset along the slit between each exposure. The 1” wide slit was positioned at an angle of 105∘ East of North, as indicated on Figure 1. Note that the spectroscopic observations were performed before publication of G09, so the good alignment of the slit with the elongation angle of the extended emission is coincidental. Ly falls in order 7 of the echelle, where the spatial pixel scale is 0.163” pixel-1 and the spectral scale is 11.5 km s-1 pixel-1. The spectral resolution with the 1” slit is 75 km s-1 or .
Data reduction was performed using the ESIRedux code.111http://www2.keck.hawaii.edu/inst/esi/ESIRedux/index.html After bias removal, a pinhole mask observation was used to determine the spectral traces of the orders on the detector. The data were then flat-fielded, sky-subtracted and the wavelength solution determined using arcs. A standard star observation was used to determine the target traces. There is significant fringing at the red end of the spectra, so a master fringe frame was produced by median-combining all data of faint objects obtained over the two runs with the locations of known targets masked out. Appropriately scaled fringe frames were subtracted from each spectrum of the quasar. The individual frames were then shifted and combined with weighting dependent upon their signal-to-noise ratios (S/N). Each order was extracted from the 2D image and rectified using the target trace. The seeing, as measured from the quasar continuum is 0.93”, which is significantly poorer than in the imaging observations of G09. Flux calibration is achieved with standard star spectra and the published broad-band magnitude of the quasar (Willott et al. 2007).
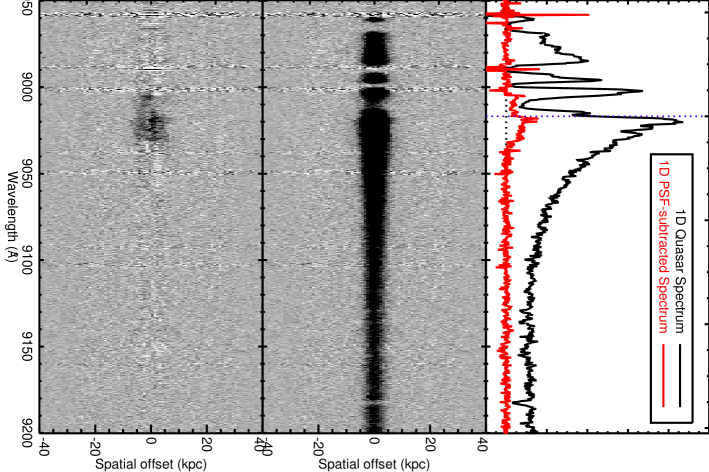
3.2. Spectral PSF subtraction
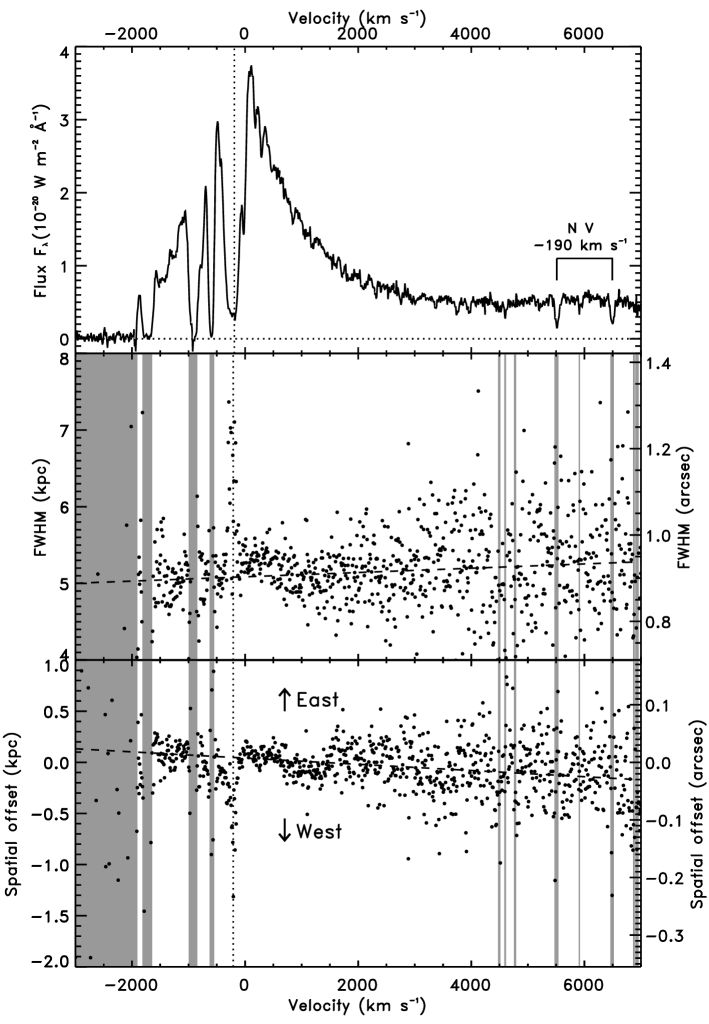
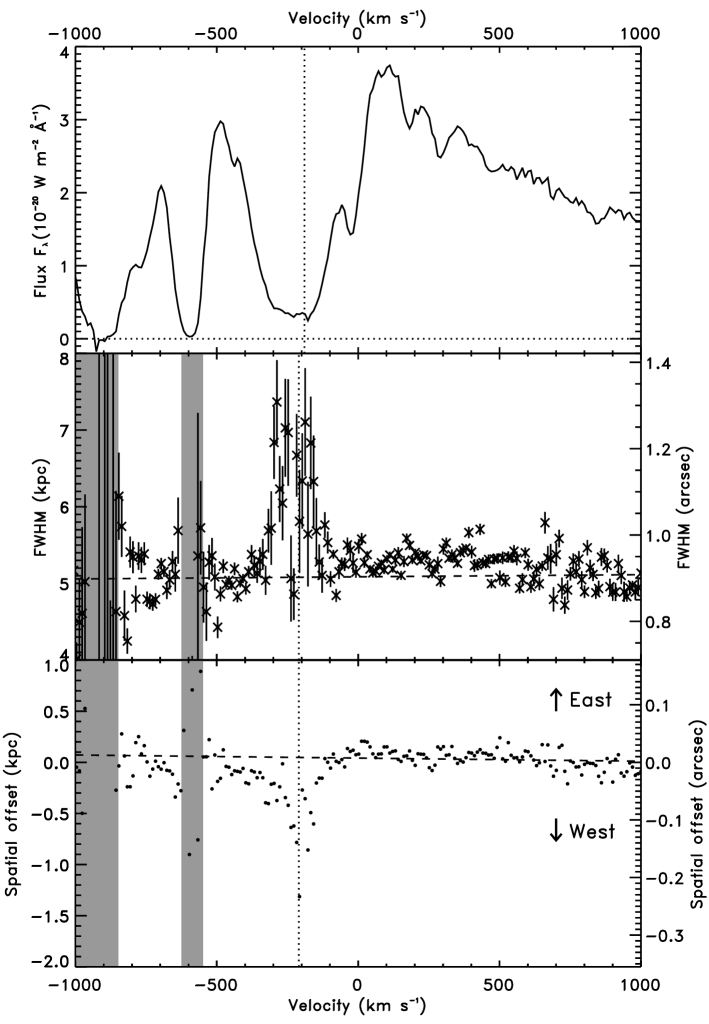
Due to the relatively short slit of ESI (20”) and the need to dither the target along the slit, it was not possible to simultaneously observe a star on the slit to determine the PSF. Therefore the true PSF for these observations is uncertain. Inspection of the spectrum showed that there is extended flux at the wavelength of the Ly line. Figures 2 and 3 show the extracted one-dimensional spectrum and how the spatial FWHM and peak location along the slit vary as a function of Ly velocity. Zero velocity is set at , based on the broad Mg ii emission line redshift from Willott et al. (2010). The Mg ii line is a good estimator of the systemic velocities of quasars (Richards et al. 2002).
There are several deep Ly absorption lines on the blue wing of the broad Ly line. The broadest, deepest H i absorption dip centred at km s-1 () is a multi-component H i system. Fitting the Ly profile yields a minimum of three (more likely four) components, of which one has associated N v absorption. The total neutral hydrogen column density is (H i) cm-2. The associated N v doublet at , marked on Figure 2, is unresolved and highly saturated (both lines of the doublet have rest equivalent widths Å). There is also possible associated Si ii absorption at but it falls in a region of strong sky absorption lines.
A Gaussian flux distribution was fitted to each column of the spectrum to determine the spatial FWHM and peak location (centroid). It was found that both these quantities were slowly varying functions of wavelength. Linear fits to both quantities were determined using a minimisation using only wavelength regions with high quality data and avoiding the obviously more spatially extended parts of the spectrum. The fitted regions were to km s-1 and to km s-1.
Figures 2 and 3 reveal two interesting things. Firstly, at the location of the H i absorption at km s-1, the Ly flux is significantly more extended than elsewhere with a FWHM of 1.2 arcsec. Secondly, its centroid is significantly offset along the slit by 0.1” to 0.2” ( pixel) towards the west. Note that this offset is relatively small compared to the total extent of extended emission found in the image of G09. Our interpretation of this is that the absorption system at km s-1 covers the quasar nuclear emission more completely than it covers the extended Ly emission. We will return to this point in Section 3.3.
The middle panel of Figure 3 shows that the Ly emission at velocity to km s-1 has only a marginally greater FWHM than the continuum fit level marked by a dashed line. This does not preclude a significant extended component at this velocity due to the fact that a minor extended component does not alter the FWHM greatly. For example in the imaging of G09, the band quasar FWHM is equal to the model PSF despite the fact that 13% of the flux is in the extended component.
In order to determine the PSF we use the Gaussian fit results described above, which are dominated by data outside of the Ly emission line wavelength range. This makes the very large assumption that the only extended flux in the spectrum is in the Ly emission line and not in wavelengths corresponding to quasar continuum. We will return to analyze this assumption in Section 3.3. Our method is very similar to the spectral PSF (SPSF) method of Moller (2000; see also Moller et al. 2000). The linear fits to the Gaussian centroids and FWHM show that these quantities are very slowly varying functions of wavelength and therefore the values expected at each wavelength are well-determined from the linear fits.
As a first test of PSF-subtraction we subtracted Gaussians with the width and centroid determined from the linear fit described above. The normalization of the Gaussians were set by the observed peak values. This test showed that there were substantial positive and negative residuals in the form of wiggles with peaks up to % of the Gaussian peak value. We checked standard star spectra from the same run and found these wiggles to be present in Gaussians subtracted off stellar spatial profiles and therefore these wiggles form part of the instrumental PSF. The wiggles had subtly different form for the standard stars compared to the quasar data (which was collected over several different nights) and therefore the stellar spectra could not be used to define the instrumental PSF. Instead we used the quasar spectrum at wavelengths equivalent to Ly velocities of to km s-1. At this wavelength the quasar is not obviously extended, yet there is sufficient flux to determine a high S/N PSF correction to the Gaussian profile. Note that this procedure means that any true extended flux at this velocity range would be subtracted off across the full spectrum. We note that our two-step spectral PSF method is different to the “look-up table” approach of Moller (2000). However, the results for the two methods will be comparable because both correctly account for the wavelength-dependent PSF centroid, the wavelength-dependent PSF width and shape and the pixelization of the data. Evidence for this will be seen in the cleanliness of the PSF-subtracted quasar continuum (similar to the very clean PSF-subtracted continuum in Weidinger et al. 2004 using the look-up table method).
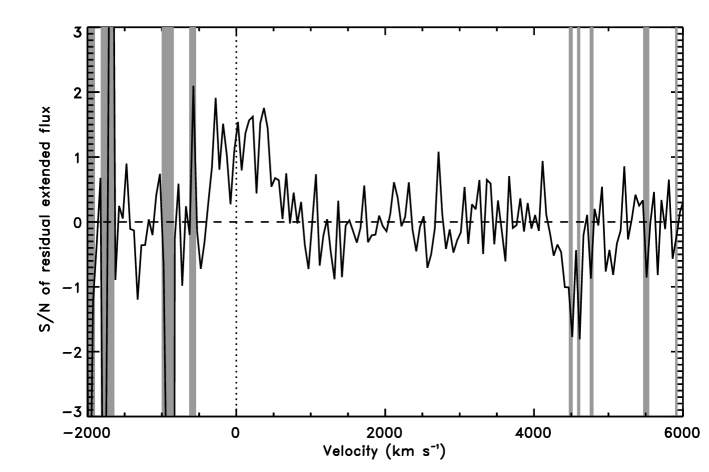
The final problem is one inherent to PSF-subtraction, how to scale the PSF in order to just remove the unresolved component without over-subtracting the extended emission. By simply scaling the PSF peak to the observed peak, the center of the recovered extended emission inevitably has zero flux. The first step in this process is to determine at what wavelengths we have unequivocal evidence for extended emission. This was achieved by performing spectral PSF-subtraction with the PSF peak set equal to the observed peak such that there is zero flux in the extended component at the center. The residual flux from this process was then integrated along each column to determine the total extended flux per wavelength pixel. This total residual flux was then divided by the total noise in each column of the spectrum, taking into account sky and object contributions to the noise. This resulted in the S/N of extended emission as a function of wavelength and is plotted in Figure 4. The only velocity region which shows positive extended flux residual over a sizeable velocity range is between and km s-1. Even though the S/N of each column is only between 1 and 2, the integrated S/N across this velocity range is 10 and highly significant.
Recall that the velocity region to km s-1 was used to determine the non-Gaussian component of the PSF, so any extended flux at that velocity would be subtracted off as part of the PSF. Whilst we cannot conclude that there is no extended emission at km s-1 (see also Section 3.3), we can say that there is a greater amount of extended emission located close to the quasar Ly center than at longer wavelengths.
Therefore the PSF is scaled to the observed peak outside of the velocity region and km s-1. Within this region the PSF scaling is determined using the observed peak, but with a correction if necessary to prevent the total flux of the extended component within the central 2 or 3 spatial pixels being negative. Note that this is still a maximal subtraction and it is possible that the extended component contains a greater fraction of the total flux.
3.3. Results
The results of the spectral PSF-subtraction process are shown in Figure 5. The upper panel compares the quasar spectrum with the spectrum of the extended component. The middle panel shows the original 2D spectral image and the lower panel the 2D spectral image extended residuals after PSF-subtraction. There are very few positive or negative residuals at velocities or km s-1 which shows how well our spectral PSF-modeling works. The extended emission appears clumpy both spatially and kinematically. This structure will be investigated further below.
One of the surprising things about the residual extended emission is that its flux is so low. Recall that in Section 2 we showed that the extended emission identified in Subaru imaging contributes 13% of the total band flux, assuming a maximal PSF-subtraction. To compare to the extended flux in the spectrum we need to consider differential slit losses for the PSF and extended emission and the wavelength range over which to integrate. Differential slit losses for the ESI seeing based on the Subaru imaging show that we expect 10% of the total observed spectroscopic band flux to come from extended emission.
Direct measurement of the flux between 9000 and 9040 Å in the upper panel of Figure 5 shows that the extended emission contributes 10% of the total flux over this narrow wavelength range containing the extended Ly emission. Over a wider wavelength range of 9000 to 9100 Å, the extended component is only 5% of the total flux. Based on the Suprime-Cam band response curve, 39% of the flux from the quasar in this filter comes from 9000 to 9100 Å. Therefore, only 2% of the band flux in the ESI slit comes from the extended component, compared to the expected 10%. The majority of the extended emission observed in Subaru imaging is unaccounted for in our spectroscopy.
Possible reasons for this missing extended flux are that the broad-line region/continuum flux (which we used to determine the PSF) is also spatially resolved or that we have substantially overestimated the PSF scaling for the narrow part of the Ly line. G09 proposed that 40% of the extended band emission was continuum flux from an extreme starburst () in the host galaxy, based on their tentative detection of extended emission at band. We have no evidence for extended continuum based on Figure 4. Also the PSF-fit appears to do an equally good job at accounting for all the observed ESI flux at velocities corresponding to the broad Ly emission (velocities to km s-1 and to km s-1) as it does at longer wavelengths where the quasar continuum dominates. Even the extreme starburst advocated by G09 would be a minor component in the broad Ly wavelength region, so this argues against significant extended continuum. It is more likely that we have overestimated the PSF scaling for the Ly line, since we have no independent constraint on this normalization. In this case up to half of the narrow Ly emission could be in the extended component. The fact that our seeing is substantially worse than that of the imaging observations is another complicating factor.
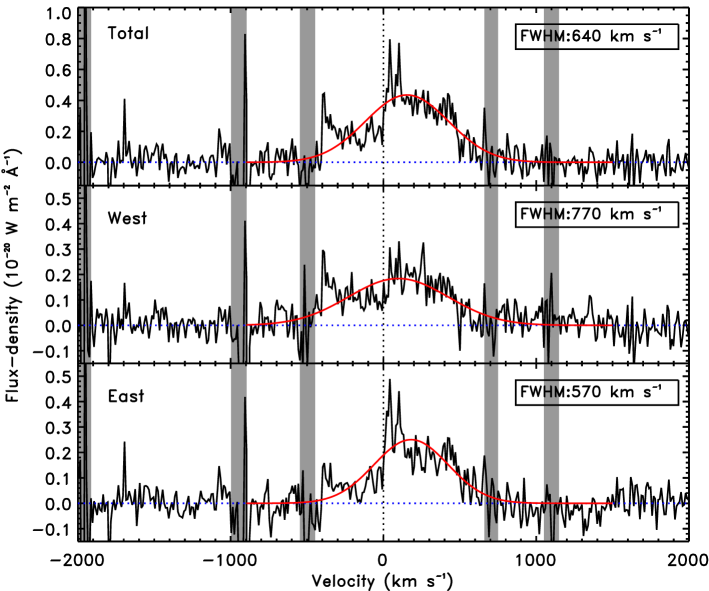
Even though our observations leave some puzzle about the bulk of the extended emission, it is interesting to consider the spatial structure and kinematics of the resolved Ly emission. Figure 6 shows the velocity profile for the whole Ly halo and for the two spatially distinct components on the west and east sides. The overall velocity structure for the two sides is quite similar. The complex structure means that neither component is well fit by the Gaussians plotted in Figure 6. The FWHM of these Gaussians do however give a good indication of the velocity range of the bulk of the Ly emitting gas. Both contain a pair of narrow peaks just redward of zero velocity (more prominent in the east component).
Both the east and west show a broad dip at km s-1 due to partial covering by the Ly absorption system discussed in Section 3.2. In the eastern component this dip reaches to zero flux at km s-1. The eastern component is more strongly absorbed than the west, consistent with the spatial offset marked in the lower panels of Figures 2 and 3. To constrain further the difference in spatial coverage of the absorber, we estimated the velocity spread of the absorption in the quasar and in the total extended emission spectra. At an optical depth , km s-1 towards the quasar, whereas it is only km s-1 for the halo, the latter not extending as far in the blue as that towards the nuclear emission. Using the four component fit of the Ly absorption profile, we find a velocity spread km s-1 for the two outermost components. The total rest equivalent widths of Ly in the quasar and extended spectra also roughly constrain the variations in the amount of gas in the absorber. We find and Å for the quasar and halo, respectively. This suggests a significant difference in the amount of absorbing gas towards the nucleus and the extended halo.
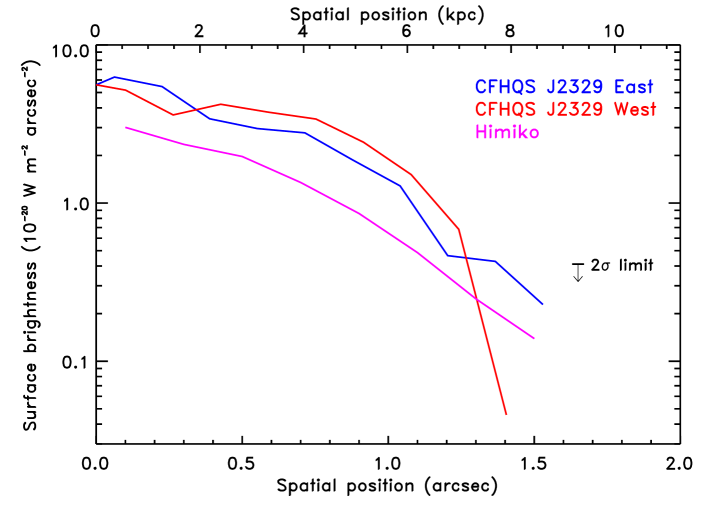
Figure 7 shows the surface brightness profile along the slit in each direction from the quasar. Emission on both sides of the slit is visible up to 1.5 arcsec from the quasar, similar to the physical extent visible in Subaru imaging (Figure 1). The two components have similar surface brightness distributions, although the western component appears to have a sharp cutoff at distance 1.3 arcsec.
Also plotted on Figure 7 is the radial profile of the Ly blob Himiko from the narrow-band imaging of Ouchi et al. (2009). The size and surface brightness profiles of these two objects are very similar, although the halo of CFHQS J2329-0301 is a factor of 2 brighter than Himiko. This will be discussed further in Section 4.
4. Discussion
The Ly halo around CFHQS J2329-0301 has a physical extent of at least kpc. By comparison, typical star-forming galaxies at have a half-light radius of kpc (Bouwens et al. 2004). The Ly halo contains gas with a velocity range of km s-1. The total emission line flux within the 1 arcsec ESI slit is W m-2 which gives a line luminosity of W. Accounting for the fact that only half the flux identified in the Subaru imaging of Section 2 is located within the ESI slit and that the majority of the extended emission from imaging is not identified in our spectroscopy, the total flux and luminosity are at least twice as great as this, i.e. W.
The halo line luminosity is comparable to the most luminous Ly blobs known (Steidel et al. 2000). Christensen et al. (2006) showed that radio-quiet quasars at have Ly halos with luminosities typically 0.5% of the broad Ly luminosity. By comparison, for radio-loud quasars (Heckman et al. 1991), this ratio is typically 5%. For CFHQS J2329-0301 the ratio is 5%, despite the fact it is not a strong radio source (Wang et al. 2008).
Interpreting the physical nature of Ly halos is notoriously difficult. Ly is resonantly scattered so the observed spatial and kinematical distributions are not those where the photons were emitted. Ly photons can be generated from several different mechanisms including shock heating of infalling/outflowing gas or photo-ionization by stars or an AGN. For the case of CFHQS J2329-0301, we know that the center of the galaxy harbors a black hole accreting at the Eddington limit (Willott et al. 2010) which is generating a lot of Ly emission within the quasar broad-line region (upper panel of Figure 2). The influence of the quasar UV emission extends 2.5 Mpc along our line-of-sight as evidenced by the transmitted flux at km s-1 in the upper panel of Figure 2 (see also Willott et al. 2007). This makes the AGN explanation to power the Ly halo a distinct possibility. The size and surface brightness of the observed halo is within the range predicted by Haiman & Rees (2001) for cold gas photoionized by a quasar. This implies the galaxy is at an early stage in its evolution due to the copious amount of cold gas located at large distances from the nucleus. The higher ratio of halo to broad-line luminosity compared to radio-quiet quasars at could be due to a greater covering factor of cold gas at higher redshifts, but a larger sample at is required.
What clues come from the gas kinematics? The gas is approximately centred at the quasar systemic velocity when accounting for the absorption by the system at km s-1. The infall models of Villar-Martin et al. (2007) and Weidinger et al. (2004) both expect a spatial offset of the peak emission, a velocity offset up to km s-1 and a velocity FWHM that varies systematically across the object. None of these features are observed for this Ly halo. Therefore there is no evidence that the gas is dominated by either outflowing or infalling gas.
The velocity FWHM of km s-1 reflects the velocity range of the gas where the Ly photons are emitted and scattered within the central 15 kpc diameter of the host galaxy. This FWHM is much higher than that of the infalling Ly gas in the quasar Q 1205-30 (Weidinger et al. 2004) or of Himiko which has FWHM km s-1. However, it is comparable to other Ly blobs found at which are suggested to be the sites of massive galaxy formation based on these large line widths (Matsuda et al. 2006) and to the quasar Ly halos observed by Christensen et al. (2006).
Making the possibly unreasonable assumption that the gas is in virial equilibrium at a typical distance of 7 kpc with velocity dispersion km s-1, one can determine a dynamical mass of using . Haiman & Rees (2001) show that even massive halos such as that based on this dynamical mass can contain substantial quantities of cold gas in their inner regions due to the short cooling time. We note in passing that elliptical galaxies in the local universe with km s-1 typically contain black holes with the same mass as CFHQS J2329-0301 (Tremaine et al. 2002). This is in contrast to the results of Wang et al. (2010) which found SDSS quasars have black hole mass to bulge mass ratios a factor of greater than locally.
5. Conclusions
We have spectroscopically identified a large and extremely luminous Ly halo around one of the most distant known quasars. The Ly properties do not show signatures of either infall or outflow. The power source for the Ly emission is likely ionization of cold neutral gas by the strong UV continuum of the quasar. A neutral hydrogen and highly-ionized metal absorption system in the foreground is more strongly absorbed towards the quasar nucleus and eastern component of the Ly halo than towards the western component.
The Ly luminosity of the halo relative to the broad line region is at least ten times greater than for typical quasars at redshift (Christensen et al. 2006). This could indicate a greater covering factor of cold neutral gas at higher redshifts. However, this is the only quasar at which has been observed to have extended Ly emission. It will be important to study other high-redshift quasars to provide a statistical measure of the evolution in the properties of Ly halos. Narrow-band imaging centred on the narrow Ly line wavelength and integral-field spectroscopy will be the most important observational tools to examine this issue.
References
- (1) Bouwens, R. J., et al. 2004, ApJ, 616, 79
- (2) Christensen, L., Jahnke, K., Wisotzki, L., & Sánchez, S. F. 2006, A&A, 459, 717
- (3) Dekel, A., et al. 2009, Nature, 457, 451
- (4) Faucher-Giguère C.-A., & Keres, D. 2011, MNRAS, 412, 118
- (5) Fynbo, J. U., Moller, P., & Warren, S. J. 1999, MNRAS, 305, 849
- (6) Goto, T., Utsumi, Y., Furusawa, H., Miyazaki, S., & Komiyama, Y. 2009, MNRAS, 400, 843 (G09)
- (7) Haiman, Z., Spaans, M., & Quataert, E. 2000, ApJ, 537, L5
- (8) Haiman, Z., & Rees, M. J. 2001, ApJ, 556, 87
- (9) Heckman, T. M., Miley, G. K., Lehnert, M. D., & van Breugel, W. 1991, ApJ, 370, 78
- (10) Hennawi, J. F., Prochaska, J. X., Kollmeier, J., & Zheng, Z. 2009, ApJ, 693, L49
- (11) Jiang, L., et al. 2007, AJ, 134, 1150
- (12) Komatsu, E., et al. 2009, ApJS, 180, 330
- (13) Kurk, J. D., et al. 2007, ApJ, 669, 32
- (14) Kurk, J. D., Walter, F., Fan, X., Jiang, L., Jester, S., Rix, H.-W., & Riechers, D. A. 2009, ApJ, 702, 833
- (15) Matsuda, Y., et al. 2004, AJ, 128, 569
- (16) Matsuda, Y., Yamada, T., Hayashino, T., Yamauchi, R., & Nakamura, Y., 2006, AJ, 128, 569
- (17) Moller, P. 2000, The Messenger, 99, 31
- (18) Moller, P., Warren, S. J., Fall, S. M., Jakobsen, P., & Fynbo, J. U. 2000, The Messenger, 99, 33
- (19) Ouchi, M., et al., 2009, ApJ, 696, 1164
- (20) Richards, G. T., Vanden Berk, D. E., Reichard, T. A., Hall, P. B., Schneider, D. P., SubbaRao, M., Thakar, A. R., & York, D. G. 2002, AJ, 124, 1
- (21) Sheinis, A. I., Bolte, M., Epps, H. W., Kibrick, R. I., Miller, J. S., Radovan, M. V., Bigelow, B. C., & Sutin, B. M. 2002, PASP, 114, 798
- (22) Steidel, C. C., Adelberger, K. L., Shapley, A. E., Pettini, M., Dickinson, M., & Giavalisco, M. 2000, ApJ, 532, 170
- (23) Tremaine, S., et al. 2002, ApJ, 574, 740
- (24) Utsumi, Y., Goto, T., Kashikawa, N., Miyazaki, S., Komiyama, Y., Furusawa, H., & Overzier R. 2010, ApJ, 721, 1680
- (25) Villar-Martín, M., et al., 2007, MNRAS, 378, 416
- (26) Volonteri, M., & Rees, M. J., 2006, ApJ, 650, 669
- (27) Wang, R., et al. 2008, ApJ, 687, 848
- (28) Wang, R., et al. 2010, ApJ, 714, 699
- (29) Weidinger, M., Moller, P., & Fynbo, J. U. 2004, Nature, 430, 999
- (30) Willott, C. J., et al. 2007, AJ, 134, 2435
- (31) Willott, C. J., et al. 2010, AJ, 140, 546