Oscillations of prominences observed by MSDP and HSFA telescopes
Abstract
Results of an oscillation analysis of two solar quiescent prominences (QPs) observed with two quite different telescopes and spectrographs are presented. For the QP of 23 September 2009 we used data from the Multi-channel Subtractive Double Pass Spectrograph (MSDP) installed in Białków Observatory which provides H two dimensional spectra with a higher spatial resolution but with a smaller spectral resolution. The other QP was observed on 20 August 2010 with the Ondřejov Multichannel Spectrograph (HSFA-2) in 5 spectral lines and the slit-jaw imaging system simultaneously. Doppler velocity was analyzed in the both the QPs. In addition, using MSDP possibilities, for the QP of 23 September 2009 we analyzed also movements in the plane of sky. In both the QPs we found oscillations with a small amplitude (less than 0.3 km/s) and with a medium period (approx. a dozen of minutes) which occurred simultaneously. We discuss results reported by other authors.
keywords:
solar spectra - quiescent prominences - oscillations1 Introduction
Dense and cold plasma of solar prominences is embedded hot corona and supported by forces of electromagnetic field and pressure against the downward force of gravity. As was shown by recent HINODE observations prominences have a complicated internal structure of many thin threads where the plasma flows along magnetic field lines in all directions. Existence of waves and oscillations of magnetic fields must influence material that is absorbing and emitting radiation in spectral lines. Therefore, a study of prominence spectra obtained with a high temporal, spectral and spatial resolution is an important tool for diagnostics of processes both in the prominence magnetoplasma.
The aim of this paper is to show possibilities of the two quite different spectral and imaging solar telescopes and specrographs for long-time observations of prominences and study of oscillations detectable in Doppler velocity component and in the plane of sky.
2 Observations and Data Reductions
The analyzed prominence data were obtained at the Multi-channel Subtractive Double Pass Spectrograph (MSDP) installed in Białków Observatory and at the Multichannel Spectrograph (HSFA-2) in the Ondřejov observatory in frame of a bilateral cooperation. A quite numerous set of observations has been done but only a small fraction was processed until now. For processing we tried to select QPs both belonging to the polar crown and those from lower latitudes nearby active regions. Neither the orientation of the prominence axis to the line-of-sight, nor the prominence type, were taken into account in the event selection.
2.1 MSDP
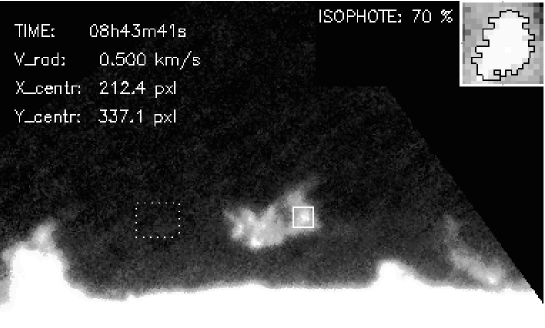
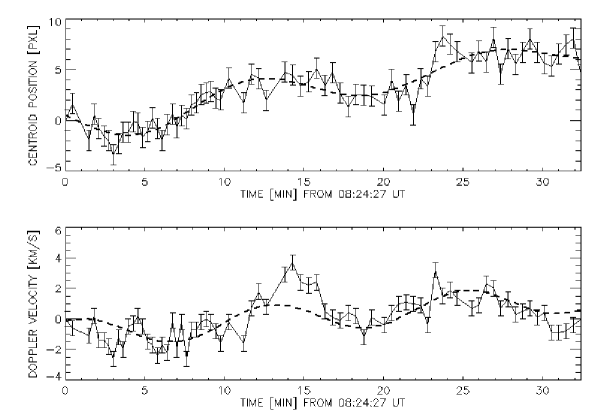
The prominence of 23 September 2009 was observed with the Multichannel Subtractive Double Pass Spectrograph (MSDP) installed in Białków Observatory (for instrument description and data reduction overview, see. ??) during the interval 08:27:24 - 09:00:00 UT. It was located at the south-east limb at heliographic latitude S50, about 40 degrees east of the active region NOAA 11026. The prominence axis was oriented almost perpendicular to the line-of-sight. An image of the prominence observed by MSDP at 08:43:41 UT is shown in Figure 1. Time cadence was between 25 and 34 seconds depending on the size of scanning area. After a standard data reduction (dark current subtraction, flat-fielding, geometry correction) we chose for an analysis a kernel in the upper-right part of the prominence (see Figure 1). Due to a large amount of data we applied an automating kernel tracking (described in ?) to point position of the kernel in all images. Using possibilities of the MSDP we were able to obtain the mean Doppler velocity of the kernel during time of observations together with position of the centroid of the kernel in all (74) images in which the kernel was visible. During the data reduction we applied a procedure of scattered light subtraction. We took a sample of scattered light from an area in the image above the limb without any emission structure. As the sample was taken from the same image (with the same observational conditions and exposure time) we applied subtraction of mean scattered-light profile from the mean emission profile of the kernel directly. Subtraction of scattered light allows to increase relative peak in emission profile of the prominence. Then the emission profile was fitted by a gaussian. From shift of the center of gaussian we obtained mean a Doppler velocity of the kernel in all images. Centroid of the kernel was calculated as a centroid of all points inside the limiting isophote weighted by a pixel signal. Results are presented in Figure 2.
2.2 HSFA-2
One of the two horizontal solar telescopes with spectrograph HSFA2 (Horizontal Sonnen Forschung Anlage) was modified recently (for telescope description, see ?) for Multichannel spectrograph. It provides simultaneous observations in five spectral lines (H, H, D3 of HeI, CaII 8542 Å and CaII H or CaII K) and H slit-jaw images. Data are recorded by fast CCD cameras of 1024 x 1280 image size with a quadratic pixel of 6.7 m and binned to 1024 x 1280 images. Data reduction contains a standard procedure (dark-frame and flat-fielding) as well as determination of dispersion curve for all spectral images. The scattered light subtraction after the calibration process was also applied to all spectral images in all the spectral lines mentioned above.
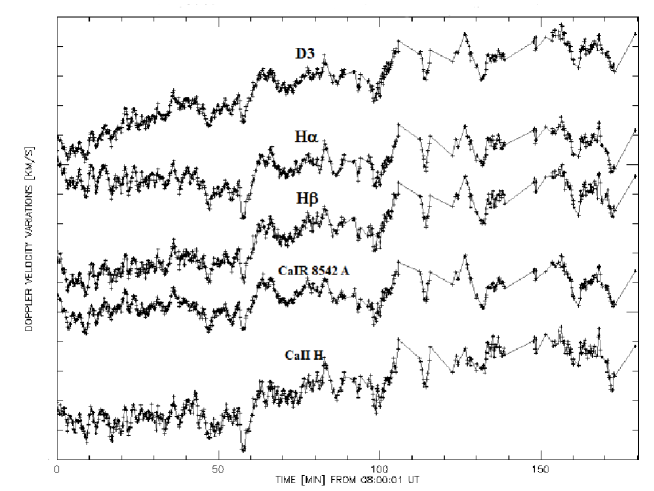
The prominence of 20 August 2010 was observed with HSFA-2 during the interval 08:00:01 - 11:00:19 UT. It was located at the south-east limb at a heliographic latitude of 30S. The prominence axis was oriented almost perpendicular to the line-of-sight and can be characterized as a funnel type. An image of the prominence observed by HSFA at 08:53:42 UT is shown in Figure 3. Time cadence was 9 seconds.
The next step was an approximation of the prominence emission profile by a gaussian and determination of the Doppler velocity component. The time profile of the calculated Doppler velocity (Figure 4) was used for analysis and detection of oscillations.

3 Results
Using MSDP we detected (quasi-)periodic oscillations in Doppler velocity component as well as in the position of the kernel in the plane of sky. After calculating Scargle’s periodogram (?) from data between 8:27 to 9:00 UT we found a period equal to 12.11 minutes in Doppler velocity and 14.35 minutes in position in horizontal direction. No oscillations were detected in vertical direction. Table 1 summarizes obtained results.
| Spectral line | Period [min] | Amplitude |
| 23 Sep 2009 - MSDP | ||
| H | 12.11 | 0.96 km/s |
| H | 14.35 | 1.43 pxl |
| 20 Aug 2010 - HSFA-2 | ||
| H | 66.74 | 0.269 km/s |
| 30.19 | 0.153 km/s | |
| 12.68 | 0.181 km/s | |
| 10.31 | 0.231 km/s | |
| 3.51 | 0.102 km/s | |
| CaD | 142.81 | 0.179 km/s |
| 63.66 | 0.278 km/s | |
| 38.66 | 0.143 km/s | |
| 12.56 | 0.184 km/s | |
| 10.31 | 0.238 km/s | |
| D3D | 39.77 | 0.309 km/s |
| 22.72 | 0.226 km/s | |
| 14.26 | 0.176 km/s | |
| 12.45 | 0.101 km/s | |
| 10.31 | 0.141 km/s | |
| H | 66.74 | 0.177 km/s |
| 39.77 | 0.242 km/s | |
| 21.99 | 0.178 km/s | |
| 12.68 | 0.148 km/s | |
| 10.31 | 0.186 km/s | |
| CaIRD | 40.95 | 0.263 km/s |
| 22.35 | 0.194 km/s | |
| 14.56 | 0.187 km/s | |
| 12.56 | 0.123 km/s | |
| 10.31 | 0.160 km/s | |
The HSFA-2 data were influenced by seeing. It causes shifting of the image of the prominence on the spectrograph slit and as a result we observe slightly different parts of the prominence. Fortunately, exposure time for prominence spectra was about 100 ms and the seeing was approx. 2 - 3 arcsec. In the axis parallel to the slit we applied coalignment of slit-jaw image as well as spectral images using correlations of visible structures. After that we calculated a shift in perpendicular axis. Finally we rejected from further analysis images with shift greater than 10 pixels (2 arcsec). From fitting gaussian to emission profiles of the prominence we calculate Doppler velocity time series which were analyzed using Scargle’s formula. We detected peaks in periodograms of particular time series for spectral line observed by HSFA-2 (see Table 1). Values of detected periods slightly vary from line to line, however periods 10.31 min and 12.45-12.68 min occur in all lines. We conclude that only these two periods could be treated as real since there is no reason to oscillate mass in particular prominence with different periods in different lines. Detected amplitudes are in the order 0.1-0.2 km/s.
4 Discussion and Conclusions
Doppler velocity oscillations were found in both analyzed prominences. From MSDP data of prominence of 23 September 2009 we found period 12.11 min and from HSFA-2 periods 10.31 min and 12.56 min. Although the most of observed periods are grouped in two classes: less than 10 minutes and more than 40 minutes (?), periods in the range 10-40 min were also observed recently (e.g., ???). Amplitudes detected by us are rather low ( 1.0 km/s in MSDP case and 0.3km/s in HSFA-2 case), however other authors also reported such low values (e.g., ?). For classification of prominence oscillations, see also ?.
Taking to the account period detected in the plane of the sky from MSDP data one can estimate magnetic field geometry. If we assume that prominence axis lays exactly in the plane of the sky then according ? there is:
where: , - periods in the plane of the sky and in Doppler signal, , - components of magnetic field (vertical and parallel to prominence axis respectivately), - inclination of magnetic field lines on the prominence boundary. From our estimations there is: which yields to 50 degrees.
Future analysis of data of prominences observed simultaneously by MSDP and HSFA-2 during observational campaign in August 2010 may bring new results concerning prominence oscillations. Then the numerous set of observations will allow us to apply selection criteria concerning types, orientations, and positions of analyzed quiescent prominences.
Acknowledgements
PK appreciates support of the GA CR grants 205/09/1469, P209/10/1706 and the Astronomical Institute Research Project AV0Z10030501. MZ would like to thank prof. Paweł Rudawy for his help during preparation of this article.
Bibliography
- Anzer, U.: 2009, A&A 497, 521.
- Bashkirtsev, V. S., and Mashnich, G. P.: 1984, Sol. Phys. 91, 93.
- Kotrč, P.: 2009, Central European Astrophysical Bulletin 33, 327.
- Oliver, R., and Ballester, J. L.: 2002, Sol. Phys. 206, 45.
- Régnier, S., Solomon, J., and Vial, J. C.: 2001, A&A 376, 292.
- Rudawy, P.: 2006. private communication.
- Scargle, J. D.: 1982, ApJ 263, 835.
- Suetterlin, P., Wiehr, E., Bianda, M., and Kueveler, G.: 1997, A&A 321, 921.
- Vrsnak, B.: 1993, Hvar Observatory Bulletin 17, 23.
- Yi, Z., Engvold, O., and Keil, S. L.: 1991, Sol. Phys. 132, 63.
- Zapiór, M., and Rudawy, P.: 2007, Central European Astrophysical Bulletin 31, 287.
- Zapiór, M., and Rudawy, P.: 2010, Sol. Phys. 267, 95.