Ejecta detection in the middle-aged Galactic supernova remnant G296.10.5 observed with Suzaku
Abstract
In this paper, we report the detection of ejecta in the middle-aged Galactic supernova remnant G296.10.5 with the X-ray Imaging Spectrometer onboard the Suzaku satellite. The spectra of three lobes, north, southeast and southwest and inter-lobe regions, consist of soft (0.32.0 keV) emission originated from non-equilibrium ionization plasma. In north, southeast and inter-lobe regions, the thermal emission can be represented by a one-component, in southwest region it can be represented by two-component non-equilibrium ionization (VNEI) model. The spectra of studied regions have lines of N, O, Ne, Mg and Si elements. Si emission from this remnant is shown for the first time in this work. Enhanced abundances of Ne, Mg and Si elements obtained show the ejecta contribution in all regions. Assuming that the remnant is in Sedov phase, we obtained ambient density cm-3, age yr, shock velocity km s-1, shock temperature K, and swept-up mass M☉ at an adopted distance of d=3 kpc.
keywords:
ISM: supernova remnantsISM: individual(G296.10.5)X-rays:ISM1 Introduction
The shell type Galactic supernova remnant (SNR) G296.10.5 (, ) with 3725 arcmin2 angular size was discovered in radio band at 408 MHz (Clark, Caswell & Green, 1973, 1975). Longmore, Clark & Murdin (1977) performed optical observation of the remnant and reported the identification of the nebulosity and its filamentary nature. Hutchings, Crampton & Cowley (1981) suggested that there was another SNR located at the northeast part of the radio remnant. Since the region in which the remnant is located on the Galactic plane is rich in SNRs, this suggestion seemed reasonable. Caswell & Bornes (1983), with an improved radio map at 408 MHz, and Bignami et al. (1986), with X-ray data from EXOSAT and Einstein observations, reported that this is a single, complex remnant. From ROSAT X-ray data Hwang & Market (1994) obtained an interstellar absorbtion of cm-2 and a low electron temperature keV from single temperature model fitting. They also applied two temperature component model, obtained electron temperatures of 0.1 keV and 3.5 keV for each component. Assuming the distance of 4 kpc and ellipsoidal shell geometry for the remnant, they found total X-ray emitting mass and ambient density to be 250 M☉ and 0.8 cm-3, respectively. Using the Sedov equations, they found an age of yr. From the data of XMM-Newton observation, Castro et al. (2011) found the electron temperature =0.6 keV by applying a non-equilibrium ionization model (VNEI) to the spectra. They obtained a low absorbing column density, cm-2, excess of N, and a deficit of O. They suggested a massive progenitor star and concluded that the remnant was resulted from core-collapse supernova. They have detected a transient source 2XMMi J115004.8 622442 at the edge of this remnant.
Various distance estimates were given from different studies; Longmore, Clark & Murdin (1977) estimated the distance d= kpc by using H and H observations and reddening measurements in the direction of crux (Miller, 1972), and by fitting the radial velocity (35 km s-1 with respect to the local standard of rest) to galactic rotation. From D relation Caswell & Bornes (1983), Case & Bhattacharya (1998) and Clark, Caswell & Green (1973) adopted d=7.7 kpc, d=6.6 kpc and d=4.9 kpc, respectively. Castro et al. (2011) assumed d=2 kpc, considering the giant HI shell, GSH 304-00-0.5 located in front of the remnant at d 1.2 kpc.
Our aim is to study middle-aged SNRs to investigate interstellar medium (ISM)/shock interactions and ISM itself, i.e., the status of the ionization state, temperature (line emission) variation all over the remnant. G296.10.5 is particularly interesting one with its complex shock and plasma structure. The Japanese X-ray observatory Suzaku (Mitsuda et al., 2007), since it has a large collecting area and low background, is capable of resolving line emission characteristic of SNRs, especially at low energies, that provides valuable information in understanding SNRs. By using the archival data of Suzaku, we were able to produce higher quality image and the spectra of the remnant, which motivated us for this study.
This paper is organized as follows. We describe the observations and the data reduction in Section 2. In Section 3, we explain the details of image and spectral analysis. In Section 4, we discuss our results and description of the X-ray emission from G296.10.5.
2 Observations and Data Reduction
The Suzaku observations of the north and south regions of G296.10.5 were made on 2007 August 09 and on 2008 January 17, respectively, with X-ray Imaging Spectrometer (XIS: Koyama et al. (2007)). The observation ID and exposure time are 502068010, 502069010 and 77.2, 69.2 ksec, respectively. The XIS consists of four sets of X-ray CCD camera system (XIS0, 1, 2, and 3). XIS1 has a back-illuminated (BI) sensor, while XIS0, 2, and 3 have front-illuminated (FI) sensors. The XIS2 sensor was available only until 2006, therefore, we use data of XIS0, XIS1, XIS3. The XIS has a field of view (FOV) of a 17.817.8 arcmin2.
In both observations, the XIS was operated in the normal full-frame clocking mode with the standard and editing mode. Response matrices and ancillary response files (ARFs) were generated for each XIS independently using xissimrmfgen version 2007-05-14 and xissimarfgen version 2008-04-05 (Ishisaki et al., 2007). Reduction and analysis of the data were performed following the standard procedure using the headas v6.4 software package, and spectral fitting was performed with xspec v.11.3.2 (Arnaud, 1996).
3 Analysis
3.1 Image Analysis
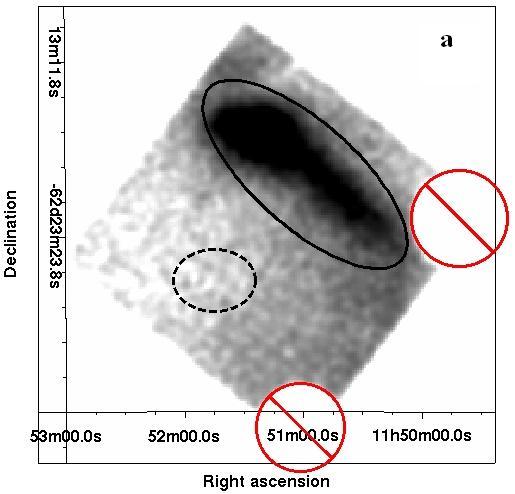
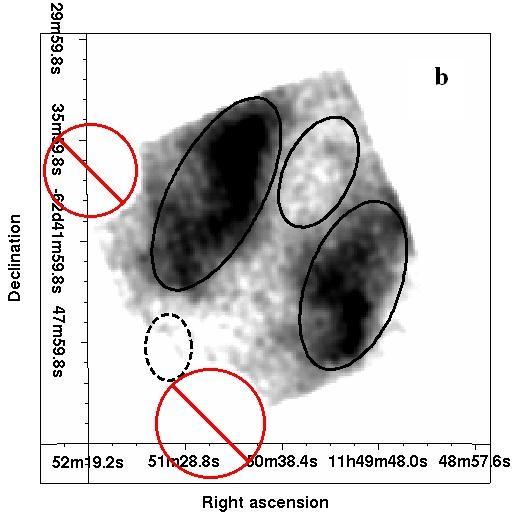
Figure 1a and 1b present the smoothed XIS0 images of north and south regions of G296.10.5 in 0.310 keV energy band, respectively. In the northern part there is one bright lobe, while in the southern part there are two bright lobes. So, to determine the temperature variations and ionization states, we studied the bright lobes and a region between the lobes in the south part as shown in Fig. 1a and 1b with solid ellipses. The regions are abbreviated as north (N), southeast (SE), southwest (SW) and inter-lobe (M) region. M region is selected as the reference location in order to highlight the peculiar properties of the lobes if there is any. Dashed ellipses in both figures show the regions chosen for background subtraction. The calibration sources located at the two corners in the FOV are excluded.
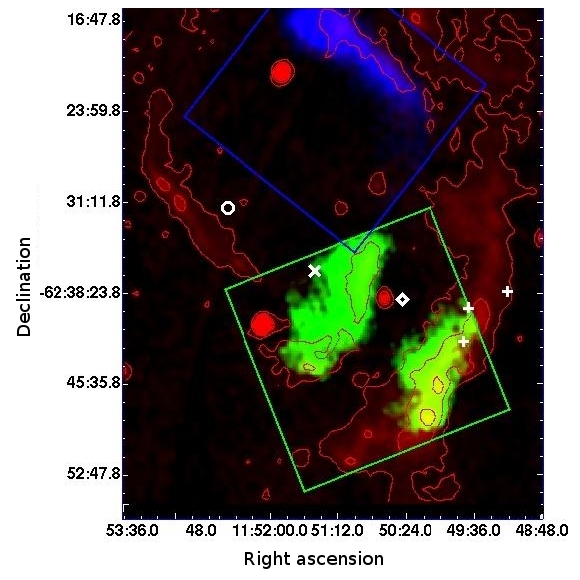
Figure 2 gives the mosaic image of XIS0 in 0.310 keV energy band, N and S, which are overlaid with the radio image obtained at 843 MHz by (1996) for comparison, the positions of optical filaments (Longmore, Clark & Murdin, 1977), H emission and thin filament (, 2001) and molecular material (Brand et al., 1987) are also pointed out.
3.2 Spectral Analysis
We extracted the representative XIS spectra from four elliptical regions named as N, SE, SW and M (Fig. 1a and 1b) by using xselect version 2.4. The coordinates of the ellipses, their sizes and angles are listed in Table 1. All spectra are grouped with a minimum 20 counts bin-1.
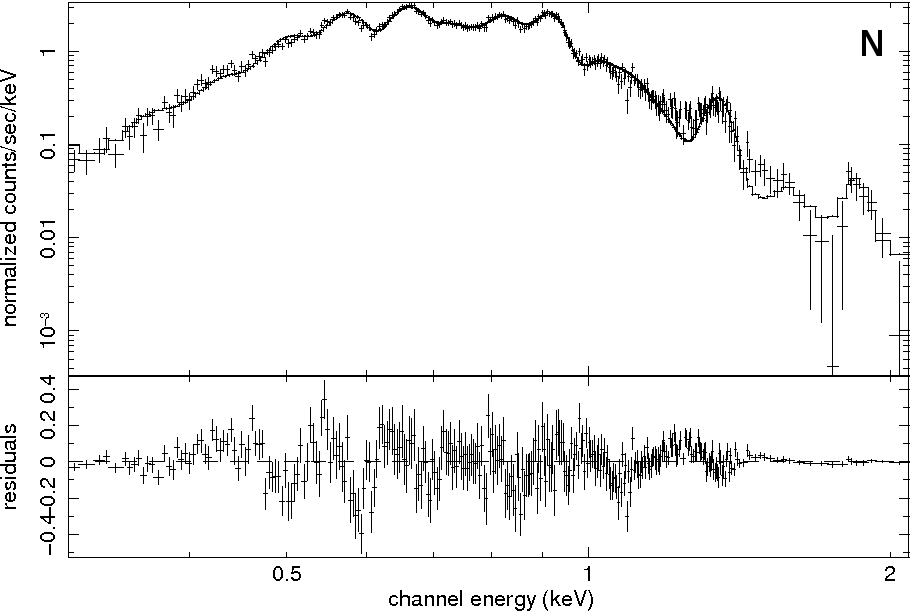
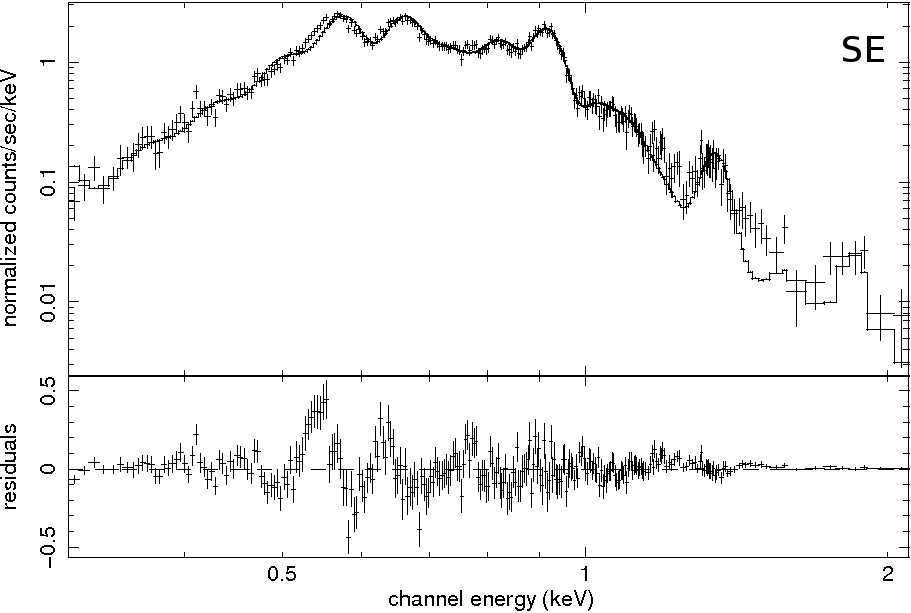
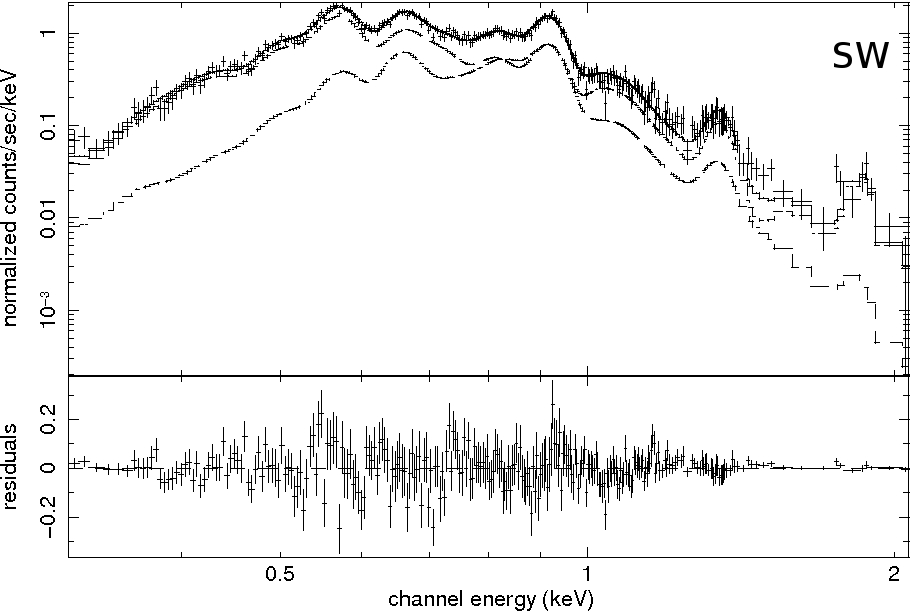
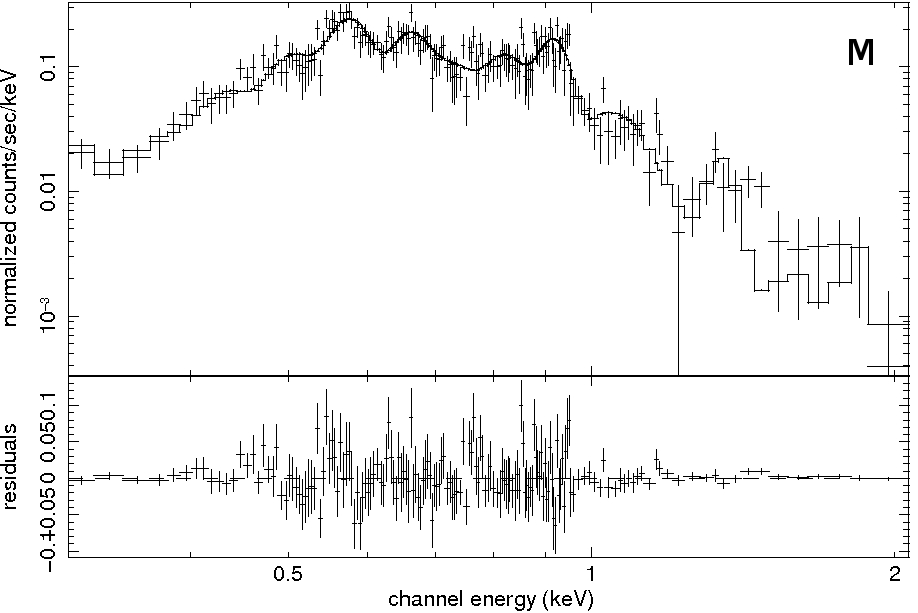
From the spectra we see that emission in 0.32.0 keV soft energy range is dominant and K-shell lines of N, O, Ne, Mg, and Si are present for all regions, while in 210 keV energy range the emission is too faint. So, we select the energy range of 0.32.0 keV for spectral fitting.
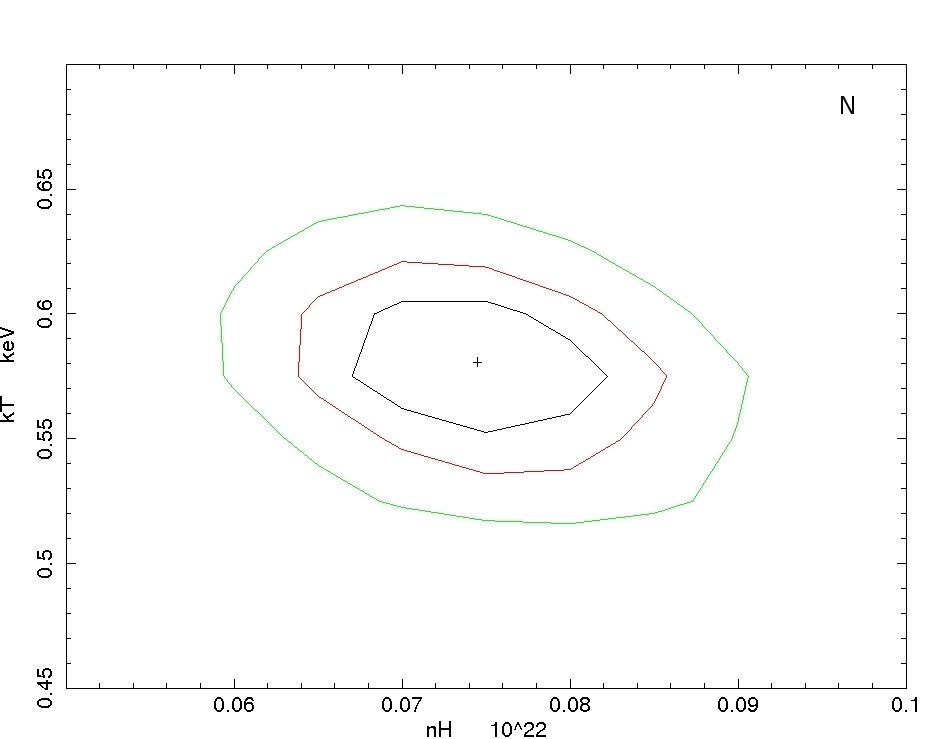
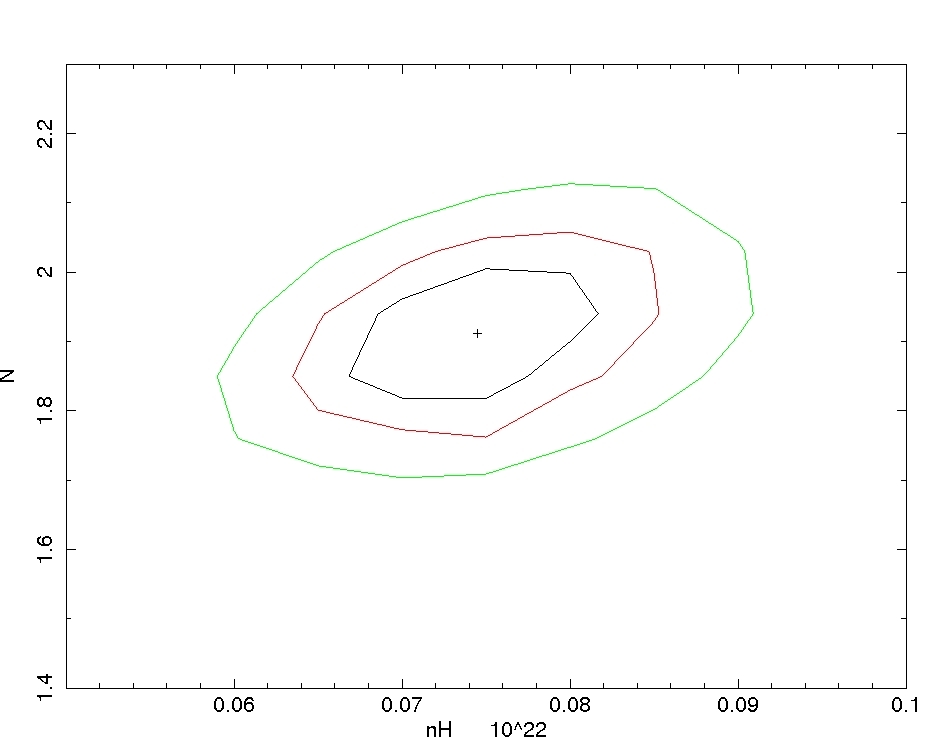
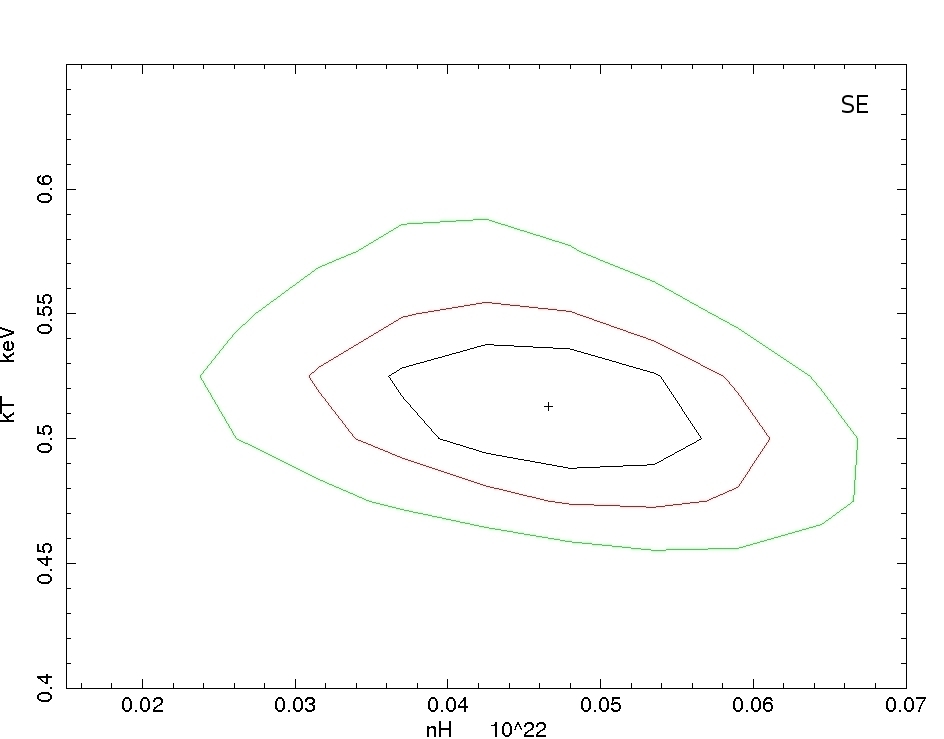
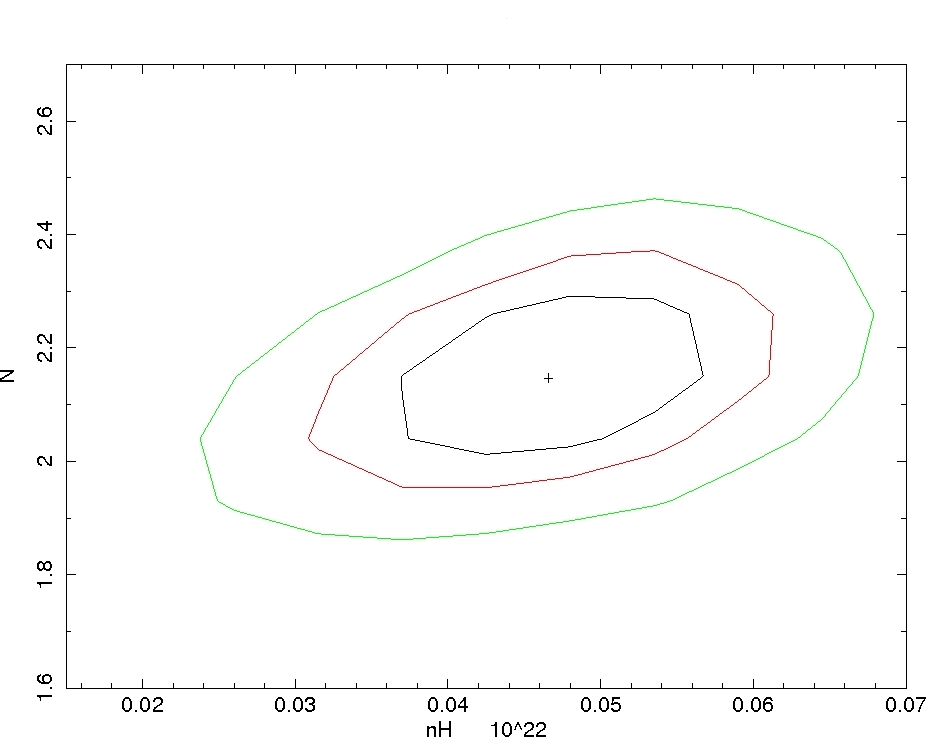
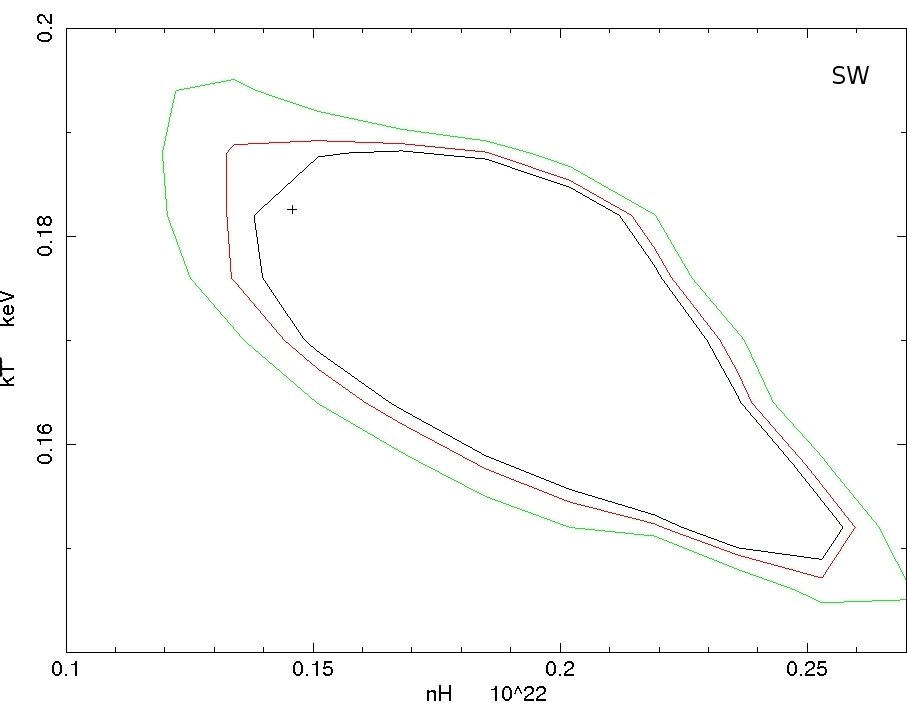
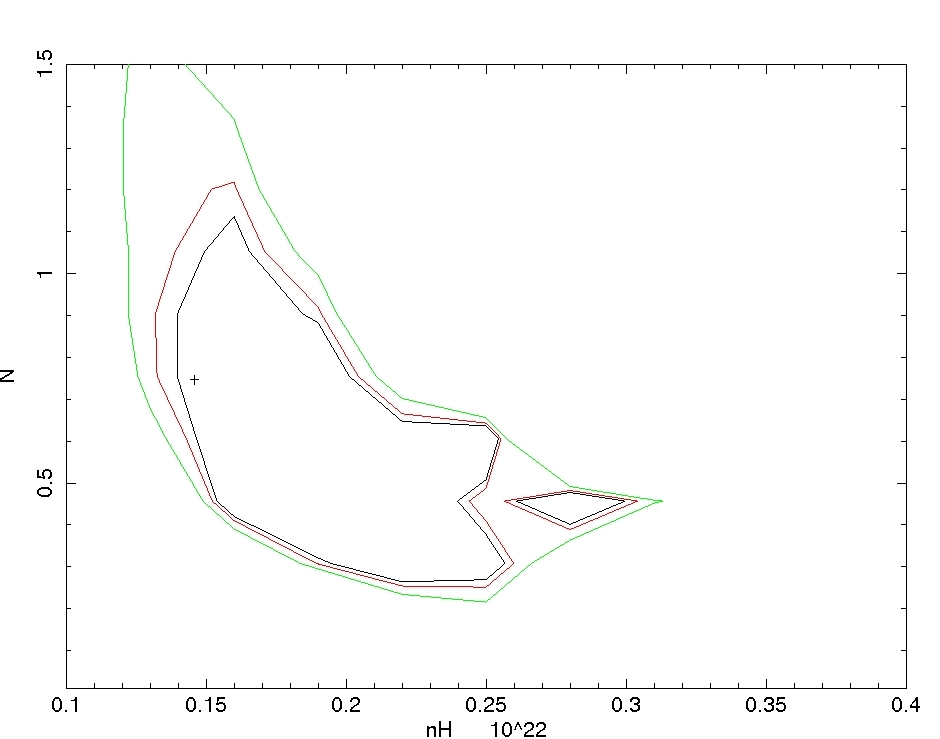
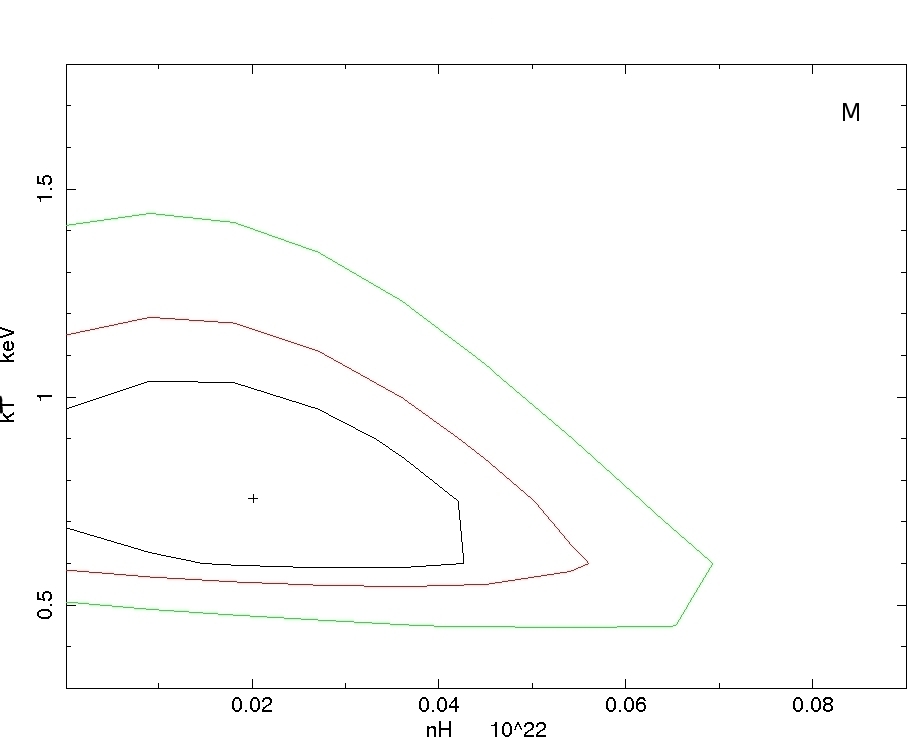
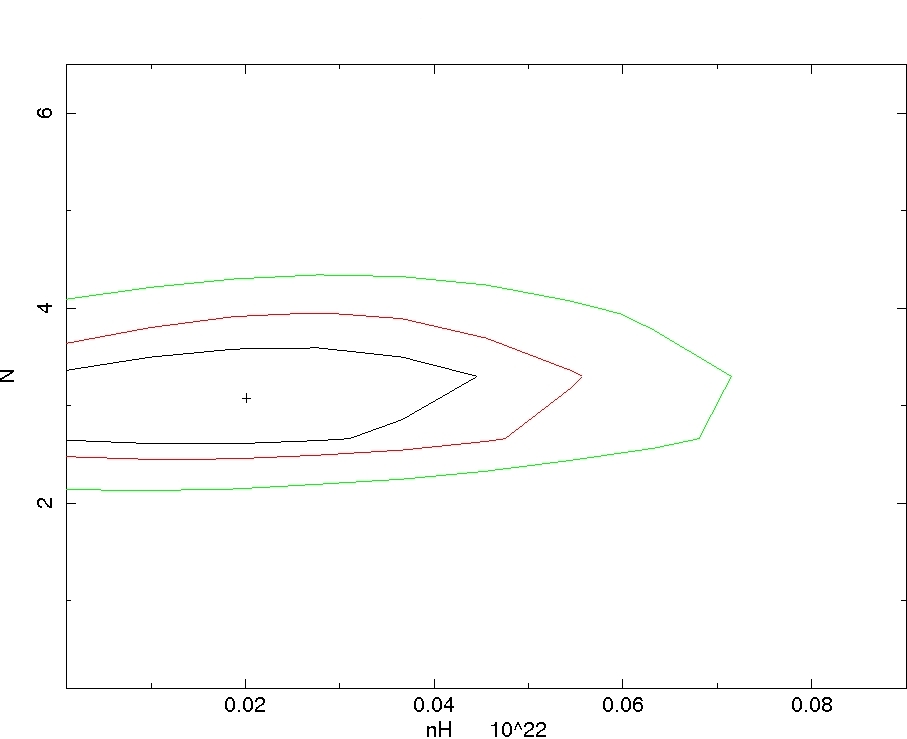
To analyze XIS data of the selected regions, since previous XMM-Newton observations showed non-equilibrium ionization (NEI) condition in this SNR, we applied NEI collisional plasma with variable abundances model (VNEI model in xspec, Borkowski, Lyerly & Reynolds (2001)) modified by interstellar absorption (wabs model in xspec, Morrison & McCammon (1983)) for all spectra. For N, SE and M regions, one-component VNEI model best describes the spectral characteristics of the emission. In the SW region, a two-component VNEI model fits (/d.o.f.=349.6/321) the emission better than a one-component VNEI model (/d.o.f.=403.6/324) statistically. During the analysis, to see if there are small scale variations the absorbing column density (), electron temperature (), the ionization timescale (, which is often used as a key diagnostic of the NEI state, is the product of the electron density multiplied by the time after the shock heating) are allowed to vary. Since the emission lines of N, O, Ne, Mg, and Si are clearly seen in the spectra, their abundances are set as free parameters while the other elemental abundances are fixed at their solar values (Anders & Grevesse, 1989). The best-fitting parameters, their errors and values for all regions are given in Table 2 with corresponding errors at the 90 per cent confidence limit. We note that, due to better photon statistics of BI (XIS1) than FI (XIS0 and XIS3), only XIS1 results are given in this table. The background-subtracted XIS1 spectra in the 0.32.0 keV energy band for N, SE, SW and M regions are shown in Figure 3. We also plot the confidence contours of the absorbing column density () versus the electron temperature () and N abundance for all regions in Figure 4. Both parameters are very well constrained for N and SE regions.
4 Discussion and Conclusions
In this paper, we give a description of the X-ray emission from G296.10.5 based on Suzaku archival data. We obtained a clear image and high quality spectra of X-ray emission that lead us detection of ejecta component in this middle-aged remnant.
The combined image, Fig. 2, shows that the remnant extends to a large area (3725 arcmin2) in radio band, while it is concentrated in three regions as bright lobes in X-ray band, two being in southern part and one being in the northern part. Suzaku observed the lobes shown by squares, not the entire remnant. Therefore we could study only the lobes and a region between SE and SW lobes. The bright X-ray emission from lobes is well correlated with radio emission. In both bands, G296.10.5 shows partial (irregular) shell morphology. Since radio emission is not effected by absorbtion we can say that the shape of the remnant is intrinsically anisotropic and it is interacting with a non-uniform medium. The optical imaging performed by Longmore, Clark & Murdin (1977) shows that SW region covers optical filaments with [S ii]/H 1.2 which is a typical value for shocked gas. They obtained an electron density as high as . (2001) detected strong localized diffuse H emission using the data from the Marseille survey and many thin filaments by equivalent AAO/UKST H survey in the direction of the remnant. Brand et al. (1987) detected molecular material with a radial velocity of km s-1 at , by using CO observations (see Fig. 2). All these observations may indicate that a shock-cloud interaction is going on and the lobes may result from these interactions.
X-ray emission of regions N, SE and M, can be described by one-component non-equilibrium ionization model (VNEI) in 0.32.0 keV band with electron temperature in the range of () keV which is in good agreement with the recent work by Castro et al. (2011), while almost three times higher than that of Hwang & Market (1994). The ionization time scale, , ranges between s indicating that the plasma in these regions is far from ionization equilibrium condition ( is typically required to be s for full ionization equilibrium (, 1984)). On the other side, in the SW region, thermal emission can be adequately described by two-component non-equilibrium ionization model (VNEI+VNEI): the colder, keV, is characterized by lower solar abundances of O and N and ionization time scale s, the hotter, keV, by over abundances of Ne, Mg and Si and ionization time scale s, both components are far from ionization equilibrium condition in this region also.
The elemental abundance values of N, O, Ne, Mg and Si show small variations in N, SE and M regions. In N and SE regions, the abundance of O appears to be lower or about solar value, N, Ne, Mg and Si values are somewhat higher than solar. In general, shocked ISM spectra shows lower or about solar abundances. The plasma in these two regions contains swept-up ISM and ejecta contamination. In M region, abundance values and their errors seem somewhat higher as compared to N and SE regions (see Table 2). We note that the photon statistics in this region is poor (see Fig. 3), therefore we can say that, like N and SE regions, the plasma contains swept-up ISM and ejecta contamination. In SW region, the abundances of N and O from cold component are lower solar indicating ISM origin, while Ne, Mg and Si values from hot component are high enough to show the evidence of ejecta origin in this region also. G296.10.5 is a middle-aged remnant, thus the presence of ejecta at its evolved stage is not expected. However, recent X-ray observations show that in a number of middle-aged remnants metal rich ejecta are still present (e.g. G156.2+5.7 (Yamauchi et al., 1999), N49B (Park et al., 2003), IC443 (Troja et al., 2008) and Puppis A (Hwang, Petre & Flanagan, 2008)). As seen in Fig. 2, the presence of molecular material in the vicinity of SE and SW regions may cause the survival of ejecta in especially these regions of this middle-aged remnant.
The absorbing column density value is ranging between () across the remnant. value of SW region obtained from two temperature model, , is in agreement with the value of Hwang & Market (1994) obtained by applying two temperature model. On the other hand, value of N and SE regions are times smaller than value of Hwang & Market (1994) obtained by applying one temperature model, while times higher than that of Castro et al. (2011). Therefore, for our calculations we will use d=3 kpc value, that is in between the values adopted by Hwang & Market (1994) and Castro et al. (2011) and is in agreement with the value estimated by Longmore, Clark & Murdin (1977). We note that best-fitting value for SW region is relatively higher than the other regions (see Table 2). The reason for this high value may be the inhomogeneity of the foreground absorbing medium (see Fig. 2). Since an accurate estimate of put constraints on the distance to the remnant, we obtained the confidence contours of versus and N abundance as given in Fig. 4. We see that for N and SE regions both parameters are very well constrained. The X-ray flux and the corresponding luminosity values are obtained to be erg and erg at d=3 kpc in the 0.32.0 keV energy range.
It is suggested that most optically observed SNRs are in the adiabatic phase of their evolution (McKee & Cowie, 1975). Furthermore the large physical size of this remnant, about 46 pc in radio, also suggests that it is in adiabatic expansion phase. We calculated physical parameters of G296.10.5 by using information obtained by XIS images from Sedov equations (Sedov, 1959):
| (1) |
| (2) |
| (3) |
| (4) |
| (5) |
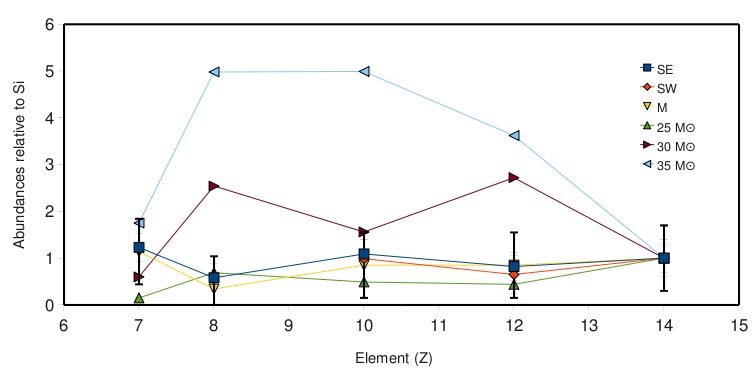
where is the shock radius, 23 pc, the explosion energy is assumed to be =1, is atomic weight of 0.604, is mass of a hydrogen atom. Through the equations (15), we obtained ambient density cm-3, age of the remnant, yr, confirming that G296.10.5 is a middle-aged SNR. The corresponding ionization age t is then s, a plasma with this ionization age is in non-equilibrium ionization condition. Assuming the electron-ion temperature equilibration, shock velocity that corresponds to best-fitting electron temperature behind the main shock front ( 0.18 keV) is calculated to be 320 km s-1. Assuming uniform density for the ambient ISM, we estimated shock temperature K and the mass swept-up by the blast wave M☉. Castro et al. (2011) suggested that G296.10.5 is resulted from a core-collapse supernova with a massive ( M☉) progenitor star. We compared our best-fitting abundances of N, O, Ne and Mg relative to Si for SE, SW and M regions with abundance ratios in core-collapse model of (1995) and the obtained results are shown in Figure 5. As seen from the figure, we can say that the progenitor star mass might be M☉. Considering the high N abundance value it appears to be roughly consistent with 30 M☉. When we compare this value with our estimated swept-up mass which is approximately ten times higher, we can say that G296.10.5 is at its critical stage and the contamination of ejecta in this middle-aged SNR is not surprising.
Acknowledgments
AS is supported by TÜBİTAK PostDoctoral Fellowship. This work is supported by the Akdeniz University Scientific Research Project Management.
References
- Anders & Grevesse (1989) Anders E., Grevesse N., 1989, Geochimica Cosmochimica Acta, 53, 197
- Arnaud (1996) Arnaud K. A., 1996, in Jacoby G., Barnes J., eds, ASP Conf. Ser. Vol.101, Astronomical Data Analysis Software and Systems V. Astron.Soc. Pac., San Francisco, p. 17
- Bignami et al. (1986) Bignami G.F., Caraveo P.A., Goldwurm A., Mereghetti S., Palumbo G.G.C., 1986, ApJ, 302, 606
- Borkowski, Lyerly & Reynolds (2001) Borkowski K. J., Lyerly W. J., Reynolds S. P., 2001, ApJ, 548, 820
- Brand et al. (1987) Brand J., Blitz L., Wouterloot J. G. A., Kerr F. J., 1987, A&AS, 68, 1
- Case & Bhattacharya (1998) Case G. L., Bhattacharya D., 1998, ApJ, 504, 761
- Castro et al. (2011) Castro D., Slane P. O., Gaensler B. M., Hughes J. P., Patnaude D. J., 2011, ApJ, 734, 86
- Caswell & Bornes (1983) Caswell J.L., Bornes P.L., 1983, ApJ, 271, L55
- Clark, Caswell & Green (1973) Clark D. H., Caswell J. L., Green A. J., 1973, Nature, 246, 28
- Clark, Caswell & Green (1975) Clark D. H., Caswell J. L., Green A. J., 1975, Australian Journal of Physics, Astrophysical Supplement, 1
- Hutchings, Crampton & Cowley (1981) Hutchings J.B, Crampton D., Cowley A.P., 1981, AJ, 86, 871
- Hwang & Market (1994) Hwang U., Market T.H., 1994, ApJ, 431, 819
- Hwang, Petre & Flanagan (2008) Hwang U., Petre R., Flanagan K.A., 2008, ApJ, 676, 378
- Ishisaki et al. (2007) Ishisaki Y. et al., 2007, PASJ, 59, 113
- Koyama et al. (2007) Koyama K. et al., 2007, PASJ, 59, 23
- Longmore, Clark & Murdin (1977) Longmore A.J., Clark D.H., Murdin P., 1977, MNRAS, 181, 541
- (17) Masai K., 1984, Ap&SS, 98, 367
- McKee & Cowie (1975) McKee C. F., Cowie L. L., 1975, ApJ, 195, 715
- Miller (1972) Miller E. W., 1972, AJ, 77, 216
- Mitsuda et al. (2007) Mitsuda K. et al., 2007, PASJ, 59, 1
- Morrison & McCammon (1983) Morrison R., McCammon D., 1983, ApJ, 270, 119
- Park et al. (2003) Park S., Hughes J. P., Slane P. O., Burrows D. N., Warren J. S., Garmire G. P., Nousek J. A., 2003, ApJ, 592, L41
- (23) Russeil D., Parker Q.A., 2001, Publ.Astron.Soc.Aust., 18, 76
- Sedov (1959) Sedov L. I., 1959, Similarity and Dimensional Methods in Mechanics, 4th edn. Academic Press, New York
- Troja et al. (2008) Troja E., Bocchino F., Miceli M., Reale F., 2008, A&A, 485, 777
- Yamauchi et al. (1999) Yamauchi S., Koyama K., Tomida H., Yokogawa J., Tamura K., 1999, PASJ, 51, 13
- (27) Whiteoak J.B.Z., Green A.J., 1996, A&AS, 118, 329
- (28) Woosley S. E., Weaver T. A., 1995, ApJS, 101, 181
| Regions | Centre Coordinates | Size | Angle |
|---|---|---|---|
| ; | (arcmin) | (degrees) | |
| ( ; ) | |||
| N | 11 50 59 ; 62 19 46 | ||
| Background111for N region; | 11 51 45 ; 62 25 56 | ||
| SE | 11 51 12 ; 62 39 13 | ||
| SW | 11 50 02 ; 62 44 38 | ||
| M | 11 50 20 ; 62 37 55 | ||
| Background222for S region. | 11 51 37 ; 62 48 19 |
| Component | Parameters | N | SE | SW | M |
|---|---|---|---|---|---|
| Absorbtion | ( ) | 7.5 | 4.7 | 14.6 | 2.0 |
| VNEI | (keV) | 0.58 | 0.51 | 0.18 | 0.76 |
| Abundance333Abundance ratio relative to the solar value (Anders & Grevesse, 1989), (1) indicates that the elemental abundance is fixed at solar. | N | 1.91 | 2.15 | 0.75 | 3.08 |
| O | 0.81 | 1.01 | 0.39 | 0.91 | |
| Ne | 1.56 | 1.92 | (1) | 2.3 | |
| Mg | 1.37 | 1.44 | (1) | 2.3 | |
| Si | 1.26 | 1.75 | (1) | 2.7 | |
| ( cm-3s) | 2.24 | 2.46 | 54.2 | 1.25 | |
| E.M.444Emission measure EM=dV in the unit of , where and are number densities of electrons and protons, respectively and V is the X-ray-emitting volume. | 5.8 | 4.6 | 89.3 | 0.59 | |
| VNEI | (keV) | - | - | 0.84 | - |
| Ne | - | - | 2.38 | - | |
| Mg | - | - | 1.55 | - | |
| Si | - | - | 2.39 | - | |
| ( cm-3s) | - | - | 1.68 | - | |
| E.M. | - | - | 1.8 | - | |
| /d.o.f. | 619.2/380=1.63 | 590.2/338=1.75 | 349.6/321=1.09 | 202.7/185=1.09 |