Event-by-event study of neutron observables in spontaneous and thermal fission
Abstract
The event-by-event fission model is extended to spontaneous fission of actinides and a variety of neutron observables are studied for spontaneous fission and fission induced by thermal neutrons with a view towards possible applications for detection of special nuclear materials.
I Introduction
Phenomenological studies of nuclear fission are of particular interest for possible practical applications in the fields of nonproliferation and security. In particular, the detection of special nuclear material (SNM) has risen in priority. To better exploit all means of SNM detection, new efforts are underway to improve neutron detection technology, especially for the study of fast fission neutrons from nuclear material. Since all SNM emits neutrons, it is advantageous to use these neutron emissions for the detection of such material. For example, in highly enriched samples of plutonium (90% 239Pu, 10% 240Pu) and uranium (90% 235U, 10% 238U), the small content of 240Pu and 238U undergoes spontaneous fission, emitting on average two neutrons per fission. If it were possible to employ observable differences in the characteristics of the fission process between the two components of the material, it might be possible to distinguish between enriched and non-enriched samples of SNM.
Being of a penetrating nature, neutrons may provide specific signatures of SNM and thus have intrinsic benefits over other observables. Their long attentuation lengths imply that they can propagate further through shielding material than photons emitted by fission. Unfortunately their low cross sections in material constitute a natural drawback to neutron-based detection methods: the longer time required to obtain a clear measurement and the large solid angle necessary for detectors to subtend to collect as many neutrons as possible AdamB .
The neutron background is relatively low, especially for prompt fission neutrons, emitted by the fragments directly after fission. The dominant ambient neutron background to fission neutrons is from cosmic rays. Neutron emission is thus a fairly unique signature of fissile material. Unfortunately, measurements of the neutron energy spectra alone are not particularly useful for determining the isotopic content of a sample material. Interactions in matter, particularly through a shielding material, shifts the scattered neutrons to lower energy, causing the yield of energetic fission neutrons to be reduced by several orders of magntiude relative to the peak of the distribution. Nevertheless, it is advantageous to study these neutrons using new fast-response detection systems because fast neutrons preserve their direction better than thermal neutrons and can thus be used in SNM detection schemes involving correlated observables AdamB . The present paper addresses such signatures of fission.
Heretofore, most fission simulations have assumed that all emitted neutrons are drawn from the same energy spectrum which precludes correlations between the neutron mutliplicity and the associated spectral shape. In our event-by-event treatment, such inherent correlations are automatically included and we examine them with an eye toward specific applications. Our approach employs the fission model (Fission Reaction Event Yield Algorithm) which incorporates the relevant physics with a few key parameters determined by comparison to data VRPY ; RV ; VRBDO . It simulates the entire fission process and produces complete fission events with full kinematic information on the emerging fission products and the emitted neutrons and photons, incorporating sequential neutron evaporation from the fission fragments. (We will examine prompt fission photon production in a later publication.) provides a means of using readily-measured observables to improve our understanding of the fission process and it is, therefore, a potentially powerful tool for bridging the gap between current microscopic models and important fission observables and for improving estimates of the fission characteristics important for applications.
We compare and contrast correlations between neutron observables in spontaneous and thermal fission of 240Pu, 240Pu(sf) and 239Pu(nth,f) respectively, as well as between 238U(sf) and 235U(nth,f). We also study these observables in the spontaneous fission of 252Cf, often used as a calibrator for other fission measurements, and 244Cm.
In the next section, we describe the experimental data employed, in particular the fission fragment mass distributions and the total fragment kinetic energy as a function of fragment mass. We then discuss various neutron observables, including the prompt fission neutron multiplicity as function of fragment mass, the neutron multiplicity distribution, and the energy spectrum of the prompt fission neutrons. We also study the neutron-neutron angular correlations as well as the correlations between both the total kinetic energy of the fission products and their residual excitation energy as a function of the total neutron multiplicity. We finally discuss potential ways to exploit these correlations and conclude with some final remarks.
II Mass and charge partition
The treatment of spontaneous fission in is similar to that of neutron-induced fission, except for the simplification that there is no possibility for any pre-fission emission. Thus, generally, we start with a fissile nucleus having a specified excitation energy , and let it undergo binary fission into a heavy fragment and a complementary light fragment . The fragment masses are obtained from experimental mass yields by the procedure employed in the original description of RV .
The fragment mass yields, , are assumed to exhibit three distinct modes of Gaussian form g-fit ,
| (1) |
The first two terms represent asymmetric fission modes associated with the spherical shell closure at and the deformed shell closure at , respectively, while the last term represents a broad symmetric mode. The symmetric mode is relatively insignificant for spontaneous fission which is at rather low nuclear excitation. The exception is 252Cf with a comparatively large symmetric contribution.
The asymmetric modes have a two-Gaussian form,
| (2) |
while the symmetric mode is given by a single Gaussian
| (3) |
with . Since each event leads to two fragments, the yields are normalized so that . Thus,
| (4) |
apart from a negligible correction because is discrete and bounded from both below and above.
The results are shown for the fission fragment and the subsequent product yields in Figs. 1-3. The yields reported for spontaneous fission are for the (primary) fragments while those reported for inducd fission are for the (post-evaporation) products EnglandRider . The modeling of the fission fragment yields for neutron-induced fission over a range of incident neutron energies is discussed in Ref. VRBDO . The product yields are obtained after has finished emitting neutrons from the excited fragments. All the yields exhibit similar behavior, a rather broad double-humped distribution with a gap near symmetry, . The symmetric contribution is typically very small.
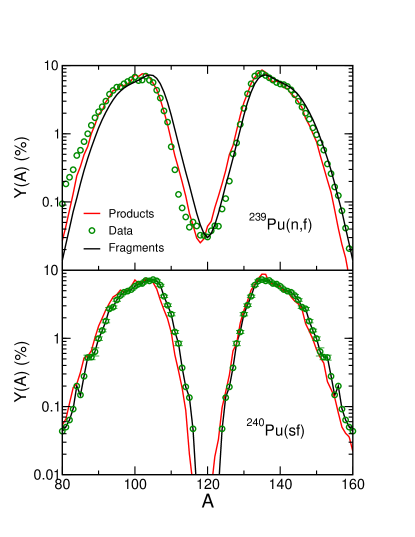
The results in Fig. 1 are most closely related because both 239Pu(nth,f) and 240Pu(sf) start from a compound nucleus with the same value of . The 240Pu(sf) data were taken from a study of 238,240,242Pu(sf) relative to 239Pu(nth,f) SchillebeeckxPusf . The experiment was set up next to a reactor so that 239Pu(nth,f) could be used as a calibrator, with a large acceptance geometry to partially compensate for the low rate of spontaneous fission. (The highest collected total number of spontaneous fission events, about 12000 for 240Pu(sf), was a factor of about 200 below the number of thermal neutron-induced events.) The somewhat larger widths of the mass distributions resulting from thermal neutron-induced fission were attributed to increased intrinsic excitation energy near the scission point SchillebeeckxPusf .
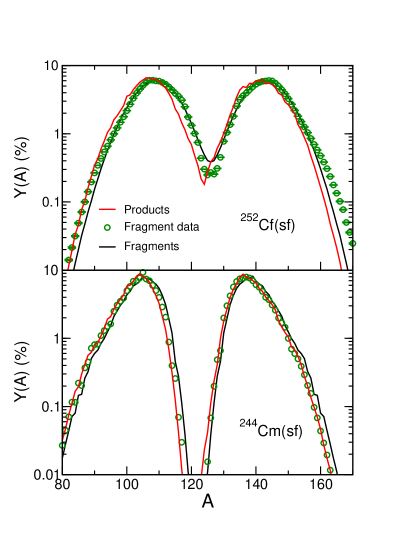
The 252Cf(sf) fragment yields, shown in the upper panel of Fig. 2, result from an analysis of events HambschCf . The experiment focused on the far asymmetric mass region and showed that the enhancements in the yields observed previously were due to the choice of angular selection criteria. Choosing eliminated events where energy loss in the foil is large. We choose these results for use in , even though our focus is not on the far-asymmetric region, because the large sample size provides more accurate input. The 252Cf(sf) yields were also measured with 244Cm(sf) in Ref. SchmidtCmTKE , albeit with fewer statistics, 252Cf fissions and 71000 244Cm fissions. The 244Cm fragment mass distributions and average fragment masses reported in Ref. SchmidtCmTKE are in good agreement with previous measurements, thus we can accept their reported yields with some confidence.
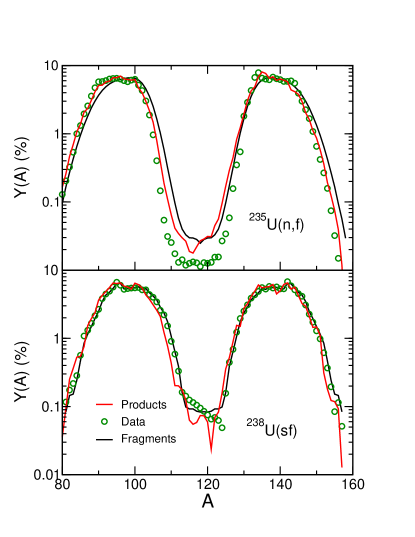
The 238U(sf) yield data in Fig. 3 was obtained from a uranium sample with a natural isotopic composition, i.e. with a small admixture of 235U IvanovUsf . A 252Cf(sf) neutron source was placed outside a double ionization chamber to provide thermal neutrons and thus allow comparison of the fission characteristics of 238U(sf) with 235U(nth,f). The double ionization chamber allowed measurements of the yields and kinetic energies of the two fission fragments in coincidence. They corrected for energy loss in the backing material and excluded angles greater than 60∘ to eliminate events where the fragments passed through more material, necessitating a larger correction for energy loss in matter. The results shown here are based on 2800 fission events. They noted more fine structure in 238U(sf) than in thermal neutron-induced fission of 235U. The yield at is very poorly determined IvanovUsf . Unfortunately, no other 238U(sf) data were found for comparison.
In all cases, the locations of the asymmetric peaks in the data are similar while there appears to be a clearer separation of the asymmetric peaks at symmetry for the spontaneously fissioning nuclei. The asymmetric Gaussians also appear to be somewhat narrower in the case of spontaneous fission with the exception of 252Cf, as shown in Fig. 2. In this case, the tails of the asymmetric distributions shown are quite broad so the dip at symmetry is filled in to a considerable degree, even relative to neutron-induced fission.
A clear shift between the fragment yields (before neutron emission) and the product yields (after neutron emission) is apparent in all cases. The magnitude of the shift depends on the overall mean neutron multiplicity, , which in turn depends on the partition of the excitation energy between the light and heavy fragments. The shift is not symmetric but is larger for the light fragment, especially near symmetry. The location of the peak in the heavy fragment yield at does not exhibit a significant shift due to neutron emission in any of the cases shown, even though the shift is apparent for other values of . This is due to the proximity of the doubly-magic closed shell with and . This behavior is also apparent in the shape of TKE() and in the dependence of the mean neutron multiplicity on fragment mass, , as will be discussed later.
The fragment charge, , is selected subsequently. For this we follow Ref. ReisdorfNPA177 and employ a Gaussian form,
| (5) |
with the condition that . The centroid is determined by requiring that the fragments have, on average, the same charge-to-mass ratio as the fissioning nucleus, . The dispersion is the measured value, ReisdorfNPA177 . The charge of the complementary fragment then follows using .
III Fragment energies
Once the partition of the total mass and charge among the two fragments has been selected, the value associated with that particular fission channel follows as the difference between the total mass of the fissioning nucleus and the ground-state masses of the two fragments,
| (6) |
takes the required nuclear ground-state masses from the compilation by Audi et al. Audi , supplemented by the calculated masses of Möller et al. MNMS when no data are available. The value for the selected fission channel is then divided up between the total kinetic energy (TKE) and the total excitation energy (TXE) of the two fragments.
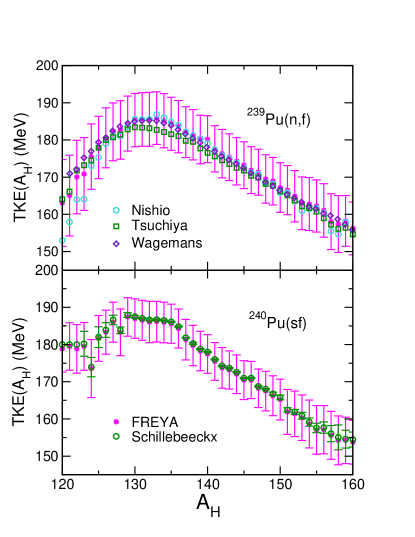
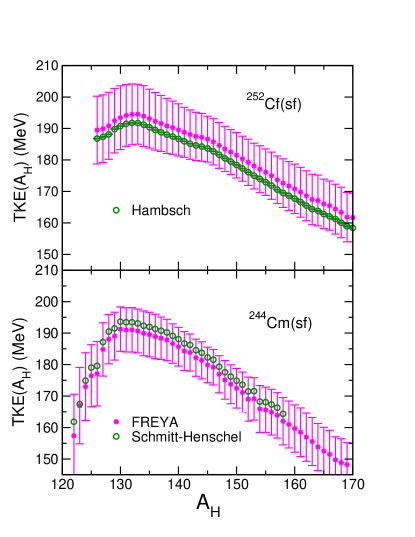
Figures 4-6 show the measured average TKE value as a function of the mass number of the heavy fragment, . Near symmetry, the plutonium fission fragments are mid-shell nuclei subject to strong deformations. Thus the scission configuration will contain significant deformation energy and the TKE will be correspondingly low. At , the heavy fragment is close to the doubly-magic closed shell having and and is therefore resistant to distortions away from sphericity. Consequently, the scission configuration is fairly compact, causing the TKE to exhibit a maximum even though the complementary light fragment is far from a closed shell and hence significantly deformed. Note that the peak around is a feature of all the data sets shown, regardless of whether fission is neutron induced or spontaneous and independent of the identity of the fissile nucleus.
The 239Pu(nth,f) data sets in the top panel of Fig. 4 are very consistent for , above the closed shell at . In this region and below, the agreement among the data sets is not as good, particularly near the symmetry value of , presumably due to the low fragment yields in this region. Unfortunately, no uncertainties are given on the data, only the full-width half maximum spread of TKE for several given values of in the measurment of Nishio et al. NishioPu . This variance is similar to that shown for . The 240Pu(sf) data by Schillebeeckx et al. SchillebeeckxPusf are somewhat flatter in the region of the closed shell. Unfortunately there are considerable fluctuations in the data for and TKE()was not measured for . We have therefore extrapolated a constant average value back to .
The 252Cf(sf) data in Fig. 5 are again taken from Ref. HambschCf with . The high statistics of this measurement result in small experimental uncertainties and smooth behavior of TKE. There is more uncertainty in the lower statistics 244Cm(sf) data from Ref. SchmidtCmTKE . Indeed, a comparison of earlier measurements in that work showed that although the average fragment masses were consistent, the average TKE of 244Cm(sf) varied by 4% among measurements, depending on the measurement techniques as well as the choice of calibrators (either 252Cf(sf) or 235U(nth,f)). The results shown in the bottom half of Fig. 5 agree with the highest reported energy and indeed are MeV higher than those reported from 252Cf(sf) SchmidtCmTKE . No more recent results on 244Cm(sf) are available.
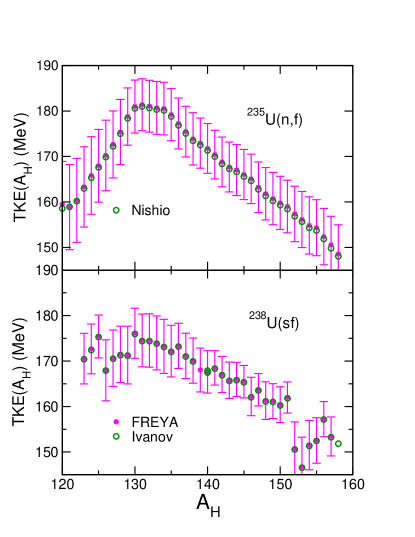
There are significant fluctuations in the 238U(sf) data IvanovUsf in Fig. 6 which can be attributed to the rather low statistics of this measurement. We note that the data in Ref. IvanovUsf were presented as a function of the light fragment mass instead of the heavy. The distribution shown here is obtained by reflection. We note also that the symmetry region is rather poorly measured with points missing around . The remaining data are at values of TKE below the lower limit of the plot. Perhaps some of the fluctuations in TKE can be attributed to the ‘fine structure’ noted in the yields in Ref. IvanovUsf . They also noted that their measured average TKE was on average 3 MeV lower than their calibrated result for thermal neutron-induced fission of 235U.
We assume the average TKE values take the form
| (7) |
The first term on the right-hand side of Eq. (7) is extracted from the data shown in Figs. 4-6, while the second term is a parameter adjusted to ensure reproduction of the measured average neutron multiplicity, . In each particular event, the actual TKE value is then obtained by adding a thermal fluctuation to the above average, as explained later.
Figures 4-6 include the average TKE values calculated with at thermal energies for neutron-induced fission and for spontaneous fission, together with the associated dispersions. Thus the bars associated with the calculations are not sampling errors but indicate the actual width of the TKE distribution for each .
IV Neutron emission
Once the average total fragment kinetic energy has been obtained, the average combined excitation energy in the two fragments follows by energy conservation,
| (8) |
The first relation indicates that the total excitation energy is partitioned between the two fragments. As is common, we assume that the fragment level densities are of the form , where is the effective statistical energy in the fragment and is the level-density parameter. We follow the prescription of Ref. VRBDO with the value of the asymptotic level density parameter obtained from the 239Pu evaluation, assuming it to be universal.
If the two fragments are in mutual thermal equilibrium, , the total excitation energy will be proportional to the level-density parameters, i.e. . therefore first assigns tentative average excitations based on such an equipartition,
| (9) |
where . Subsequently, because the observed neutron multiplicities suggest that the light fragments tends to be disproportionately excited, the average values are adjusted in favor of the light fragment,
| (10) |
where is an adjustable model parameter expected be larger than unity.
After the mean excitation energies have been assigned, considers the effect of thermal fluctuations. The fragment temperature is obtained from and the associated variance in the excitation is taken as , where in the simple (unshifted) scenario.
Therefore, for each of the two fragments, we sample a thermal energy fluctuation from a normal distribution of variance and modify the fragment excitations accordingly, so that
| (11) |
Due to energy conservation, there is a compensating opposite fluctuation in the total kinetic energy VRBDO . The corresponding dispersions are included in Figs. 4-6.
IV.1 Temperature distributions
assumes that the (fully accelerated) fission fragments first deexcite by (possibly sequential) neutron evaporation, followed by sequential photon emission. At each stage in the decay chain, the spectral shape of the ejectile is determined by the maximum temperature in the daughter nucleus, which in turn is determined by the excitation in the emitting nucleus and the associated -value. Because there are many different -values involved, one for each fragment species, and becaue the excitation in the emitter fluctuates, the maximum temperature in the daughter nucleus displays a non-trivial distribution.
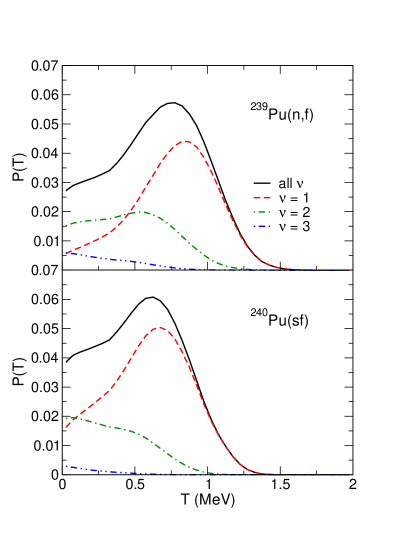
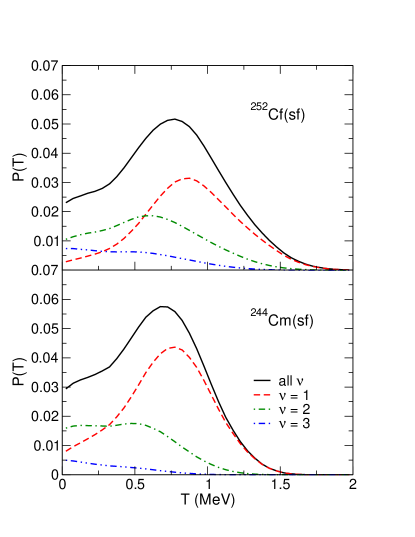
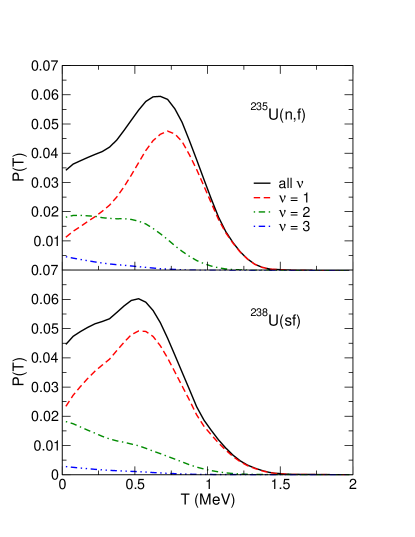
The distributions of the maximum temperature in the evaporation daughter, granddaughter, and great granddaughter nuclei are shown in Figs. 7-9 for the various cases under study. The maximum temperature in the daughter nuclei (=1) is fairly well peaked at around 0.5-0.8 MeV; the larger contribution comes from the light fragment which tends to be hotter than its heavy partner. The temperature distributions in the granddaughter nuclei (=2) are considerably broader and peak at lower energies, In the case of the great-granddaughters (=3) the distributions decrease monotonically. For spontaneous fission of 240Pu and 238U, where the average total neutron multiplicity is only is 2.15 and 2.0, respectively, it is most likely that each fragment emits just a single neutron so the probability that a fragment emits three neutrons is rather small, and the probability for further neutron emission is, in most cases, too small to be visible on the plot, though such events do contribute to the overall distribution near zero.
The induced fission processes 239Pu(nth,f) and 235U(nth,f) lead to higher daughter temperatures than the spontaneous processes 240Pu(sf) and 238U(sf) and they also yield larger multiplicities. Thus for 239Pu(nth,f) relative to 2.15 for 240Pu(sf), and for 235U(nth,f) relative to 2.0 for 238U(sf). Relative to 240Pu(sf) and 238U(sf), spontaneous fission of the heavier actinides, 244Cm and 252Cf, also results in higher daughter temperatures. Indeed is similar for 244Cm(sf) and 239Pu(nth,f), as are the average neutron multiplicities, 2.72 and 2.88, respectively. We note that for 252Cf(sf) the maximum daughter temperature peaks at MeV, which is higher than in all the other cases considered, and the tail extends up to MeV. In addition, the distribution of the maximum temperature in the granddaughter has a distinct peak around MeV, which is not surprising considering that for 252Cf(sf).
In the treatment by Madland and Nix MadlandNix a convenient analytical expression was obtained by assuming that the overall distribution of the maximum daughter temperature has a triangular shape. The results in Figs. 7-9 demonstrate that such an assumption is hardly realistic, even for just .
IV.2 Average neutron multiplicity
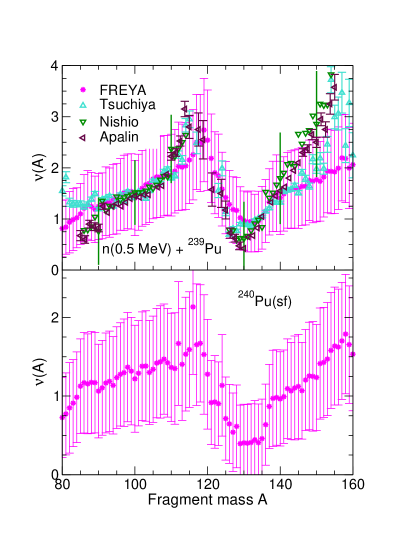
The dependence of the average neutron multiplicity on the fragment mass number , is very sensitive to the division of the excitation energy which is governed by the parameter in Eq. (10). As shown in Figs. 10-12, all the measurements exhibit a characteristic ‘sawtooth’ behavior: the neutron multiplicity from the light fragment increases slowly as approaches and then drops rather sharply to a minimum around , the same location as the maximum of TKE(). Due to the presence of the closed shell at that point, the fragments are particularly resistent to neutron emission. Past the dip region, the multiplicity again increases. The dip tends to be more sharply defined for larger nuclei where is close to 130. For example, the drop is particularly abrupt for 252Cf where . Where data are available, it is seen that the calculations provide a rather good representation of the ‘sawtooth’ behavior of , even though is not tuned to these data.
Although the agreement is generally good, the observed behavior is not perfectly reproduced. The results for 239Pu(nth,f) in Fig. 10 agree very well with the data for with . At higher and lower , although there are deviations, the measurements are within the variance of the results. However, in these regions, as well as near symmetry, the yields are smaller so that larger deviations may be expected. No neutron measurements were made in Ref. SchillebeeckxPusf and we have not located any comparison data for 240Pu(sf); here we use . Below the symmetry point, the slope of is rather small, but it increases more rapidly above . The results display larger fluctuations for this isotope, which may be attributed to the more irregular behavior of TKE. Also note that while the central values of fluctuate more, the variances are the same size as for 239Pu(nth,f) in the top panel and appear exaggerated by the smaller scale of on the -axis for 240Pu(sf).
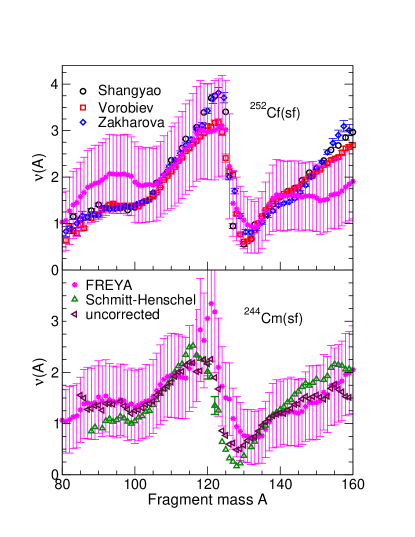
There are numerous measurements of for 252Cf(sf). A sample of some representative, more recent, results are shown in the top part of Fig. 11. The measurements are all very similar with small differences only near , , and . The light fragment data are rather flat and then increase rather quickly for . Above , the slope of is less than that seen for 239Pu(nth,f) in Fig. 10. The results, obtained with , while consistent within the variance of the data, are significantly flatter than the data for and . This behavior, stronger than any of the other results in Figs. 10-12, can be traced to the apparent two-slope behavior of TKE() for 252Cf(sf) in Fig. 5: there is a slow decrease in TKE for with a faster change of TKE with thereafter. It is also consistent with the large widths of the asymmetric fission yields in Fig. 2. We note that changing does not change the slopes of , only the relative magnitudes. To better describe with , it would be necessary to fit rather than employing just a single-valued parameter for .
Data for 244Cm(sf) are shown in the lower panel of Fig. 11. Both data sets shown are from the same experiment SchmidtCmnu . Two results were given in the paper due to the location of the fission source relative to the neutron detector, the corrected version, labeled Schmidt-Henschel, shifts the measured to account for the fact that only some of the neutrons emitted by the fragments will reach the detector. The authors calibrated their correction for 252Cf(sf) by normalizing the position of the sawtooth with to previously published data. The 244Cm(sf) correction was made by scaling the 252Cf shift by the ratio of the total neutron multiplicity in 244Cm relative to 252Cf, presumably because they could not compare their 244Cm results to other measurements of the same system. The authors were rather inconclusive about which results were actually correct since the sum of complementary multiplicities, , did not agree well with the total neutron multiplcity, near . If this disagreement is real, then the correction had the effect of shifting the peak of downward from to . Interestingly, the results, calculated with and treating the motion of both the fragments and the neutrons relativistically, agrees much better with the uncorrected results of Ref. SchmidtCmnu .
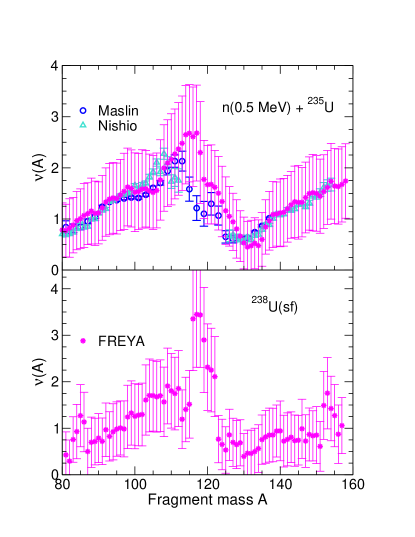
Finally, results are compared to 235U(nth,f) in the top panel of Fig. 12. The values of agree very well with the sawtooth pattern of the data NishioU ; MaslinU with the exception of the symmetric region where the yields are rather low. Indeed, Ref. NishioU does not provide results for in the symmetric region. The results for 238U(sf), calculated with , are shown in the bottom panel of the figure. The shape of the sawtooth appears rather flat for this isotope, likely because of the high obtained near symmetry, reflecting the low TKE reported by Ref. IvanovUsf in Fig. 6.
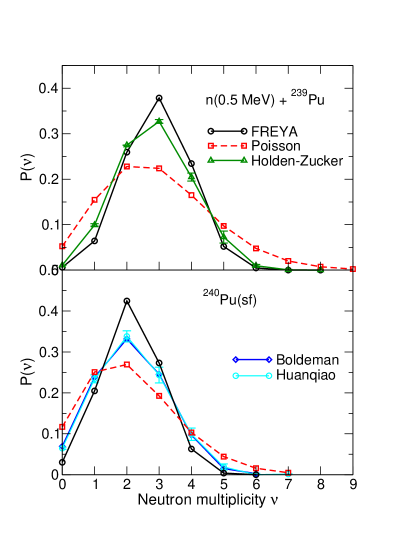
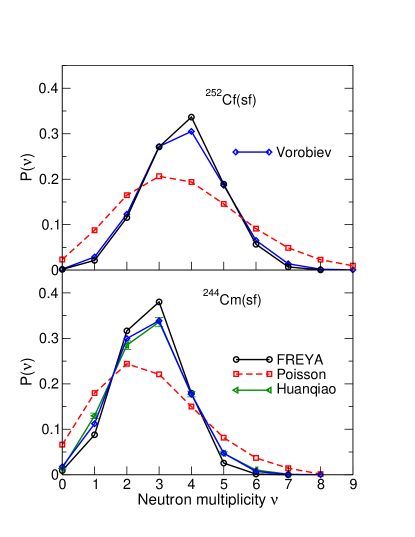
IV.3 Neutron multiplicity distribution
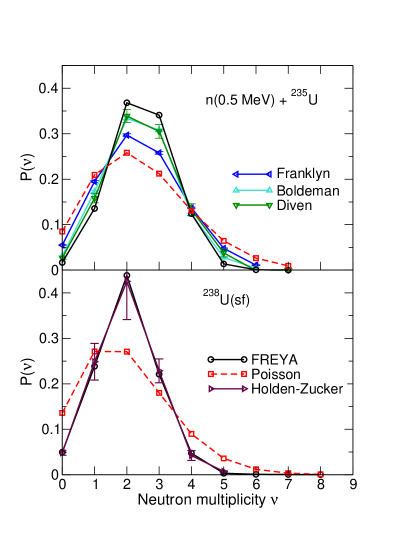
Figures 13-15 show the neutron multiplicity distribution for the various cases considered. Each emitted neutron reduces the excitation energy in the residue by not only its kinetic energy (recall where is the maximum temperature in the daughter nucleus) but also by the separation energy (which is generally significantly larger). Therefore the resulting is narrower than a Poisson distribution with the same average multiplicity, as clearly seen in the figures.
In experiments, the quantity is determined by detecting fission events in a sample of material and correlating these with simultaneous neutron detection. The relative probability for emission of neutrons in given event, , is inferred by combining the calculated probability for observing neutrons when were emitted, , with the detector efficiency determined from the count rate by comparison with a calibration source having a known ; typically 252Cf(sf) is used. Thus, while the value of may be well measured for a given isotope, the distribution is less well determined.
We compare to data in so far as possible. The results labeled ‘Holden-Zucker’ in Figs. 13 for 239Pu(nth,f) and 15 for 238U(sf) are consensus values from a 1985 report by Holden and Zucker Zuckerpofnu . Results from this reference are generally available for the other cases shown here. However, we do not show them if there is good agreement between the data displayed here and in Ref. Zuckerpofnu or if there are more recent data available. In most cases, the agreement is rather good, with the results following the data more closely than the equivalent Poisson distribution.
The largest difference between the calculated multiplicity distributions and the data seems to be for 240Pu(sf), which may be due to the smaller sample of 240Pu(sf) and TKE() data used as input to . By contrast, the agreement of with the 238U(sf) consensus data given in Ref. Zuckerpofnu is remarkable.
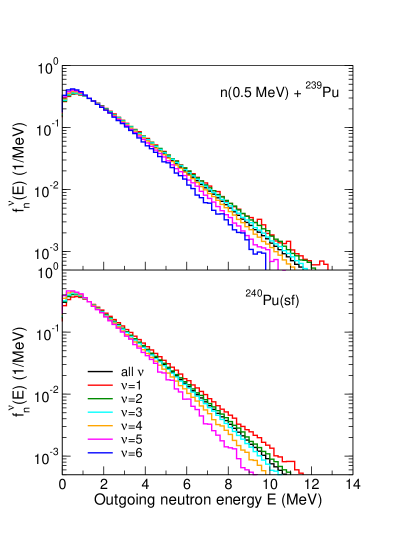
IV.4 Multiplicity-gated neutron spectra
For fisison events having a specified total neutron multiplicity , we define the associated spectral shape,
| (12) |
which is thus normalized to unity, while the corresponding spectral shape of the neutrons from all the fission events irrespective of the associated multiplicity is denoted simply by and is also normalized to unity.
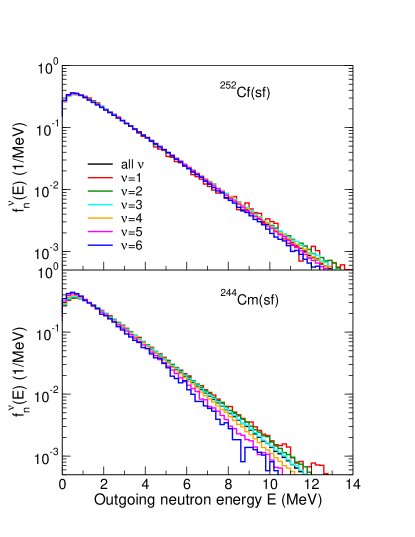
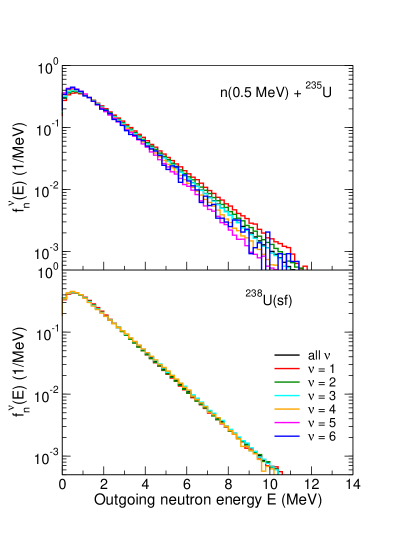
The multiplicity-gated spectral shapes obtained for the various cases considered are shown in Figs. 16-18. Results are presented for multiplicities up to . It is apparent that the spectra become progressively softer at higher multiplicities, as one would expect because more neutrons are sharing the available energy. This type of elementary conservation-based correlation feature is not provided by the standard models of fission.
The tails of the prompt fission neutron spectra from 240Pu(sf) are longer and broader than those from 239Pu(nth,f) even though the average energies are smaller and fewer neutrons are emitted. The opposite is the case for 238U(sf) and 235U(nth,f) since the spectra from 238U(sf) are closely clustered around the mean. The most energetic neutrons at high multiplicity are emitted from 252Cf(sf) where the spectra are also rather closely clustered around the mean. The spectral shapes and average energies of 244Cm(sf)are rather similar to 239Pu(nth,f).
Table 1 shows the mean kinetic energy of neutrons emitted from the two fragments as a function of the neutron multiplicity. The averages are shown for multiplicities with event samples large enough to prevent the results from being skewed by fluctuations. The largest average energies are seen for 252Cf(sf) with similar results for 239Pu(nth,f) and 244Cm(sf), not surprising given the temperature profiles seen in Figs. 7-9. The variances are on the same order as the averages, albeit somewhat smaller, in most cases.
| (MeV) | (MeV) | (MeV) | (MeV) | |
| n | 240Pu(sf) | |||
| all | 2.06 | 1.68 | 1.86 | 1.52 |
| 1 | 2.16 | 1.78 | 2.03 | 1.64 |
| 2 | 2.14 | 1.76 | 1.90 | 1.56 |
| 3 | 2.09 | 1.71 | 1.83 | 1.49 |
| 4 | 2.01 | 1.64 | 1.73 | 1.41 |
| 5 | 1.92 | 1.56 | 1.64 | 1.31 |
| 6 | 1.84 | 1.48 | 1.52 | 1.19 |
| 252Cf(sf) | 244Cm(sf) | |||
| all | 2.23 | 1.88 | 2.03 | 1.68 |
| 1 | 2.21 | 1.87 | 2.13 | 1.77 |
| 2 | 2.24 | 1.91 | 2.10 | 1.73 |
| 3 | 2.25 | 1.90 | 2.05 | 1.69 |
| 4 | 2.24 | 1.88 | 1.98 | 1.62 |
| 5 | 2.21 | 1.86 | 1.89 | 1.55 |
| 6 | 2.18 | 1.82 | 1.81 | 1.50 |
| 7 | 2.14 | 1.78 | - | - |
| 8 | 2.06 | 1.70 | - | - |
| n | 238U(sf) | |||
| all | 1.92 | 1.59 | 1.76 | 1.46 |
| 1 | 2.08 | 1.71 | 1.76 | 1.44 |
| 2 | 1.98 | 1.58 | 1.74 | 1.45 |
| 3 | 1.92 | 1.50 | 1.77 | 1.47 |
| 4 | 1.83 | 1.45 | 1.76 | 1.46 |
| 5 | 1.76 | 1.46 | - | - |
IV.5 Neutron-neutron angular correlations
The event-by-event nature of makes it straightforward to extract the angular correlation between two evaporated neutrons, an observable that has long been of experimental interest (see, for example, Refs. DeBenedettiPR74 ; FranklynU ; GagarskiBRAS72 and references therein) but which cannot be addressed with the standard models of fission.
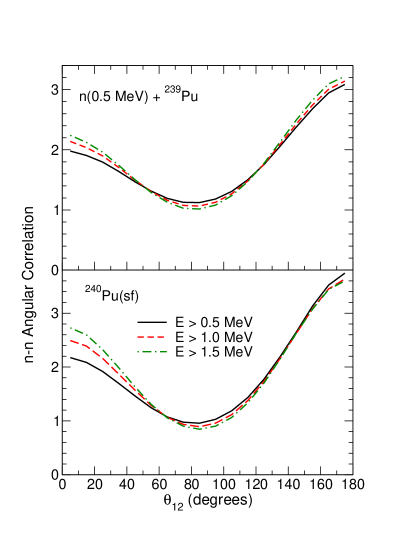
Figures 19-21 show this quantity for the neutrons resulting from fission induced by thermal neutrons on 235U and 239Pu as well as neutron correlations in spontaneous fission. The results are shown for neutrons with kinetic energies above thresholds at , 1 and 1.5 MeV. The angular modulation grows somewhat more pronounced as the threshold is raised (while the statistics are correspondingly reduced).
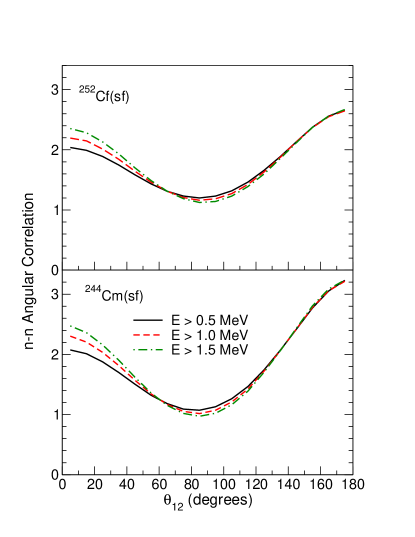
The neutrons tend to be either forward or backward correlated. The backward correlation appears to be somewhat favored. While not shown, we have previously analyzed the case of 239Pu(nth,f) for , breaking it down to three separate contributions: both neutrons from the light fragment, both from the heavy fragment, and one neutron emitted from each fragment Sinaiaproc . There is a significant correlation at when both neutrons are emitted from the same fragment, with a higher peak for the case when both neutrons are emitted from the light fragment due to its higher velocity. On the other hand, when one neutron is emitted from each fragment, their direction tends to be anti-correlated due to the relative motion of the emitting fragments, resulting in a peak at . The overall result is a stronger backward correlation because emission from both fragments is most likely.
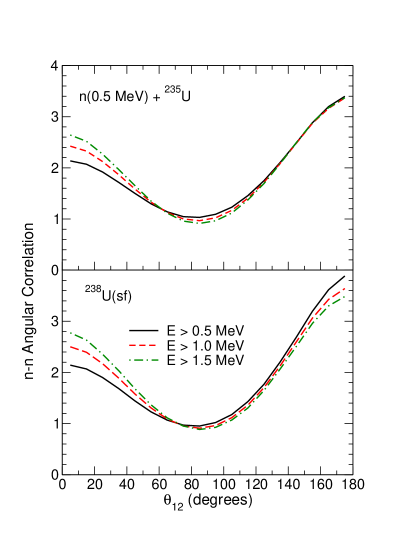
The backward correlation is strongest when the overall neutron multiplicity is low, especially for 240Pu(sf) and 238U(sf), whereas large multiplicities, as for 252Cf(sf) and 244Cm(sf), reduce the angular correlation.
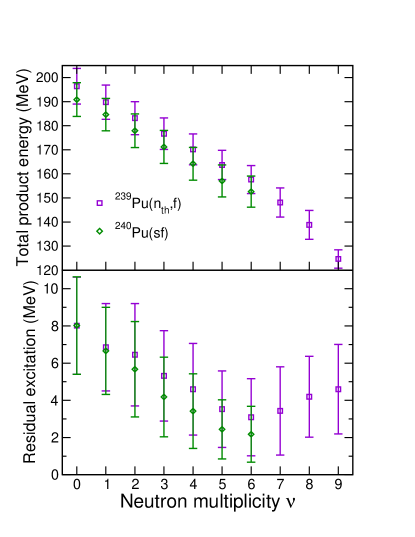
IV.6 Correlations between product energies and neutron multiplicity
The combined kinetic energy of the two resulting (post-evaporation) product nuclei is shown as a function of the neutron multiplicity in the top panels of Figs. 22-24. It decreases with increasing multiplicity, as one might expect on the grounds that the emission of more neutrons tends to carry off more initial excitation energy, thus leaving less available for the products. As expected from the behavior of , the combined product kinetic energy is largest for the most massive fission systems (252Cf and 244Cm) and lowest for the least massive (235U and 238U).
The bottom panels of Figs. 22-24 show the neutron multiplicity dependence of the average residual excitation energy in those post-evaporation product nuclei. Because this energy is available for subsequent photon emission, one may expect that the resulting photon multiplicity would display a qualitatively similar behavior and thus, in particular, be anti-correlated with the neutron multiplicity.
There is little sensitivity of the residual excitation to the identity of the fissioning nucleus in any of the cases presented. This result shows that the energies left over after prompt neutron emission are not strongly dependent on the initial fragment temperature.
V Applications
We have so far shown that there are characteristic correlations between the emitted neutrons that depend on relative angle, energy and multiplicity. To best take advantage of these correlations, fast response detector systems are desirable. Such systems can better exploit these correlations which would be washed out in slow response detectors and detection systems based on moderators. Scintillator detectors can distinguish between neutrons and photons with good background rejection. They are also amenable to scaling to larger solid angle coverage. Threshold detectors that gate on higher-energy prompt neutron emission can be readily used to study angular-energy or multiplicity-energy correlations AdamB .
As we have shown in Figs. 19-21, the neutron-neutron angular correlations can distinguish between configurations where both neutrons are emitted from a single fragment or one neutron is emitted from each fragment. This correlation will become stronger with neutron energy, particularly for 240Pu(sf) and 238U(sf) where the mean neutron multiplicity is rather low and the emitted spectra are softer. Such evident directionality could improve background rejection of neutrons from cosmogenic sources. Comparison of correlations in admixtures of plutonium or uranium isotopes could reveal the degree to which the material is enriched.
Figures 16-18 clearly show the difference in the spectral shapes for specified neutron multiplicities. The slope of the spectral shape increases with neutron multiplicity so, for example, there are fewer energetic neutrons for than for . Again the difference in the spectral distributions gated on neutron multiplicity in neutron-induced fission relative to spontaneous fission in the same sample of material could be exploited by fast detector systems, providing an additional means of determining the isotopic content of the material.
For experimental groups to better explore the possible correlation studies available with , we are providing a version to work in-line with several larger Monte Carlo codes, including MCNP . More details about the in-line version of will be discussed in the future.
VI Concluding remarks
We have shown that event-by-event models of fission, such as , provide a powerful tool for studying fission neutron correlations. Our results demonstrate that these correlations are significant and exhibit a dependence on the fissioning nucleus.
Since our method is phenomenological in nature, good input data are especially important. Some of the measurements employed in are rather old and statistics limited. It would be useful to repeat some of these studies with modern detector techniques. In addition, most experiments made to date have not made simultaneous measurements of the fission products and the prompt observables, such as neutrons and photons. Such data, while obviously more challenging to obtain, would be valauble for achieving a more complete understanding of the fission process.
Acknowledgements
We wish to acknowledge helpful discussions with A. Bernstein, D.A. Brown, and C. Hagmann. This work was supported by the Office of Nuclear Physics in the U.S. Department of Energy’s Office of Science under Contracts No. DE-AC02-05CH11231 (JR) and DE-AC52-07NA27344 (RV) and by the National Science Foundation, Grant NSF PHY-0555660 (RV). This research is also supported by the US Department of Energy National Nuclear Security Administration Office of Nonproliferation and Verification Research and Development.
![[Uncaptioned image]](/html/1109.3788/assets/x23.png)
FIG. 23: (Color online) The total product kinetic energy (top) and residual excitation energy (bottom) remaining after neutron emission has ceased as a function of neutron multiplicity. The results are shown for spontaneous fission of 244Cm (squares) and 252Cf (diamonds).
![[Uncaptioned image]](/html/1109.3788/assets/x24.png)
FIG. 24: (Color online) The total product kinetic energy (top) and residual excitation energy (bottom) remaining after neutron emission has ceased as a function of neutron multiplicity. The results are shown for 235U(nth,f) (squares) and 238U(sf) (diamonds).
References
- (1) R. C. Runkle, A. Bernstein and P. E. Vanier, J. Applied Phys. 108, 111101 (2010).
- (2) R. Vogt, J. Randrup, J. Pruet and W. Younes, Phys. Rev. C 80, 044611 (2009).
- (3) J. Randrup and R. Vogt, Phys. Rev. C 80, 024601 (2009) [arXiv:0906.1250 [nucl-th]].
- (4) R. Vogt, J. Randrup, D. A. Brown, M. A. Descalle and W. E. Ormand, submitted to Phys. Rev. C.
- (5) S. Lemaire, P. Talou, T. Kawano, M. B. Chadwick, and D. G. Madland, Phys. Rev. C 72, 024601 (2005).
- (6) M. B. Chadwick et al., Nucl. Data Sheets 107 (2006) 2931.
- (7) W. Younes et al., Phys. Rev. C 64, 054613 (2001).
- (8) T. R. England and B. F. Rider, LA-UR-94-3106 (1994).
- (9) W. Reisdorf, J. P. Unik, H. C. Griffin, and L. E. Glendenin, Nucl. Phys. A 177, 337 (1971).
- (10) G. Audi and A. H. Wapstra, Nucl. Phys. A 595, 409 (1995).
- (11) P. Möller, J. R. Nix, W. D. Myers, and W. J. Swiatecki, At. Data Nucl. Data Tab. 59, 185 (1995).
- (12) P. Schillebeeckx, C. Wagemans, A. J. Deruytter and R. Barthelemy, Nucl. Phys. A 545, 623 (1992).
- (13) F.-J. Hambsch and S. Oberstedt, Nucl. Phys. A 617, 347 (1997).
- (14) R. Schmidt and H. Henschel, Nucl. Phys. A 395, 15 (1983).
- (15) M. P. Ivanov, G. M. Ter-akopian, B. V. Fefilov and A. S. Voronin, Nucl. Inst. Meth. A 234, 152 (1985).
- (16) D. G. Madland and J. R. Nix, Nucl. Sci. Eng. 81, 213 (1982).
- (17) K. Nishio, Y. Nakagome, I. Kanno, and I. Kimura, J. Nucl. Sci. Technol. 32, 404 (1995).
- (18) C. Tsuchiya, Y. Nakagome, H. Yamana, H. Moriyama, K. Nishio, I. Kanno, K. Shin, and I. Kimura, J. Nucl. Sci. Technol. 37, 941 (2000).
- (19) C. Wagemans, E. Allaert, A. Deruytter, R. Barthélémy, and P. Schillebeeckx, Phys. Rev. C 30, 218 (1984).
- (20) K. Nishio, Y. Nakagome, H. Yamamoto and I. Kimura, Nucl. Phys. A 632, 540 (1998).
- (21) V. F Apalin, Yu. N. Gritsyuk, I. E. Kutikov, V. I. Lebedev, and L. A. Mikaelian, Nucl. Phys. A 71, 553 (1965).
- (22) R. Schmidt and H. Henschel, Nucl. Phys. A 395, 29 (1983).
- (23) D. Shengyao, X. Jincheng, L. Zuhua, L. Shaoming, and Z. Huanqiao, Chin. Phys. 4, 649 (1984).
- (24) V. N. Dushin, F. J. Hambsch, V. A. Yakovlev, V. A. Kalinin, I. S. Kraev, A. B. Laptev, D. V. Nikolav, B. F. Petrov, G. A. Petrov, V. I. Petrova, Y. S. Pleva, O. A. Shcherbakov, V. I. Shpakov, V. E. Sokolov, A. S. Vorobiev, T. A. Zavarukhina, Nucl. Instrum. Meth. A 516, 539 (2004).
- (25) V. P. Zakharova, D. K. Ryazanov, B. G. Basova, A. D. Rabinovich, V. A. Korostylev, Sov. J. Nucl. Phys., 30, 19 (1979).
- (26) E. E. Maslin and A. L. Rodgers, Phys. Rev. 164, 1520 (1967).
- (27) N. E. Holden and M. S. Zucker, “A Reevaluation of the Average Prompt Neutron Emission Multiplicity ) Values from Fission of Uranium and Transuranium Nuclides”, BNL-NCS-35513, Brookhaven National Laboratory (1985).
- (28) Z. Huanqiao, L. Zuhua, D. Shengyao and L. Shaoming, Nucl. Sci. Eng. 86, 315 (1984).
-
(29)
J. W. Boldeman, Second Conference on Neutron Physics, 4, 114
(1973);
http://www-nds.iaea.org/exfor/servlet/X4sGetSubent?subID=30376006. - (30) H. R. Bowman, J. C. D. Milton, S. G. Thompson, and W. J. Swiatecki, Phys. Rev. 126, 2120 (1962); Phys. Rev. 129, 2133 (1963).
-
(31)
A. S. Vorobiev, V. N. Dushin, F. J. Hambsch, V.A. Yakovlev,
V. A. Kalinin, I. S. Kraev, A.B. Laptev, B.F. Petrov, G. A. Petrov,
Yu. S. Pleva, O.A. Shcherbakov and V. E. Sokolov,
http://www-nds.iaea.org/exfor/servlet/X4sGetSubent?subID=41425004. -
(32)
A. S. Vorobiev, V. N. Dushin, F. J. Hambsch, V. A. Yakovlev,
V. A. Kalinin, I. S. Kraev, A. B. Laptev, B. F. Petrov, G. A. Petrov,
Yu. S. Pleva, O. A. Shcherbakov and V. E. Sokolov,
http://www-nds.iaea.org/exfor/servlet/X4sGetSubent?subID=41425002. - (33) C. B. Franklyn, C. Hofmeyer, and D. W. Mingay, Phys. Lett. B 78, 564 (1978).
- (34) J. W. Boldeman, A. R. de L. Musgrove and R. L. Walsh, Aust. J. Phys. 24, 821 (1971).
- (35) B. C. Diven, H. C. Martin, R. F. Taschek and J. Terrell, Phys. Rev. 101, 1012 (1956).
- (36) S. DeBenedetti, J. E. Francis, Jr., W. M. Preston, and T. W. Bonner, Phys. Rev. 74, 1645 (1948).
- (37) A. M. Gagarski et al., Bull. Russ. Acad. Sciences: Physics, 72, 773 (2008).
- (38) J. Randrup and R. Vogt, JRC Scientific and Technical Reports 64789, 115 (2011).
- (39) F. B. Brown et al., Trans. Am. Nucl. Soc. 87, 273 (2002).