The origin of metals in the circumgalactic medium of massive galaxies at
Abstract
We present a detailed study of the metal-enriched circumgalactic medium (CGM) of a massive galaxy at using results from “ErisMC”, a new cosmological hydrodynamic “zoom-in” simulation of a disk galaxy with mass comparable to the Milky Way. The reference run adopts a blastwave scheme for supernova feedback that generates galactic outflows without explicit wind particles, a star formation recipe based on a high gas density threshold, and high temperature metal cooling. ErisMC main progenitor at resembles a “Lyman break” galaxy of total mass , virial radius kpc, and star formation rate , and its metal-enriched CGM extends as far as 200 (physical) kpc from its center. Approximately 41%, 9%, and 50% of all gas-phase metals at are locked in a hot ( K), warm ( K), and cold ( K) medium, respectively. We identify three sources of heavy elements: 1) the main host, responsible for 60% of all the metals found within ; 2) its satellite progenitors, which shed their metals before and during infall, and are responsible for 28% of all the metals within , and for only 5% of those beyond ; and nearby dwarfs, which give origin to 12% of all the metals within and 95% of those beyond . Late () galactic “superwinds” – the result of recent star formation in ErisMC – account for only 9% of all the metals observed beyond , the bulk having been released at redshifts by early star formation and outflows. In the CGM, lower overdensities are typically enriched by ‘older’, colder metals. Heavy elements are accreted onto ErisMC along filaments via low-metallicity cold inflows, and are ejected hot via galactic outflows at a few hundred . The outflow mass-loading factor is of order unity for the main halo, but can exceed a value of 10 for nearby dwarfs. We stress that our “zoom-in” simulation focuses on the CGM of a single massive system and cannot describe the enrichment history of the intergalactic medium as a whole by a population of galaxies with different masses and star formation histories.
Subject headings:
galaxies: evolution – galaxies: high-redshift – intergalactic medium – method: numerical1. Introduction
Studies of the ionization, thermodynamic, and kinematic state of heavy elements in circumgalactic gas hold clues to understanding the exchange of mass, metals, and energy between galaxies and their surroundings. The distribution of observed metals in the intergalactic medium (IGM) is highly inhomogeneous, with a global cosmic abundance at of [C/H] for gas with overdensities (Schaye et al., 2003). The characteristic epoch of this enrichment and its main donors remain uncertain. Late supernova-driven “superwinds” from massive galaxies (e.g., Aguirre et al., 2001; Adelberger et al., 2003), early outflows from dwarf galaxies (e.g., Dekel & Silk, 1986; MacLow & Ferrara, 1999; Madau, Ferrara, & Rees, 2001; Mori, Ferrara, & Madau, 2002; Scannapieco, Ferrara, & Madau, 2002; Furlanetto & Loeb, 2003), quasar-driven winds (e.g., Scannapieco & Oh, 2004), and the ejection of gas during the merging of protogalaxies (Gnedin, 1998) are all likely to have left some chemical imprint on circumgalactic and intergalactic gas, but their relative contributions are not constrained by present data, and involve complex baryonic processes that are difficult to model.
Observations clearly show that galactic-scale outflows with velocities of several hundred are ubiquitous in massive star-forming galaxies at high redshift and in starburst galaxies in the local universe (e.g., Heckman, Lee, & Miley, 1990; Pettini et al., 2001; Martin, 2005; Veilleux, Cecil, & Bland-Hawthorn, 2005; Weiner et al., 2009; Steidel et al., 2010). They also indicate that the metal content of the IGM is closely correlated with the positions of nearby galaxies: O systems are found to be strongly associated with known Lyman-break galaxies (LBGs), most detectable C systems () lie within 1 proper Mpc from an LBG, and roughly one-third of all “intergalactic” absorption lines with are produced by gas that lies within 80 proper kpc from an LBGs (Adelberger et al., 2003, 2005a). Somewhat puzzling, the comoving mass density of C ions in the IGM is found to drop by a factor of 4 at (Ryan-Weber et al., 2009; Simcoe et al., 2011).
Understanding the galaxy-IGM ecosystem, i.e. the role of inflows, outflows, star formation and active galactic nucleus (AGN) “feedback” in governing the gaseous and metal content of galaxies and their environment, is the goal of many recent theoretical efforts. Hydrodynamical simulations of galaxy formation over large cosmological volumes, while advancing rapidly over the past few years (e.g. Cen, Nagamine, & Ostriker, 2005; Oppenheimer & Davé, 2008, 2009; Wiersma et al., 2009; Shen et al., 2010; Cen & Chisari, 2011), typically suffer from poor spatial and mass resolution – which limits their ability to follow self-consistently the venting of metals by small galaxies and the transport of heavy elements from their production sites into the environment. And while with suitable wind prescriptions these simulations have shown that galactic outflows can potentially enrich the IGM to approximately the observed levels, it is not clear whether the same prescriptions are also able to produce realistically looking galaxies. To shed some light on the objects and processes responsible for seeding the circumgalactic and intergalactic medium with nuclear waste, we follow here a different approach. We present results from a new cosmological -body/smooth particle hydrodynamic (SPH) simulation of extreme dynamic range, a twin of the “Eris” simulation (Guedes et al., 2011). Termed “ErisMC”, the simulations follows the assembly of a massive galaxy halo with a spline softening length of 120 pc and 26 million dark matter and SPH particles in the high-resolution region. The feedback from an active galactic nucleus is neglected, and a star formation recipe is adopted based on a high gas density threshold. Heating by supernovae occurs in a clustered fashion, and the resulting pressure-driven outflows at high redshifts remove low angular momentum metal-enriched gas. As shown below, our detailed study of ErisMC’s CGM at reveals that late galactic superwinds – the result of recent star formation – account for only a small fraction of all the metals found between 100 and 200 (proper) kpc from the center of the main host, and resolves two other sources for the heavy elements found in ErisMC’s environment: its satellite progenitors – which deposit their metals before and during infall – and the orbiting nearby dwarfs.
The paper is organized as follows. In § 2 we describe the ErisMC simulation. § 3 presents a detailed study of the galaxy CGM. The origin of circumgalactic metals and the role played by satellite progenitors and nearby dwarfs in polluting ErisMC’s environment are discussed in § 4. The properties of the supernova-driven outflows from the main host are analyzed in § 5. Finally, in § 6 we summarize our main results. Throughout this work, we use the metal mass fraction for the solar abundance (Asplund et al., 2009).
2. The ErisMC simulation
The Eris suite of simulations was performed in a Wilkinson Microwave Anisotropy Probe 3-year cosmology running the parallel TreeSPH code Gasoline (Wadsley et al., 2004). Details of the main simulation are given in Guedes et al. (2011), and are briefly summarized here. The high-resolution region, 4 comoving Mpc on a side, is embedded in a low-resolution, dark matter-only, periodic box of 90 comoving Mpc on a side, and contains 13 million dark matter particles and an equal number of gas particles, for a final dark and gas particle mass of and , respectively. The gravitational softening length, , was fixed to 120 physical pc for all particle species from to the present, and evolved as from to the starting redshift of . Compton cooling, atomic cooling, and metallicity-dependent radiative cooling at low temperatures (Mashchenko et al., 2006) are included. A uniform UV background modifies the ionization and excitation state of the gas and is implemented using a modified version of the Haardt & Madau (1996) spectrum.
Star formation occurs stocastically when cold ( K), virialized gas reaches a threshold density atoms cm-3 and is part of a converging flow. It proceeds at a rate
| (1) |
(i.e. locally enforcing a Schmidt law), where and are the stellar and gas densities, and is the local dynamical time. Each star particle has an initial mass and represents a simple stellar population with its own age, metallicity, and a Kroupa et al. (1993) initial stellar mass function (IMF). Star particles inject energy, mass, and metals back into the ISM through Type Ia and Type II SNe and stellar winds, following the recipes of Stinson et al. (2006). Each SN II deposits metals and a net energy of ergs into the nearest neighbor gas particles, and the heated gas has its cooling shut off (to model the effect of feedback at unresolved scales) until the end of the momentum-conserving phase of the SN blastwave, which is set by the local gas density and temperature and by the total amount of energy injected (McKee & Ostriker, 1977). Cooling is turned off only for those particles within the blast radius (for a maximum of 32 neighboring gas particles), and no kinetic energy is explicitly assigned to them. For the typical conditions of star-forming clouds resolved in this study, this translates into just one gas particle heated up by a SN and having its cooling shut off for a timescale yr. The energy injected by many SNe adds up to create larger hot bubbles and longer shutoff times. The advantage of this physically-motivated feedback model compared to other “sub-grid” schemes (e.g. Springel & Hernquist, 2003; Oppenheimer & Davé, 2008) is that it keeps galactic outflows hydrodynamically coupled to the energy injection by SNe (albeit with a delay). In combination with a high gas density threshold for star formation (which enables energy deposition by SNe within small volumes), this scheme has been found to be key in producing realistic dwarf galaxies (Governato et al., 2010) and late-type massive spirals (Guedes et al., 2011).
Metal enrichment from SN II and SN Ia follows the model of Raiteri et al. (1996). For SN II, metals are released as the main sequence progenitors die and distributed to gas within the blastwave radius. Iron and oxygen are produced according to the following fits to the Woosley & Weaver (1995) yields:
| (2) |
and
| (3) |
Each SN Ia produces 0.63 of iron and 0.13 of oxygen (Thielemann et al., 1986) and the metals are distributed between the nearest gas particles. Radiative cooling is not disabled following a SN Ia. Stellar wind feedback was implemented based on Kennicutt et al. (1994), and the returned mass fraction was determined following Weidemann (1987). The returned gas has the same metallicity as the star particle.
The reference simulation discussed here, “ErisMC”, includes metallicity-dependent radiative cooling at high temperatures following Shen et al. (2010). Aside from high-temperature metal cooling, Eris and ErisMC were run with exactly the same setup.
3. ErisMC’s circumgalactic medium
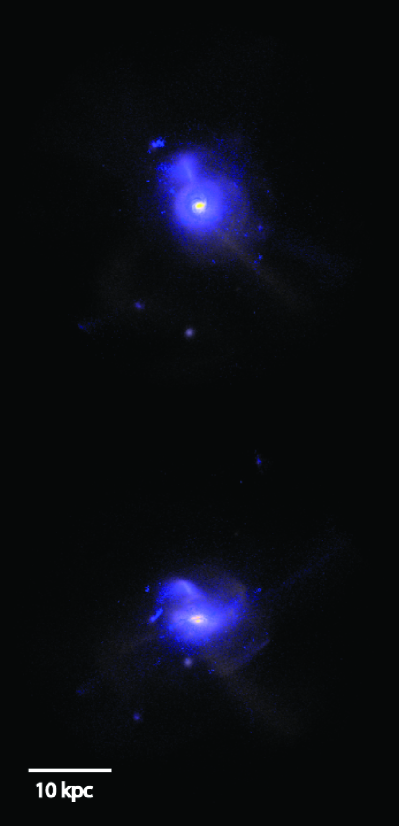
Figure 1 shows the optical/UV stellar properties of ErisMC at . The mock images were created using the radiation transfer code Sunrise (Jonsson, 2006), which produces spectral energy distributions using the age and metallicities of each simulated star particle, and takes into account the three-dimensional effect of dust reprocessing. At this epoch, the simulated galaxy has a virial mass of , a virial radius of kpc, a total stellar mass of , and is forming stars at the rate of SFR.
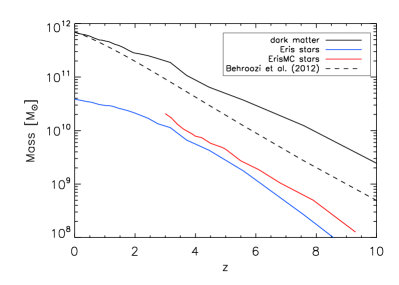
The mass assembly history of ErisMC’s stellar component and dark halo is shown in Figure 2. While ErisMC is in the right range of halo masses (, Adelberger et al. 2005a) and stellar masses (, Shapley et al. 2005) of LBGs at redshifts 2-3, by it has formed 70% more stars than Eris as a consequence of the increased metallicity-dependent radiative cooling at high temperatures. We note here that a recent new simulation of the Eris suite (“Eris2”, see Shen et al. 2012) that includes metal diffusion, a Kroupa (2001) IMF that boosts the number of Type II supernovae per unit stellar mass by about a factor of 2 compared to Kroupa et al. (1993), and metallicity-dependent radiative cooling at all temperatures, produces by redshift 3 the same stellar mass of Eris. This shows how uncertanties in the IMF, metal diffusion and gas cooling properties can affect the star formation history of the simulated galaxy. A comprehensive analysis of the average star formation rates and histories of galaxies and their connection to the underlying growth and merging of dark matter halos has been recently presented by Behroozi, Wechsler, & Conroy (2012), and it is interesting to discuss ErisMC in this context. With a specific star formation rate (sSFR=SFR/) of yr-1 at , ErisMC is consistent with the sSFR expected at these redshifts for such massive stellar systems (see Fig. 4 of Behroozi, Wechsler, & Conroy 2012). According to Behroozi, Wechsler, & Conroy (2012), halos of mass are the most efficient at forming stars at every epoch, with baryon conversion efficiencies of 20-40% that are constant to within a factor of 2 over a remarkably large redshift range. ErisMC’s efficiency, about 50%, appears then too high for a “typical” halo at . Figure 2 shows, however, that the dark matter accretion history of Eris (the same as ErisMC) is far from “typical”: when compared to the median virial mass for progenitors of halos with mass at in the Bolshoi, MultiDark, and Consuelo simulations (see fit in Behroozi, Wechsler, & Conroy 2012), Eris’s fractional growth appears to be more skewed towards high redshift. While it is conceivable that this may cause Eris (and ErisMC) to form their stars ”too early”, it is fair to keep in mind that zoom-in hydrodynamical simulations may generically suffer from having star formation efficiencies that are too high at early epochs, as recently argued by Moster, Naab, & White (2012).
A 2D photometric decomposition performed on the dust-reddened rest-frame -band light distribution with the Galfit program (Peng et al., 2002) shows the presence in ErisMC of an extended stellar disk with radial scale length 0.6 kpc. The total gas and stellar metallicities are and , respectively. The galaxy’s gaseous disk (defined by all the cold, K gas within 15 comoving kpc from the center) is characterized by . This is below the mass metallicity relation at from the Sloan Digital Sky Survey (Tremonti et al., 2004) but in agreement with the metallicity data on LBGs from Mannucci et al. (2009).
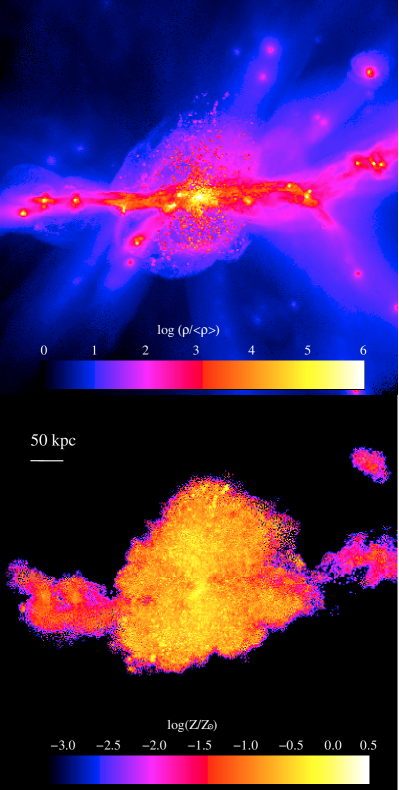
The complex environment of the galaxy forming region is clearly seen in Figure 3, which shows projected gas density (top panel) and gas-phase metallicity (bottom panel) in a cube 500 kpc on a side. While metal-enriched material is seen as far as 200 (proper) kpc (i.e. more than ) from the center, within the same region we also identify 47 self-bound dwarfs galaxies with masses (424 with ), many of them also forming stars and polluting their surroundings. The total mass of heavy elements in the gas phase within , , and is , , and , respectively. A region kpc in size is enriched to metallicities above 0.03 solar. The extent of the metal enriched region is consistent with recent observations of circumgalactic metals around LBGs (Steidel et al., 2010).
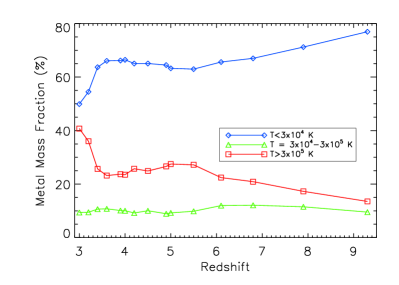
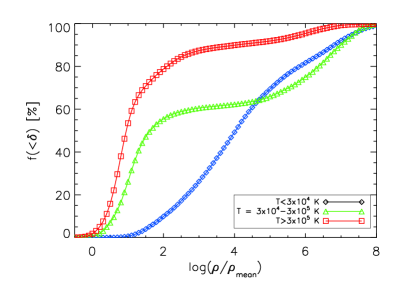
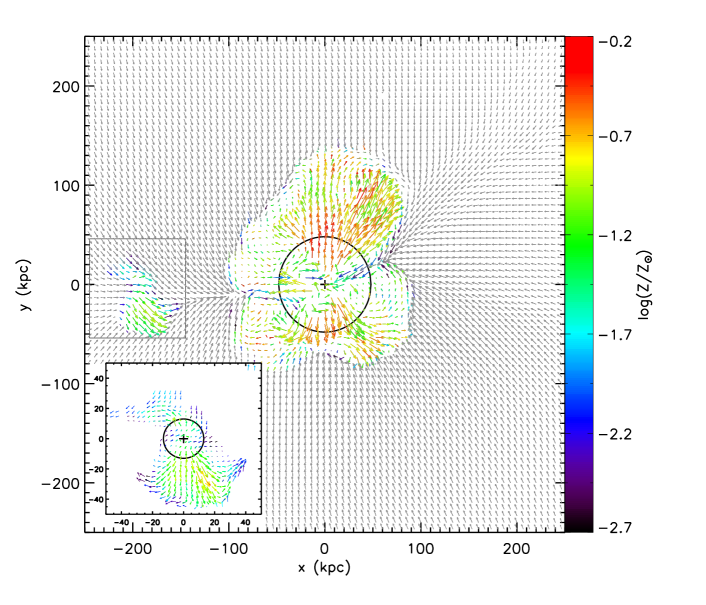
Figure 4 shows a projected gas metallicity and velocity map in a kpc3 slice. The arrows indicate the direction and magnitude of the mass-weighted peculiar velocity field relative to the center of ErisMC. Galactic winds can be clearly seen propagating perpendicularly to the disk (seen edge-on in this projection) well beyond the virial radius, with average velocities (over the slice) that exceed (we shall see below that individual gas particle speeds can reach 800 ). The outflows have a bipolar distribution with a smaller opening angle near the base, similar to the observed morphologies of galactic winds in star-forming galaxies (Veilleux, Cecil, & Bland-Hawthorn, 2005). Inflows along large-scale filaments bring in both pristine gas (gray arrows in the figure), as well as material pre-enriched by nearby dwarfs (colored arrows on the left side of the figure and in the inset). Inflowing cold streams that penetrate deep inside the virial radius are commonly seen in cosmological hydrodynamical simulations (e.g. Kereš et al., 2005; Ocvirk et al., 2008; Dekel et al., 2009), and have been shown to give origin to C absorption with a significant covering factor (Shen et al., 2012).
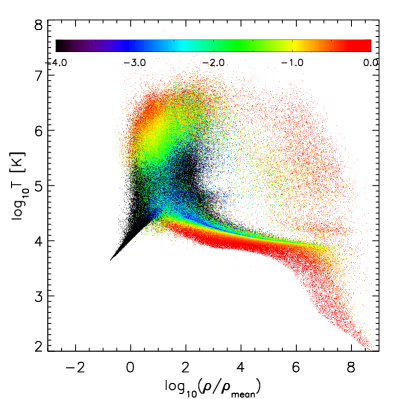
It is instructive at this stage to look at the mass-weighted distribution of all (inside and outside the main host) enriched gas at in the temperature-density plane. Figure 5 indicates that metals are spread over a large range of phases, from cold star-forming material at K and atoms cm-3 (corresponding to at ) to hot K low density intergalactic gas that cannot cool radiatively over a Hubble time. The black strip in the lower left corner of the figure marks the pristine, adiabatically cooling IGM, while the colored swath in the lower right corner shows dense, metal-rich gas in the galaxy disk cooling down below K. Hot enriched gas vented out in the halo by the cumulative effect of SN explosions can be seen cooling and raining back onto the disk in a galactic fountain. Intergalactic gas in the range shows a strong positive gradient of metallicity with increasing temperature, and has the largest range of metallicities, extending from solar all the way down to zero. We note that this is the temperature-density plane for gas in a limited zoom-in region surrounding the main galaxy, and that these results may not be representative of the IGM as a whole and of the CGM of other galaxies.
A census of all the gas-phase metals in the cold ( K), warm ( K), and hot ( K) interstellar and circumgalactic medium within 1 comoving Mpc (250 physical kpc at redshift 3) from the center of ErisMC is depicted in Figure 6 (top panel) as a function of redshift. The fraction of metals in the cold gas drops from about 70% at redshift 8 to 50% at . Hot gas is the second most important reservoir of gas-phase heavy elements, with a fraction of metals that increases from 15% at to 40% at . This phase would remain undetected in UV spectroscopic studies of high redshift galaxies, and would therefore contribute to the “missing metals” (Pettini, 2006; Bouché et al., 2007). The metal mass fraction in warm gas remains around 10% at all epochs. Note that the sudden increase in the amount of hot metals at is caused by vigorous outflow activity at these epochs rather than by the transition from “cold” to “hot” accretion mode in ErisMC.
More than 40% of all gas-phase metals at lie outside the virial radius: while cold metal-rich material traces large overdensities within the main host, about 50% of all warm and 70% of all hot metals are found in low density regions beyond the virial radius, a point illustrated in the bottom panel of Figure 6. Intergalactic metals are characterized by a strong temperature gradient with overdensity, as the metal-weighted temperature climbs from K at to K at .
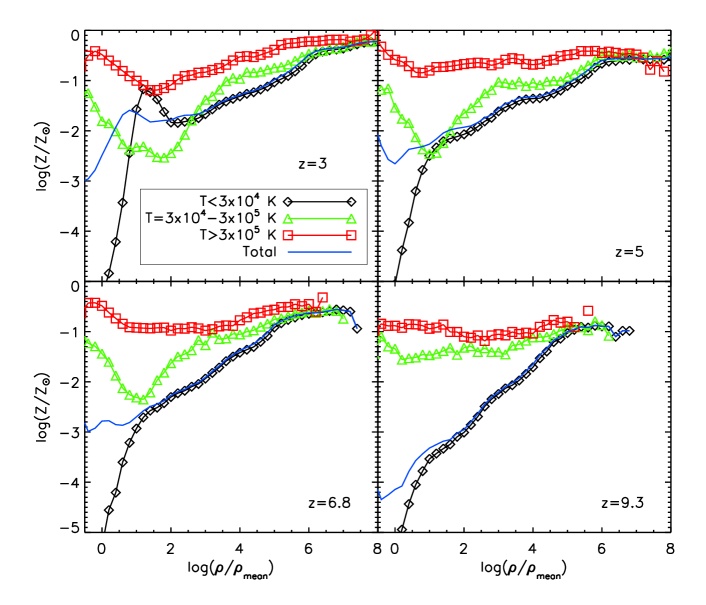
The metallicities of the individual cold, warm, and hot gas components, as well as that of the total gas phase, are shown in Figure 7 as a function of gas overdensity in four redshift bins. The gas-phase metallicity distribution at shows a positive density gradient above an overdensity of , with little redshift evolution as heavy elements removed from high density regions are steadily replenished. The mean total metallicity exhibits a plateau around , where the metals transported by SN-driven winds accumulate, and drops quickly below at overdensities below a few. A low-density peak is more clearly seen in the metallicity distribution of cold, warm, and hot gas: in the case the warm and hot medium the peak is shifted towards underdense regions. At , the mean metallicity of cold gas drops quickly below at overdensities .
While our “zoom-in” simulation focuses on the CGM of a single massive system and cannot describe the enrichment history of the IGM as a whole by a population of galaxies with different masses and star formation histories, it is still instructive to briefly compare our results with those of very recent, much lower resolution, large cosmological volume simulations of IGM pollution that use different sub-grid prescriptions for generating galactic outflows (Wiersma et al., 2009; Cen & Chisari, 2011; Oppenheimer et al., 2011). Cen & Chisari (2011) inject thermal energy and metals from SN feedback on tens of kiloparsecs scales, do not turn off hydrodynamic coupling between the ejected metals and the surrounding gas, and, like in ErisMC, find that a large fraction of all the heavy elements in the gas phase at redshift 3 have temperatures in excess of K. Their metallicity-density relation for cold gas also shows a low-density peak, albeit shifted towards underdense regions compared to ErisMC. For comparison, in the momentum-conserved wind implementation of kinetic feedback by Oppenheimer et al. (2011) (where hydrodynamic forces are temporarily turned off) there is no low-density peak in the metallicity-density relation and metals largely reside in cool gas. IGM metals reside primarily in a warm-hot component in the simulations of Wiersma et al. (2009), who also use kinetic feedback but with non-decoupled wind models. Measurements of the distribution of carbon in the IGM using pixel statistics yield, at and , [C/H] (Schaye et al., 2003), a value that depends on the hardness of the UV background. In ErisMC we measure, for gas within 250 physical kpc from the center of the host, and at the same overdensity and including only cold and warm gas, [C/H] is also around .
4. The origin of circumgalactic metals
In the absence of metal diffusion (Shen et al., 2010), the SPH technique allows us to trace back in time the enrichment history of every gas particle. In this and the following section we use simulation outputs from the ErisMC run and the Amiga’s Halo Finder (AHF, Knollmann & Knebe 2009) to identify the age of the metals observed at redshift 3 and the sources of pollution – whether nearby dwarfs, satellite progenitors, or the main host.
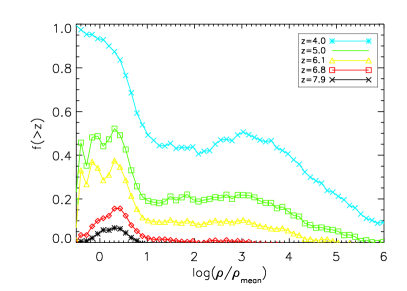
Figure 8 shows the fraction of metals at redshift 3 that was released to gas particles at overdensity before redshifts . The epoch at which a gas element is enriched is clearly a sensitive function of its overdensity at some later time. The diffuse IGM is typically enriched earlier than high density regions, a trend that is in agreement with the results of Wiersma et al. (2010) and Oppenheimer et al. (2011). More than 50% (35%) of all metals at the average density were synthesized before (), while newly produced metals are mostly confined to high overdensities.
There are two possible causes for this “outside-in” (a term we borrow from Oppenheimer et al. 2011) enrichment of ErisMC’s CGM: 1) metals released at earlier times into the high-density regions of ErisMC main host and transported into the IGM via galactic winds on timescales that are comparable to the age of the universe at ; and 2) metals released at earlier times in dwarf galaxies and shed into the surrounding intergalactic and circumgalactic medium before and/or during infall. Dwarf galaxies are referred to as “nearby dwarfs” if they are still orbiting outside at , and as “satellite progenitors” if they have been accreted by the main host before redshift 3. To identify the time, location, and source of enrichment of a given gas particle, we define a metal mass-weighted redshift as in Wiersma et al. (2010):
| (4) |
where is the metal mass gained by the gas particle in an enrichment event at redshift , and is the total metal mass of the particle at . Gas particles in ErisMC typically receive metals more than once, with about half of them enriched in more than three events. For every enrichment episode we also derive the mass of the satellite or nearby dwarf in which the gas particle resides, and the distance between the gas particle and the center of ErisMC, . Analogously to equation (4), we then define a metal mass-weighted source halo mass and distance from ErisMC center as
| (5) |
and
| (6) |
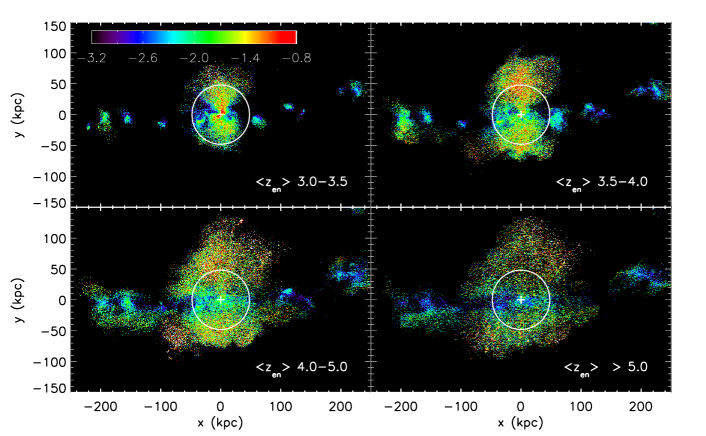
respectively. We have separated gas particles into different groups according to their and plotted in Figure 9 the projected metallicity of each group at redshift 3. Metals within ErisMC’s virial radius are clearly “younger”, i.e. they are characterized by an enrichment redshift between 3 and 3.5. Because of the long wind propagation time, “older” metals with between 4 and 5 are spread over 100 (physical) kpc perpendicularly to ErisMC’s disk. Low-metallicity gas in this enrichment redshift range can be seen as far as 200 kpc from the main host center as it is ejected from nearby dwarfs (see also Figs. 3 and 4). There is little material contaminated by metals at within ErisMC’s virial radius. Late () galactic “superwinds” – the result of recent star formation in ErisMC’s main host – are found to account for less than 9% of all the metals observed beyond ,
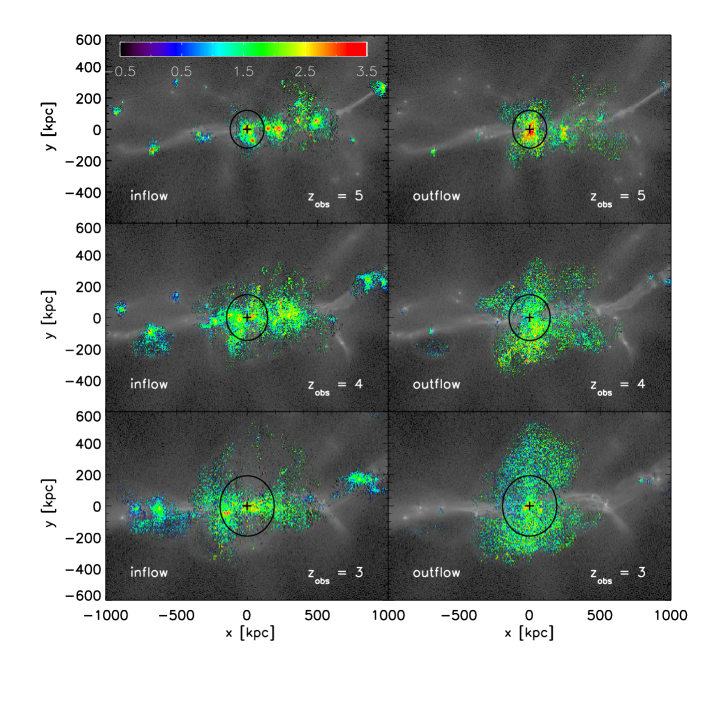
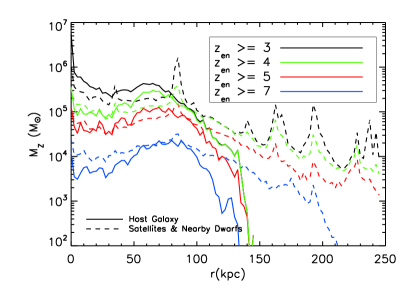
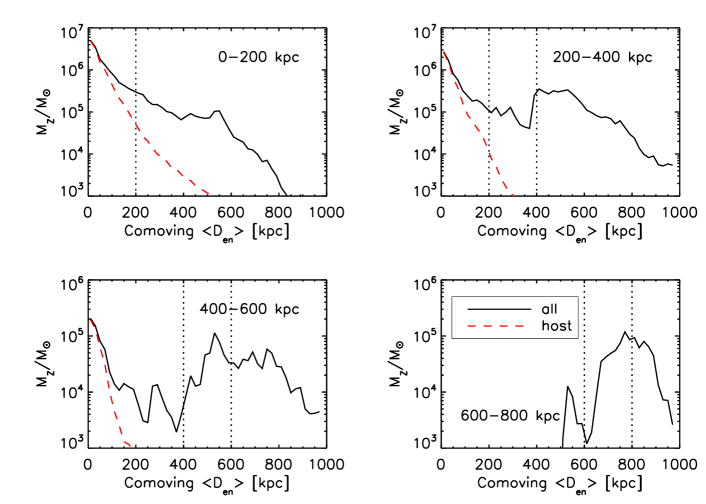
Figure 10 sheds light on the role played by satellites and nearby dwarfs in contaminating ErisMC’s circumgalactic medium. It shows the total mass of heavy elements released by the main host and its satellites as a function of distance from ErisMC’s center at redshift 3. About 60% of all the metals within 100 kpc of the center originate from the main host, and the rest from its satellites. Beyond 100 kpc, nearby dwarfs start dominating the metal budget. Both the host and the satellites contribute to the recent () pollution of gas within the virial radius. Older metals within typically form in satellite progenitors, collect along the filaments into the main host, and are not blown away by galactic outflows. Note how, within 150 kpc or so, the distribution of metals from satellites is rather smooth and follows that from the main host, an indication that gas polluted by star formation in satellite progenitors is stirred up and well mixed with ErisMC’s galactic outflows. Spikes due to individual nearby dwarfs can be seen beyond 85 kpc.
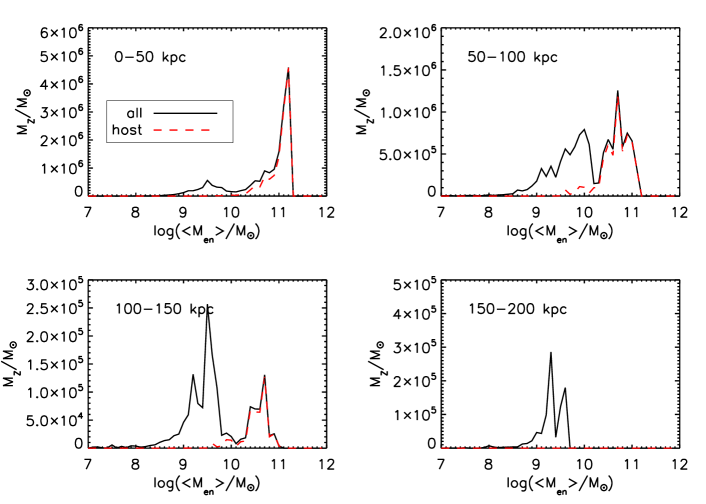
It is interesting at this stage to look at the masses of the satellites that contribute to the enrichment of the CGM. Figure 11 shows the metal-weighted mean halo mass, (defined in eq. 5), for gas at different physical distances from ErisMC’s center. Most of the satellites’ metals come from systems more massive than , with the peak of the distribution typically around . Satellites smaller than do not cause significant pollution as they are unable to form many stars both because of SN feedback and the suppression of baryonic infall by the UV background. Also, halos smaller than are resolved by less than 1,000 particles in our simulation, and the inability to properly resolve high density star-forming regions in these objects may result in a numerical suppression of star formation (as our recipe is based on a high gas density threshold). The right bottom panel shows how gas beyond 150 kpc is enriched only by nearby dwarfs. Figure 12 provides some insight on the overall transport of enriched gas by showing the metal mass distribution as a function of the enrichment distance (as defined in eq. 6). We use comoving distances to highlight departures from pure Hubble flow. Most host metals are released within 50-100 comoving kpc from the center, with those found beyond the virial radius at originating earlier from strong galactic winds launched closer to the center. Metals from satellites can have very different kinematics. Some are ejected directly into the IGM by nearby dwarfs, other, initially deposited in the halo of the main host by infalling dwarf progenitors, become part of ErisMC’s galactic outflows. We find that about 40-50% of all the satellite-produced metals found in a given distance intervals at were produced at larger distances and then transported inwards to their current location. For example, 42% of all satellite metals found at in the range 400-600 (comoving) kpc from ErisMC’s center have a mean enrichment distance larger than 600 kpc. All metals found beyond 600 comoving (150 physical) kpc were ejected by nearby dwarfs that have not been yet accreted by the host.
To better grasp the kinematics of the material enriched by satellite progenitors (i.e. dwarf galaxies that have all been accreted by the main halo before ), we plot in Figure 13 a metal column density map of ErisMC’s circumgalactic environment at three different observer redshifts, . All the heavy elements shown in the figure were produced by satellite progenitors and nearby dwarfs at epochs . All distances are comoving and the metals are separated according to their radial peculiar velocities relative to the center of the main host, , in inflowing (, left panels) and outflowing (, right panels). The projected mass distribution is shown in the gray scale. Inflowing metals at have contaminated the vicinity of their satellite hosts, and are now being accreted onto the main host along the filamentary structure. They are subsequently dispersed during the infall and tidal disruption of their satellite hosts, become entrained in the galactic wind of the main host, and are ultimately ejected in a bipolar outflow.
5. Properties of galactic outflows
In this section, we study the properties of ErisMC’s galactic ouflows and compare them with the observations as well as with other galactic wind models adopted in cosmological simulations.
5.1. Outflow velocity
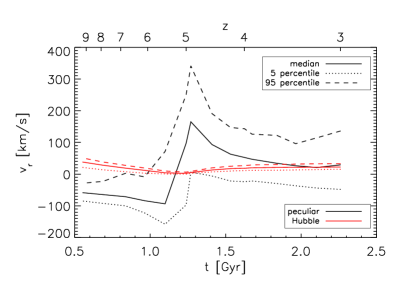
An example of the evolution with time of the radial velocity of polluted material is shown in Figure 14, where we have selected gas particles that were enriched for the last time in the main host at redshift 5, and that are unbound at . Gas accretes with negative peculiar velocity onto the host, is enriched and accelerated to outflow velocities of a few hundred by blastwave feedback, and slows down as it sweeps the ISM and halo material. The peak velocity is comparable to those observed in high redshift LBGs (e,g., Adelberger et al., 2003; Veilleux, Cecil, & Bland-Hawthorn, 2005; Steidel et al., 2010). It is also comparable to the velocities adopted in various kinetic feedback models (e.g., Springel & Hernquist, 2003; Oppenheimer & Davé, 2006; Dalla Vecchia & Schaye, 2008; Wiersma et al., 2009; Choi & Nagamine, 2011). After reaching a peak value, the gas’ proper velocity declines rapidly, and particles are swept by the Hubble flow as they move farther from the center into the IGM. This behaviour is typical of all enriched gas particles. The rapid decline of the proper velocity is also seen in the kinetic feedback model of Dalla Vecchia & Schaye (2008), where outflowing particles are allowed to interact hydrodyamically with the ISM, and pressure forces within the disk significantly decrease the wind speed.
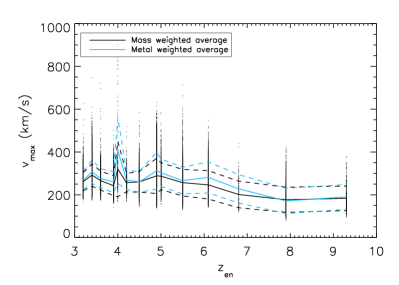
Observations of local starburst galaxies (e.g., Schwartz & Martin, 2004; Rupke et al., 2005) have shown that outflow speeds are correlated with halo masses and star formation rates, and that the correlation flattens out for SFR (Rupke et al., 2005). To investigate the existence of such relationship in the ErisMC simulation, we plot in the upper panel of Figure 15 the peak velocity of gas particles that become unbound after they are enriched in the main host, as a function of their enrichment redshift. We choose the gas peak velocity as this is close to the flow speed when the wind is launched, and is relatively unaffected by interactions between the outflow and the ISM/gaseous halo. Note that, because of the limited time resolution, we may actually underestimate the peak velocity of gas particles that reach a maximum speed and then slow down significantly within the time interval of two simulation outputs ( Myr). The scatter plot shows that enriched gas particles can often reach velocities in excess of , with a few of them moving as fast as , a value that is consistent with the highest velocity material observed in LBGs at by Steidel et al. (2010). The mass and metal-weighted outflow average speed typically ranges between 200 and 400 . From redshift 9.3 to 3.0, the total mass of the main host halo increases from to . The mean outflow speed increases for and decreases again at , so there is no obvious correlation between halo mass and the peak outflow velocity in ErisMC. Similarly, we find only a weak correlation between the maximum wind velocity and star formation rate. However, if we define the mass averaged mean outflow velocity at distance as:
| (7) |
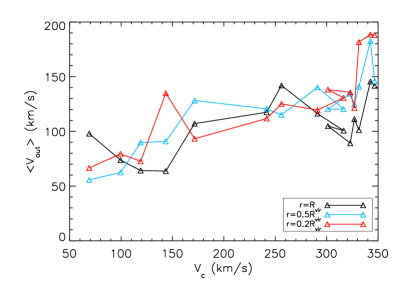
where N is the total number of outflow gas particles in a radial shell of thickness 0.02 at distance , is the mass of particle and its outflow radial velocity (relative to the host’s center). There is a correlation between the mean outflow velocity and the peak circular velocity of the host, as shown in Figure 16.
5.2. Metallicity
Figure 17 shows the metallicity of inflowing and outflowing material at ErisMC’s virial radius as a function of redshift. Galactic outflows are enriched to a typical metallicity in the range since redshift , with little dependence on cosmic time. The mean metallicity of inflowing gas shows a more marked evolution, as it increases by about one dex in the interval . This is a consequence of more processed material falling back onto ErisMC in a “halo fountain” (Oppenheimer et al., 2010) as well as being accreted via infalling satellites. Only half of the inflowing material at is unprocessed primordial gas. The gas metallicity of inflowing gas at z () is typical of the metallicity observed in Damped Ly and Lyman-Limit systems (e.g., Wolfe et al., 2005).

5.3. Mass loading
The mass loading factor characterizes the amount of material involved in a galactic outflow, and is defined as SFR, where is the rate at which mass is ejected. Observations of galactic outflows powered by starbursts suggest a wide range of mass loading factors, , with no obvious correlation with the star formation rates of their hosts (Veilleux, Cecil, & Bland-Hawthorn, 2005). In low-resolution cosmological simulations, the mass loading factor is one of the input parameters (e.g., Springel & Hernquist, 2003; Oppenheimer & Davé, 2006; Dalla Vecchia & Schaye, 2008; Choi & Nagamine, 2011). Most models adopt a constant mass loading factor, except for the momentum-driven model (Oppenheimer & Davé, 2006, 2009), where it is assumed to be inversely proportional to the host galaxy velocity dispersion , . In our SN-driven blastwave feedback scheme there is no specific parameter for mass loading. In this section we explore the mass loading factor in ErisMC and its variation with star formation and halo mass.
We compute the wind mass loading at a distance from the center as
| (8) |
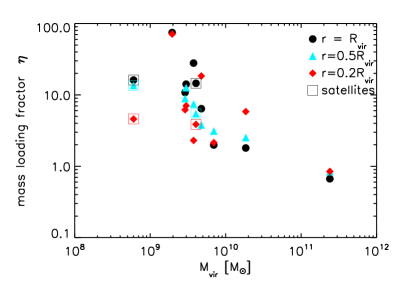
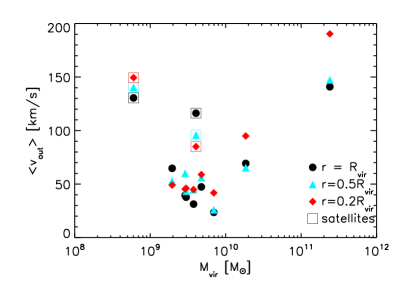
where is the thickness of the radial shell, N is the total number of outflow gas particles in the shell, is the mass of particle and its outflow radial velocity (relative to the host’s center). We have measured the mass flux at 0.2, half, and one virial radius, and divided it by the instantaneous SFR ignoring any time delay between star formation and large-scale outflow, for ErisMC and the 9 most massive dwarf halos within 250 kpc at . We find (see Fig. 18) a strong correlation of the mass-loading factor () and the mean outflow velocity () with halo mass. While is of order unity for the main host, it can exceed 10 (and reaches 80 in one case) for nearby dwarfs and satellites. Similarly, increases from 50 km/s for nearby dwarfs to 150 km/s for the main host. Satellite systems of ErisMC are indicated with open square symbols in the figure, as their mass loss and outflow velocity may be affected by tidal stripping. It is interesting to note here that, with a comparable mass loading factor to ErisMC, our Eris2 simulation (Shen et al., 2012) appears to be able to produce interstellar absorption line strengths of Ly, C , C , Si , and Si as a function of galactocentric impact parameter that are in good agreement with those observed at high-redshift by Steidel et al. (2010).
6. Summary
We have presented a detailed study of the metal-enriched CGM of a massive galaxy at using results from a zoom-in hydrodynamic simulation of a disk galaxy with mass comparable to the Milky Way. Our approach to understanding the role of inflows, star formation feedback, and outflows in governing the gaseous and metal content of galaxies and their environment, is different to that of many recent theoretical efforts: Eris’ extreme mass and spatial resolution allows us to follow self-consistently the venting of metals by small progenitor dwarf satellites and the transport of heavy elements from their production sites into the environment. The reference run adopts a blastwave scheme for supernova feedback that generates galactic outflows without explicit wind particles, and a star formation recipe based on a high gas density threshold.
We have found that ErisMC’s metal-enriched CGM extends as far as 4 virial radii (about 200 physical kpc) from its center. Approximately 41%, 9%, and 50% of all gas-phase heavy elements within 250 kpc from the center are hot ( K), warm ( K), and cold ( K), respectively. More than 40% of all gas-phase metals lie outside the virial radius: while cold metal-rich material traces large overdensities within the main host, about 50% of all warm and 70% of all hot metals are found in low density regions beyond ErisMC’s virial radius. Intergalactic metals are characterized by a strong temperature gradient with overdensity, as the metal-weighted temperature climbs from K at to above K at . SN-driven winds are able to transport metals to regions at where they accumulate, creating a peak in the cold gas metallicity-density relation at . The mean metallicity of cold gas drops quickly below at overdensities .
We have identified three sources of heavy elements in the simulated region: 1) the main host, responsible for 60% percent of all the metals found within , and for none of those found beyond ; 2) its satellite progenitors – systems accreted by the main halo before redshift 3, which shed their metals before and during infall and are responsible for 28% of all the metals within ; and its orbiting nearby dwarfs, which give origin to 12% of all the metals within and 95% of those beyond . Late () galactic “superwinds” – the result of recent star formation in ErisMC – account for only 9% of all the metals observed beyond , the rest having been released at redshifts . These findings confirm the ideas put forward by Porciani & Madau (2005), that enrichment from nearby dwarfs may contribute significantly to (and dominate at large distances) the pollution of the CGM around LBGs. Porciani & Madau (2005) argued that massive galaxies at high redshift are likely to be surrounded by the metal bubbles produced by nearby dwarfs and satellites at earlier epochs, and that gravity will tend to increase the spatial association between such metal bubbles and LBGs. The strong association observed between stronger C systems and LBGs led Adelberger et al. (2003) to argue that metal-rich “superwinds” from LBGs may be responsible for distributing the product of stellar nucleosynthesis on (comoving) Mpc scales. The analytical results of Porciani & Madau (2005) and the simulations presented here show that this is not the case, as it is nearby dwarfs that dominate the metal enrichment beyond 2-3 of LBGs. This is not to imply that most of the metals observed in the IGM at high redshift have been ejected by dwarf galaxies: rather than, as a function of distance from a massive system, the contribution of the main host becomes sub-dominant compared to that of its smaller companions. Simulations of larger cosmological volumes are needed to assess whether our results are consistent with observations of the diffuse metal-enriched IGM.
Substantial amounts of heavy elements are generated at a larger distance from the main host’s center than their current location, and subsequently are accreted by the host along filaments via low-metallicity cold inflows. Galactic outflows have velocities of a few hundred . The outflows decelerate rapidly, and the resulting long metal transport timescales produce an age gradient in metals as a function of distance from the main host. The outflow mass-loading factor is of order unity in the main halo, but can exceed a value of 10 for nearby dwarfs.
As a Lagrangian particle method, SPH does not include any implicit diffusion of scalar quantities such as metals. In the absence of some implementation of diffusion, metals are locked into specific particles and their distribution may be artificially inhomogeneous (Aguirre et al., 2005; Wiersma et al., 2009). A number of simulations of even higher resolution than ErisMC and including a scheme for turbulent mixing that redistributes heavy elements and thermal energy between the outflowing material and the ambient gas (Shen et al., 2012) are in the making.
References
- Adelberger et al. (2003) Adelberger, K. L., Steidel, C. C., Shapley, A. E., & Pettini, M. 2003, ApJ, 584, 45
- Adelberger et al. (2005a) Adelberger, K. L., Shapley, A. E., Steidel, C. C., Pettini, M., Erb, D. K., & Reddy, N. A. 2005a, ApJ, 629, 636
- Adelberger et al. (2005a) Adelberger, K. L., Steidel, C. C., Pettini, M., Shapley, A. E., Reddy, N. A., & Erb, D. K. 2005, ApJ, 619, 697
- Aguirre et al. (2001) Aguirre, A., Hernquist, L., Schaye, J., Weinberg, D. H., Katz, N., & Gardner, J. 2001, ApJ, 560, 599
- Aguirre et al. (2005) Aguirre, A., Schaye, J., Hernquist, L., Kay, S., Springel, V., & Theuns, T. 2005, ApJ, 620, L13
- Asplund et al. (2009) Asplund, M., Grevesse, N., Sauval, A. J., & Scott, P. 2009, ARA&A, 47, 481
- Behroozi, Conroy, & Wechsler (2010) Behroozi, P. S., Conroy, C., & Wechsler, R. H. 2010, ApJ, 717, 379
- Behroozi, Wechsler, & Conroy (2012) Behroozi, P. S., Wechsler, R. H., & Conroy, C. 20120, ApJ, submitted (arXiv:1207.6105)
- Bouché et al. (2007) Bouché, N., Lehnert, M. D., Aguirre, A., Péroux, C., & Bergeron, J. 2007, MNRAS, 378, 525
- Cen & Chisari (2011) Cen, R., & Chisari, N. E. 2011, ApJ, 731, 11
- Cen, Nagamine, & Ostriker (2005) Cen, R., Nagamine, K., & Ostriker, J. P. 2005, ApJ, 635, 86
- Choi & Nagamine (2011) Choi, J.-H., & Nagamine, K. 2011, MNRAS, 410, 2579
- Dalla Vecchia & Schaye (2008) Dalla Vecchia, C., & Schaye, J. 2008, MNRAS, 387, 1431
- Dekel et al. (2009) Dekel, A., Birnboim, Y., Engel, G.;, Freundlich, J., Goerdt, T., Mumcuoglu, M., Neistein, E., Pichon, C., Teyssier, R., & Zinger, E. 2009, Nature, 457, 451
- Dekel & Silk (1986) Dekel, A., & Silk, J. 1996, ApJ, 303, 39
- Gnedin (1998) Gnedin, N. Y. 1998, MNRAS, 294, 407
- Governato et al. (2010) Governato, F., et al. 2010, Nature, 463, 203
- Guedes et al. (2011) Guedes, J., Callegari, S., Madau, P., & Mayer, L. 2011, ApJ, 742, 76
- Furlanetto & Loeb (2003) Furlanetto, S. R., & Loeb, A. 2003, ApJ, 588, 18
- Haardt & Madau (1996) Haardt, F., & Madau, P. 1996, ApJ, 461, 20
- Heckman, Lee, & Miley (1990) Heckman, T. M., Armus, L., & Miley, G. K. 1990, ApJS, 74, 833
- Jonsson (2006) Jonsson, P. 2006, MNRAS, 372, 2
- Kennicutt et al. (1994) Kennicutt, R. C., Jr., Tamblyn, P., & Congdon, C. E. 1994, ApJ, 435, 22
- Kereš et al. (2005) Kereš, D., Katz, N., Weinberg, D. H., & Davé, R. 2005, MNRAS, 263, 2
- Knollmann & Knebe (2009) Knollmann, S. R., & Knebe, A. 2009, ApJS, 182, 608
- Kroupa (2001) Kroupa, P. 2001, MNRAS, 322, 231
- Kroupa et al. (1993) Kroupa, P., Tout, C. A., & Gilmore, G. 1993, MNRAS, 262, 545
- MacLow & Ferrara (1999) Mac Low, M.-M., & Ferrara, A. 1999, ApJ, 513, 142
- Madau, Ferrara, & Rees (2001) Madau, P., Ferrara, A., & Rees, M. J. 2001, ApJ, 555, 92
- Mannucci et al. (2009) Mannucci, F., et al. 2009, MNRAS, 398, 1915
- Martin (2005) Martin, C. L. 2005, ApJ, 621, 227
- Mashchenko et al. (2006) Mashchenko, S., Couchman, H. M. P., & Wadsley, J. 2006, Nature, 442, 539
- McKee & Ostriker (1977) McKee, C. F., & Ostriker, J. P. 1977, ApJ, 218, 148
- Mori, Ferrara, & Madau (2002) Mori, M., Ferrara, A., & Madau, P. 2002, ApJ, 571, 40
- Moster, Naab, & White (2012) Moster, B. P., Naab, T., & White, S. D. M. 2012, MNRAS, submitted (arXiv:1205.5807)
- Ocvirk et al. (2008) Ocvirk, P., Pichon, C., & Teyssier, R. 2008, MNRAS, 390, 1326
- Oppenheimer & Davé (2006) Oppenheimer, B. D., & Davé, R. 2006, MNRAS, 373, 1265
- Oppenheimer & Davé (2008) Oppenheimer, B. D., & Davé, R. 2008, MNRAS, 387, 577
- Oppenheimer & Davé (2009) Oppenheimer, B. D., & Davé, R. 2009, MNRAS, 395, 1875
- Oppenheimer et al. (2011) Oppenheimer, B. D., Davé, R., Katz, N., Kollmeier, J., & Weinberg, D. H. 2011, MNRAS, submitted (arXiv:1106.1444)
- Oppenheimer et al. (2010) Oppenheimer, B. D., Davé, R., Kereš, D., Katz, N., Kollmeier, J. A., & Weinberg, D. H. 2010, MNRAS, 406, 2325
- Peng et al. (2002) Peng, C. Y., Ho, L. C., Impey, C. D., & Rix, H.-W. 2002, AJ, 124, 266
- Pettini (2006) Pettini, M. 2006, in The Fabulous Destiny of Galaxies: Bridging Past and Present (Paris: Frontier Group), eds. V. Le Brun, A. Mazure, S. Arnouts, & D. Burgarella, p. 319
- Pettini et al. (2001) Pettini, M., Shapley, A. E., Steidel, C. C., Cuby, J.-G., Dickinson, M., Morwood, A. F. M., Adelberger, K. L., & Giavalisco, M. 2001, ApJ, 569, 742
- Porciani & Madau (2005) Porciani, C., & Madau, P. 2005, ApJL, 625, L43
- Raiteri et al. (1996) Raiteri, C. M., Villata, M., & Navarro, J. F. 1996, A&A, 315, 105
- Rupke et al. (2005) Rupke, D. S., Veilleux, S., & Sanders, D. B. 2005, ApJS, 160, 87
- Ryan-Weber et al. (2009) Ryan-Weber, E. V., Pettini, M., Madau, P., & Zych, B. J. 2009, MNRAS, 395, 1476
- Scannapieco & Oh (2004) Scannapieco, E., & Oh, S. P. 2004, ApJ, 608, 62
- Scannapieco, Ferrara, & Madau (2002) Scannapieco, E., Ferrara, A., & Madau, P. 2002, ApJ, 574, 590
- Schaye et al. (2003) Schaye, J., Aguirre, A., Kim, T.-K., Theuns, T., Rauch, M., & Sargent, W. L. W. 2003, ApJ, 596, 768
- Schwartz & Martin (2004) Schwartz, C. M., & Martin, C. L. 2004, ApJ, 610, 201
- Shapley et al. (2005) Shapley, A. E., Steidel, C. C., Erb, D. K., Reddy, N. A., Adelberger, K. L., Pettini, M., Barmby, P., & Huang, J. 2005, ApJ, 626, 698
- Shen et al. (2010) Shen, S., Wadsley, J., & Stinson, G. 2010, MNRAS, 407, 1581
- Shen et al. (2012) Shen, S., Madau, P., Guedes, J., Mayer, L., & Prochaska, J. X. 2012, ApJ, submitted (arXiv:1205.0270)
- Simcoe et al. (2011) Simcoe, R. A., et al. 2011, ApJ, submitted (arXiv:1104.4117)
- Smagorinsky (1963) Smagorinky, J. 1963, Monthly Weather Rev., 91, 3, 99
- Springel & Hernquist (2003) Springel, V., & Hernquist, L. 2003, MNRAS, 339, 312
- Steidel et al. (2010) Steidel, C. C., Erb, D. K., Shapley, A. E., Pettini, M., Reddy, N., Bogosavljević, M., Rudie, G. C., & Rakic, O. 2010, ApJ, 717, 289
- Stinson et al. (2006) Stinson, G., Seth, A., Katz, N., Wadsley, J., Governato, F., & Quinn, T. 2006, MNRAS, 373, 1074
- Thielemann et al. (1986) Thielemann, F.-K., Nomoto, K., & Yokoi, K. 1986, A&A, 158, 17
- Tremonti et al. (2004) Tremonti, C. A., et al. 2004, ApJ, 613, 898
- Veilleux, Cecil, & Bland-Hawthorn (2005) Veilleux, S., Cecil, G., & Bland-Hawthorn, J. 2005, ARA&A, 43, 769
- Wadsley et al. (2004) Wadsley, J. W., Stadel, J., & Quinn, T. 2004, New Astronomy, 9, 137
- Weidemann (1987) Weidemann, V. 1987, A&A, 188, 74
- Weiner et al. (2009) Weiner, B. J., et al. 2009, ApJ, 692, 187
- Wiersma et al. (2009) Wiersma, R. P. C., Schaye, J., Theuns, T., Dalla Vecchia, C., & Tornatore, L. 2009, MNRAS, 399, 574
- Wiersma et al. (2010) Wiersma, R. P. C., Schaye, J., Dalla Vecchia, C., Booth, C. M., Theuns, T., & Aguirre, A. 2010, MNRAS, 409, 132
- Wolfe et al. (2005) Wolfe, A. M., Gawiser, E., & Prochaska, J. X. 2005, ARA&A, 43, 861
- Woosley & Weaver (1995) Woosley, S. E., & Weaver, T. A. 1995, ApJS, 101, 181