Major-Merger Galaxy Pairs in the COSMOS Field — Mass Dependent Merger Rate Evolution Since
Abstract
We present results of a statistical study of the cosmic evolution of the mass dependent major-merger rate since . A stellar mass limited sample of close major-merger pairs (the CPAIR sample) was selected from the archive of the COSMOS survey. Pair fractions at different redshifts derived using the CPAIR sample and a local K-band selected pair sample show no significant variations with stellar mass. The pair fraction exhibits moderately strong cosmic evolution, with the best-fitting function of . The best-fitting function for the merger rate is . This rate implies that galaxies of have undergone – 1.5 major-mergers since z=1. Our results show that, for massive galaxies () at , major mergers involving star forming galaxies (i.e. wet and mixed mergers) can account for the formation of both ellipticals and red quiescent galaxies (RQGs). On the other hand, major mergers cannot be responsible for the formation of most low mass ellipticals and RQGs of . Our quantitative estimates indicate that major mergers have significant impact on the stellar mass assembly of the most massive galaxies (), but for less massive galaxies the stellar mass assembly is dominated by the star formation. Comparison with the mass dependent (U)LIRG rates suggests that the frequency of major-merger events is comparable to or higher than that of (U)LIRGs.
Subject headings:
galaxies: interactions — galaxies: evolution — galaxies: starburst — galaxies: general1. Introduction
Galaxy mergers have been fascinating astronomers for a long time, ever since they were recognized (see the review of Schweizer (1996)). Major mergers of galaxies of nearly equal mass stand out because of the more spectacular tidal and dynamical effects (Toomre, 1978), and many nearby major mergers have been extensively studied (Toomre & Toomre, 1972; Whitmore et al., 1995; Hibbard & van Gorkom, 1996; Hibbard & Yun, 1999; Xu et al., 2000; Wang et al., 2004). It has been well documented that major mergers can induce enhanced star formation (Kennicutt et al., 1987; Xu & Sulentic, 1991), trigger extreme starbursts and active galactic nuclear (AGN) activities (Sanders et al., 1988; Sanders & Mirabel, 1996; Dasyra et al., 2006), and transform spiral galaxies into elliptical galaxies (Toomre, 1978; Schweizer, 1982; Genzel et al., 2001). They dominate among the extreme starbursts such as luminous infrared galaxies (LIRGs, with SFR yr-1) and ultra-luminous infrared galaxies (ULIRGs, with SFR yr-1; Sanders & Mirabel 1996). On the other hand, statistically, major mergers play minor roles in the processes such as star formation and mass growth of galaxies in general. Only 1 – 2 percent of galaxies are involved in close major mergers (Xu et al., 2004; Patton & Atfield, 2008; Domingue et al., 2009), and only 2 – 3 percents of star formation rate density (SFRD) in the z=0 universe is due to close major mergers (Xu et al., 2010).
Are mergers more important in the earlier universe? Indeed, in the hierarchical structure formation paradigm of the contemporary cosmology, galaxy and dark matter halo (DMH) merging is one of the most significant processes affecting the evolution of structures in the early universe, and is largely responsible for the growth of massive dark matter halos and the buildup of galaxies (Kauffmann et al., 1993; Lacey & Cole, 1993; Khochfar & Burkert, 2005). Many observations of intermediate/high redshift peculiar galaxies and galaxy pairs have found strong evolution in the merger rate, up to (Brinchmann et al., 1998; LeFévre et al., 2000; Conselice et al., 2003; Bell et al., 2006; Conselice, 2006; Conselice et al., 2009; Kampczyk et al., 2007; Kartaltepe et al., 2007; Rawat et al., 2008), and show evidence for mergers to dominate the total star formation rate in the universe of (Zheng et al., 2004; Hammer et al., 2005; Bridge et al., 2007). On the other hand, weak merger rate evolution () has been found by other studies of intermediate/high redshift mergers (Carlberg et al., 2000; Lin et al., 2004; Lotz et al., 2008; Robaina et al., 2010; Man et al., 2011), and many authors have argued that at the SFRD is still predominantly contributed by isolated late type galaxies rather than by mergers (Flores et al., 1999; Bell et al., 2005; Lotz et al., 2008; Jogee et al., 2009). Furthermore, mergers may no longer be the predominant population among LIRGs and even ULIRGs at (Melbourne et al., 2005; Daddi et al., 2010).
In this paper, we address the controversy on the merger rate evolution using data in the COSMOS field (Scoville et al., 2007). Major reasons for the controversy include different definitions of major mergers, errors in the merger time scale, and biases in the merger sample selections (see Xu et al. 2010; Hopkins et al. 2010a). Studies using merger samples selected from peculiar galaxies (LeFévre et al., 2000; Conselice et al., 2003; Conselice, 2006; Jogee et al., 2009; Conselice et al., 2009) are vulnerable to contaminations due to minor mergers and to uncertainties of the time scale for the detectable peculiarity such as tidal tails, bridges, plumes, and other distortions (Lotz et al., 2010). In contrast, we selected our merger samples from close () major-merger pairs (stellar mass ratios ). These pairs have reasonably well understood merger time scales (Kitzbichler & White, 2008; Lotz et al., 2010).
Our pair sample is selected from the photo-z catalog of the COSMOS field (Ilbert et al., 2009) and is stellar mass limited, including massive galaxies () in the photo-z range of . The COSMOS sample has the best photo-z’s, measured using data of photometric bands covering the entire UV – infrared range, for more than 100,000 galaxies with nearly 100 percent completeness (Ilbert et al., 2009). This enables us to obtain a pair sample that is complete. By comparison the pair samples in the studies of Patton et al. (2002), Lin et al. (2004), and Bundy et al. (2009), using pairs selected from spectroscopic surveys, are only – 20% complete. Given the rather complex spectroscopic selection functions in those studies, the corrections for the incompleteness may lead to substantial uncertainties in the results.
Photo-z selected pairs of in the COSMOS field were studied by Kartaltepe et al. (2007, hereafter K07). Their sample is different from ours in two major respects: (1) It is not confined to major mergers (i.e. no constraint on the mass ratios or luminosity ratios between primaries and secondaries); (2) it is a absolute magnitude limited sample (). With more rigorously defined major-merger pair samples, our study shall improve upon the results of K07. Also, with well determined stellar mass for every galaxy in the sample, we shall study the mass dependence of the merger rate evolution.
We will confine our analysis to galaxy pairs of , because the photo-z’s and stellar mass estimates of galaxies are less accurate (Ilbert et al. 2010). We will derive the merger rates for galaxies of different stellar masses and redshifts, and separate dry mergers (E+E pairs) and wet/mixed mergers (S+S and S+E mergers). The selection of COSMOS pairs in the redshift range of is described in Section 2. Corrections for the incompleteness and for contaminations by spurious pairs are presented in Section 3. A z=0 pair sample, which sets the local benchmark for the evolution study, is presented in Section 4. The mass dependent merger rate and its evolution since z=1 are presented in Section 5. The contributions of major mergers to the galaxy assembly and elliptical galaxy formation since z=1 is investigated in Section 6, and comparisons to the mass and redshift dependence of the (U)LIRGs’ abundance is in Section 7. Section 8 is devoted to a summary of our main results. Throughout this paper, we adopt the -cosmology with and , and .
| Volume | Number of Galaxies† | |||||||||||
|---|---|---|---|---|---|---|---|---|---|---|---|---|
| () | () | |||||||||||
| 0.2 | 0.4 | 0.56 | 9.0 | 6787 | 2039 | 8826 | ||||||
| 0.4 | 0.6 | 1.23 | 9.4 | 6169 | 1526 | 7695 | ||||||
| 0.6 | 0.8 | 1.92 | 9.8 | 6745 | 1981 | 8726 | ||||||
| 0.8 | 1.0 | 2.53 | 10.2 | 6610 | 2287 | 8897 | ||||||
Note. —
-
Number of galaxies with .
2. The COSMOS Pair (CPAIR) Sample
We selected major-merger pair candidates using a parent sample of galaxies constructed from that used by Drory et al. (2009, hereafter D09) in their study of galaxy stellar mass function (GSMF), which is in turn selected from the COSMOS photo-z catalog (Ilbert et al., 2009) using the following criteria: , and .
The D09 sample has 138001 galaxies, divided into four photo-z bins of width of , and into “active” (star forming galaxies, SFGs) and “passive” (red quiescent galaxies, RQGs) populations according to the SED type of the best fitting template (Ilbert et al., 2009). The stellar mass of galaxies, , is derived through a stellar population synthesis model fitting (the Chabrier IMF), using the photo-z and photometric data in the (CFHT), , , g+, r+, i+, z+ (Subaru), (UKIRT) and (CFHT) bands. Typical uncertainties in is between 0.1 dex and 0.3 dex at 68% confidence level, depending on spectral type and the S/N of the photometry (D09). In the four photo-z bins, the completeness limits for SFGs and RQGs are and , respectively.
For galaxies in our parent sample, the stellar mass is taken from D09. In order to be complete for both SFGs and RQGs, we imposed a mass limit () on each of the photo-z bins in the parent sample. The mass limit and the number of galaxies above the limit are listed in Table 1. There are 34144 galaxies in the parent sample.
The pair sample is also divided into four photo-z bins. The selection criteria are:
-
(1) The primary galaxy has , with for the four redshift bins, respectively. ’s are 0.4 dex above the ’s of the parent sample (Table 1).
-
(2) the difference in between the primary galaxy and the secondary galaxy is less than 0.4 dex: .
-
(3) the redshift difference between the two components, , satisfies .
-
(4) the projected physical separation () is in the range of .
| Number of Galaxies† | Number of Galaxies with ‡ | |||||||||||||||||||
|---|---|---|---|---|---|---|---|---|---|---|---|---|---|---|---|---|---|---|---|---|
| in iso. | in multi. | Total | () | in iso. | in multi. | Total | SFGs∗ | RQGs∗ | ||||||||||||
| pairs | systems | pairs | systems | |||||||||||||||||
| 0.2 | 0.4 | 144 | 6 | 150 | 9.4 | 128 | 5 | 133 | 78 | 55 | ||||||||||
| 0.4 | 0.6 | 100 | 3 | 103 | 9.8 | 93 | 3 | 96 | 61 | 35 | ||||||||||
| 0.6 | 0.8 | 144 | 22 | 166 | 10.2 | 126 | 20 | 146 | 109 | 37 | ||||||||||
| 0.8 | 1.0 | 174 | 24 | 198 | 10.6 | 131 | 21 | 152 | 81 | 71 | ||||||||||
Note. —
-
Including all primaries and all secondaries.
-
Including all primaries and those secondaries with .
-
SFGs (“active galaxies”) and RQGs (“passive galaxies”) classifications were taken from D09.
Compared to the selection criteria for local pairs described in Xu et al. (2004), we replaced the rest-frame K-band selection by a stellar mass selection in criteria (1) and (2). The Spizer-IRAC 3.6 and 4.5 bands, which encompass the rest-frame K-band emission for galaxies of , have relatively low angular resolution compared to the HST/ground-based optical and NIR data. Using IRAC data would have resulted in larger confusion errors in the stellar mass for pairs with separation . At the same time, it was shown in D09 that for field galaxies of the stellar mass derived using the HST/ground-based optical and NIR data are nearly identical to those derived using data including the IRAC fluxes (Ilbert et al., 2010).
Criteria (1) and (2) guarantee that our pair sample is not affected by the “missing secondary” bias (Xu et al. 2010). Criterion (3) is set to minimize the incompleteness due to the photo-z error while ensure that the reliability of the sample is not significantly compromised. This issue will be addressed in detail in Section 3.
Using these criteria, 417 pair candidates were selected. In order to exclude spurious pairs due to imaging artifacts, visual inspections were carried out on the HST-ACS images (F814 band, Koekemoer et al. 2007). Among 417 pair candidates, 335 were covered by the HST survey. All pair candidates outside the area of HST-ACS imaging (82/417 = 19.7%) were dropped from the final pair sample. Fourteen spurious pairs were identified: 8 have wrong astrometry (i.e. no source appears at the sky coordinates) for at least one of the two galaxies and 6 are pieces of single large disc galaxies.
Some galaxies were found repetitively in multiple pair candidates. These 40 pair candidates consist of 17 triplets and 1 quartet, including 55 galaxies. The remaining 281 candidates are isolated pairs, including 562 galaxies. Because galaxies in triplets/quartets are less than 10% of the total sample, we will not distinguish them from paired galaxies. Our final COSMOS Pair sample (hereafter CPAIR) includes 617 paired galaxies, found in both isolated pairs and multiple systems. Among them, 527 (including both primaries and secondaries) have , and the remaining (90, all secondaries) have . Statistics of the sample are listed in Table 2.
3. CPAIR Sample: Incompleteness and Spurious Pairs Fraction
Much of the discrepancies between different results on merger rate evolution can be attributed to various biases causing incompleteness (missing of true mergers) and contaminations of spurious mergers in merger samples. Therefore it is important to investigate thoroughly all such biases and correct them in merger statistics.
3.1. Incompleteness due to Missing Very Close Pairs
Photometric data of the photo-z catalog (Ilbert et al., 2009) were obtained using the SExtractor in dual mode (Bertin & Arnouts, 1996). Images in all bands were degraded to a common PSF of , and the photometry was done with a constant aperture of (Capak et al., 2007). Because of the limited angular resolution of the photo-z catalog, very close pairs with angular sepatation are incomplete in the pair sample. Exploiting the COSMOS HST-ACS lensing catalog (Leauthaud et al., 2007, 2010), we estimated this incompleteness to be [0.01, 0.06, 0.08, 0.20] for the four redshift bins, with no significant mass dependence. The full analysis can be found in Appendix A.
3.2. Incompleteness due to Photo-z Errors and Spurious Pairs due to Projection
For pairs of , major cause of the incompleteness is due to photo-z errors, which have a non-negligible probability of being so large that a real pair with (corresponding to ) can have a measured and therefore be missed by the CPAIR sample. Also, the photo-z selection criterion and the photo-z errors can introduce spurious pairs whose velocity difference is larger than . Using Monte Carlo simulations, we estimated the incompleteness and the spurious pair fraction (hereafter SPF) to be [0.21, 0.21, 0.23, 0.25] and [0.07, 0.08, 0.10, 0.09], repectively, for the four refshift bins. The full analysis is presented in Appendix B.
3.3. Clustering Effect on Spurious Pair Contaminations
| Completeness Correction | Reliability Correction | |||||||||||||||
|---|---|---|---|---|---|---|---|---|---|---|---|---|---|---|---|---|
| due to missing | due to photo-z | Combined | due to random | due to | due to pairs of | Combined | ||||||||||
| very close pairs | errors | projection | clustering | |||||||||||||
| 0.2 | 0.4 | |||||||||||||||
| 0.4 | 0.6 | |||||||||||||||
| 0.6 | 0.8 | |||||||||||||||
| 0.8 | 1.0 | |||||||||||||||
Bell et al. (2006) found that in the COMBO-17 survey, the projected two-point correlation functions of massive galaxies with can be well fitted by a power-law down to , with the value of the power-index consistent with 2. Based on this result (see also Robaina et al. 2010), we made a simple estimation for the effect of galaxy clustering that was neglected in the Monte Carlo simulations. It should be pointed out that, different from Patton et al. (2000) and Bell et al. (2006), we assumed that the boundary separating physical (i.e. gravitationally bound) and unphysical pairs, , is much larger than , the separation limit in our pair selection. This is because the merger time scales derived by Lotz et al. (2010), as adopted in this work (Section 5.2), are for close pairs with projected separation .
For a given two-point correlation function , the additional SPF () due to clustering can be estimated as follows:
| (1) |
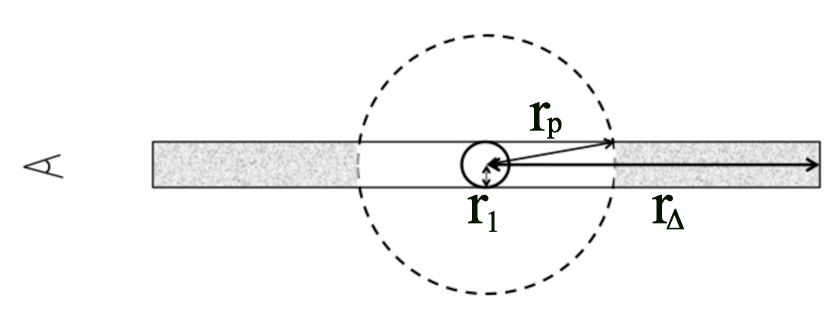
The numerator on the right-hand side of the equation is the probability to find spurious companions near a galaxy in both foreground and background (in the shadowed areas in Fig. 1). Here is , corresponding to the pair selection criterion of . The denominator is the probability of finding both real and spurious companions with a projected separation of . The relations between parameters , and are illustrated in Fig. 1. For and , Eq. 1 can be approximated by:
| (2) |
Assuming , Eq. 2 gives . It is worth noting that: (1) is comparable to the SPF found by the Monte Carlo simulations for the random associations; (2) is constant against the redshift; (3) given the uncertainties in and , we shall assume an relatively large error of 0.05 for ; (4) this correction also applies to pairs selected spectroscopically because the condition is still valid even for the selection criterion of .
3.4. Fraction of Physical Pairs with
We excluded physical pairs with from the merger rate analysis since they have very uncertain and long merger time scales. These high pairs, found in the group/cluster environments (Domingue et al., 2009), are not included in the above estimates for projected unphysical pairs. Here we make a separate correction for them. Using local pairs taken from Domingue et al. (2009), selected using nearly identical selection criteria as the CPAIR sample (cf. Section 4) except for that spec-z were used and they include all pairs (isolated or in groups/clusters) with km sec-1, we find that the fraction of physical pairs with is (Appendix C).
3.5. Completeness and Reliability of the CPAIR Sample
In Table 3 we listed estimates of the correction factors for subsamples in the four redshift bins. The combined completeness correction factor is the product of that due to missing very close pairs and that due to photo-z errors. The combined reliability correction factor, defined as , is the product of that due to random projections, the additional correction due to the clustering effect, and that due to the contamination of physical pairs with . The combined completeness correction factor varies in the range of 0.60 – 0.78 between the 4 redshift bins. The combined reliability correction factor () is rather constant against the redshift.
As an independent check, exploiting a sample of spec-z pairs (the ZPAIR sample) selected from the zCOSMOS survey (Lilly et al., 2007), we made an empirical analysis on the completeness and reliability of the CPAIR sample. This resulted in an estimate of for the completeness correction factor due to photo-z errors (the incompleteness due to missing very close pairs cannot be checked with spec-z pairs), which is consistent (within 1-) with the result of the Monte Carlo simulations (Table 3). The estimate for the reliability correction is also , again consistent (within 1-) with the values of the combined reliability correction in Table 3. The details of the analysis are presented in Appendix D.
| Mass Bin | ||||||||||||||
|---|---|---|---|---|---|---|---|---|---|---|---|---|---|---|
| 2/ 126 | 44/2034 | …… | 0/ 0 | …… | 0/ 0 | …… | 0/ 0 | |||||||
| 7/ 524 | 24/1482 | 44/1977 | …… | 0/ 0 | …… | 0/ 0 | ||||||||
| 41/2775 | 39/1174 | 34/1524 | 71/2542 | …… | 0/ 0 | |||||||||
| 97/5826 | 19/ 706 | 18/ 955 | 62/1913 | 110/3229 | ||||||||||
| 68/4520 | 6/ 183 | (0) | 0/ 267 | 10/ 645 | 39/1051 | |||||||||
| 8/ 417 | (0) | 0/ 17 | (0) | 0/ 29 | (0) | 0/ 65 | 3/ 103 | |||||||
| total | 223/14188 | 132/5596 | 96/4752 | 143/5165 | 152/4383 | |||||||||
4. Local Pair Sample
Pair statistics in the local universe were carried out using an updated version of the KPAIR sample by Domingue et al. (2009), a close major-merger pair sample selected in the K-band from cross matches between 2MASS and SDSS-DR5 galaxies. The update includes following modifications:
-
(1) Stellar masses of galaxies in KPAIR and in its parent sample are multiplied by a factor of . This is the average difference between the mass estimated using the total band luminosity and a Salpeter IMF (Domingue et al., 2009), and the mass estimated using a Kroupa IMF by Kauffmann et al. (2003). Because the mass estimated using the Kroupa IMF and that using the Chabrier IMF are nearly identical (Kauffmann et al., 2003), this modification makes the masses in the local KPAIR sample and those in the CPAIR sample consistent.
-
(2) In order to avoid possible bias due to the local over-density (associated with the local super-cluster), a lower redshift cut-off of km sec-1 () is introduced.
-
(3) Pairs with are excluded. Most of these pairs are in cluster environment, and may not be gravitationally bound. Excluding them improves the accuracy of the merger rate estimate.
-
(4) The magnitude limit is set at , the completeness limit of the KPAIR sample.
There are 18,081 galaxies in the parent sample that are brighter than , of which 14,813 have measured redshifts (redshift completeness of ), and 14,218 are in the range of . The new paired galaxies sample has 221 galaxies, all brighter than . Among them 188 are in pairs with two measured redshifts of . These redshifts are in the range of , with the median of z=0.042. The remaining 33 galaxies are in single-redshift pairs (i.e. only one of the component galaxies having measured redshift).
5. Mass Dependent Merger Rates
5.1. Pair fraction
The local pair fraction is calculated using the following formula:
| (3) |
where is the redshift completeness of the parent sample, the completeness of the local pair sample (Domingue et al., 2009), the clustering related reliability correction factor found in Section 3.3. and are numbers of galaxies in pairs of two measured redshifts and single redshifts, respectively, the number of galaxies in the parent sample with measured redshift (in the range of ). is the probability for a single-redshift pair to be a spurious pair (Domingue et al., 2009). Note that because pairs with single measured redshifts were included. Also, we supplemented the SDSS redshifts of paired galaxies with redshifts found in the literature and in our own redshift observations (Domingue et al., 2009).
The pair fractions in the COSMOS field are estimated as follows:
| (4) |
where is the reliability and the completeness (for the four photo-z bins) of the pair sample, respectively; is the fraction of pair candidates without ACS images (not included in the final pair sample, see Section 2); is the number of interacting galaxies in the pair sample, and the number of galaxies in the parent sample.
The relative error of the pair fraction (i.e. error/) can be estimated as the quadratic sum of the random error and the cosmic variance 111The pair fraction, , is proportional to the probability of finding a second galaxy within a spatial separation from a given galaxy: , where is the number density of galaxies and the two-point correlation function. Hence is proportional to , and therefore the cosmic variance has the same effect on as on the number density.:
| (5) |
The random (binomial statistics) error is
| (6) |
For the local sample, we adopted the approximation . The cosmic variance is given by (Peebles, 1980; Somerville et al., 2004):
| (7) |
where and are the parameters in the two-point correlation function , the radius of the sampling volume, and a function of :
| (8) |
The correlation function parameters for local galaxies of different masses were taken from Zehavi et al. (2005). For galaxies of , we assumed and derived the values by interpolating the measurements for galaxies of different masses and redshifts by Zehavi et al. (2005), Meneux et al. (2008) and Foucaud et al. (2010). Cosmic variances for the integral pair fractions (i.e. not divided into mass bins) were taken from that for galaxies in the mass bin of .
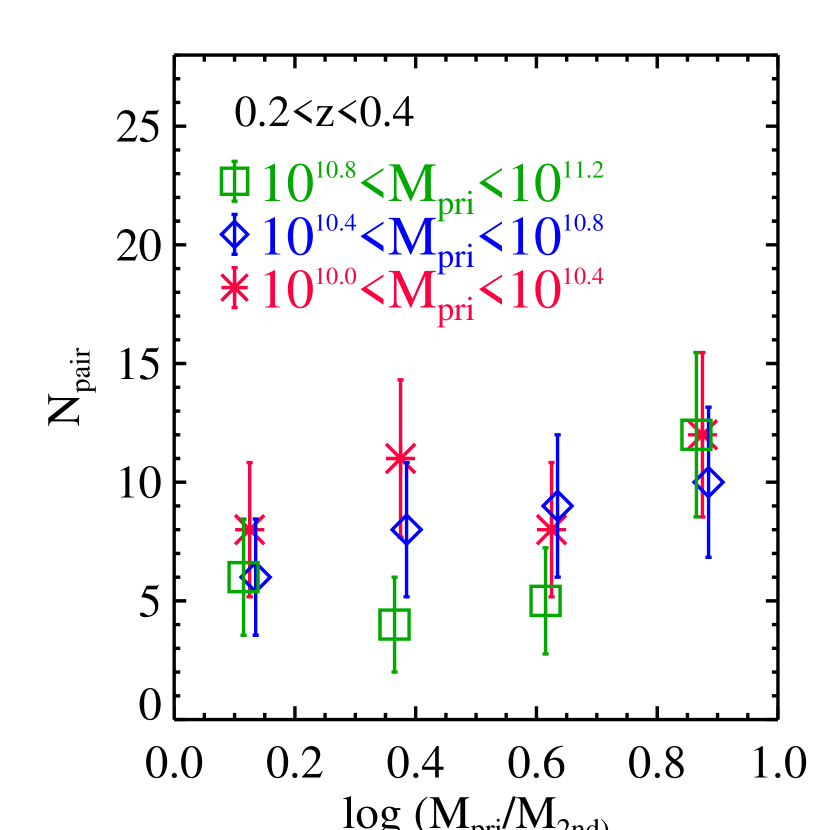
The pair fractions so calculated are listed in Table 4 and plotted in Fig. 2. For local galaxies, we confirm the conclusion of Domingue et al. (2009) that there is no significant mass dependence of the pair fraction. The integral pair fraction at z=0 is , slightly lower than the result of Domingue et al. (2009) which is . The difference is due to two factors: (1) the sample of Domingue et al. (2009) includes all pairs of km sec-1 whereas local pairs in this work are restricted to pairs of ; (2) the application of the clustering related reliability correction factor ().
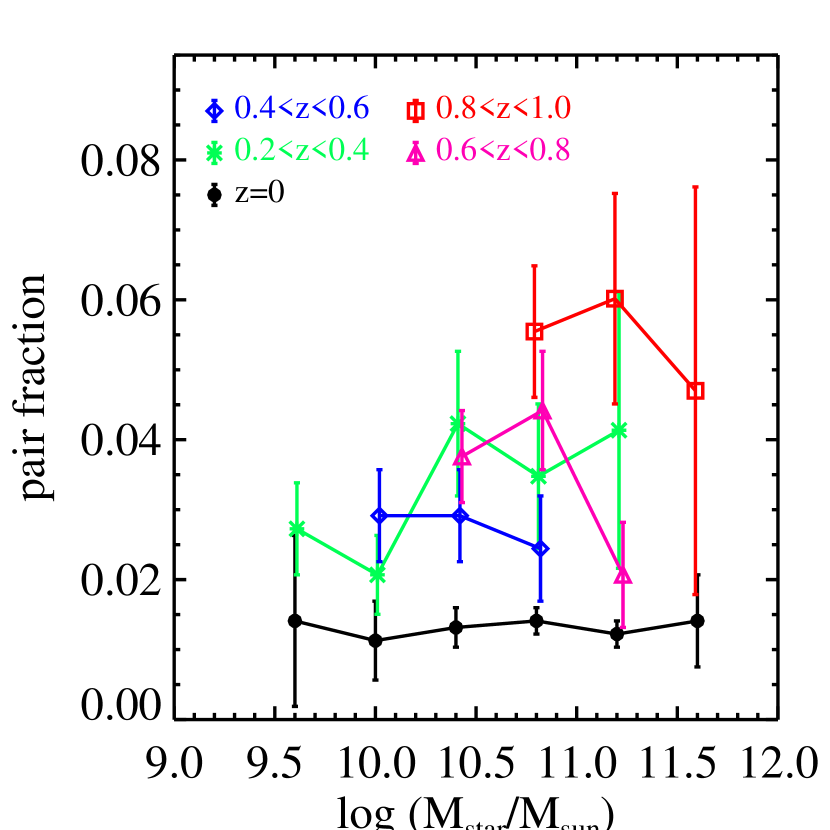
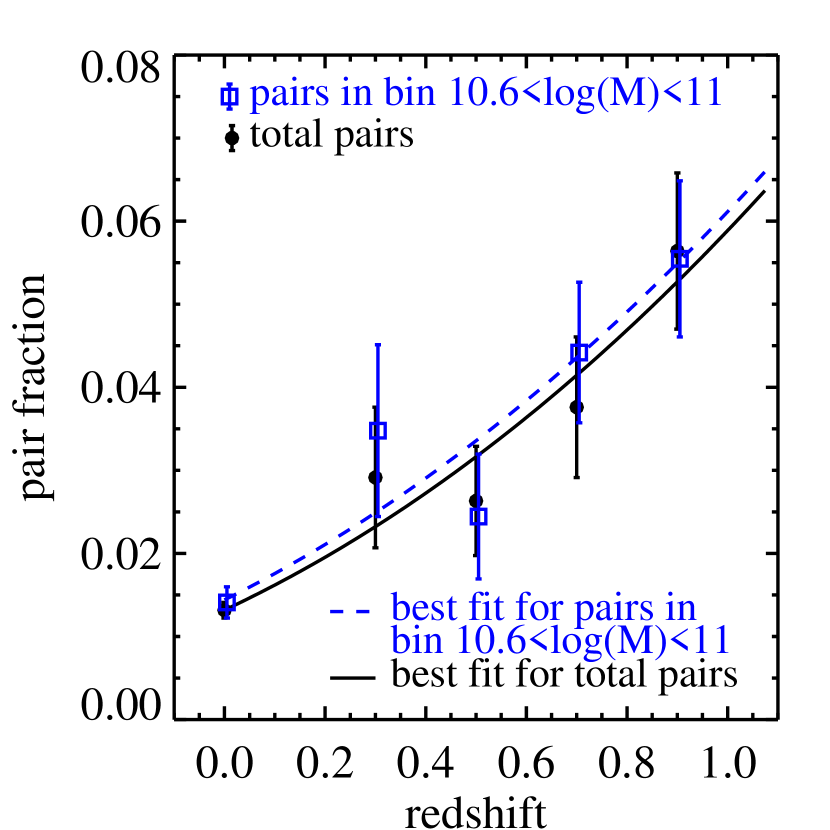
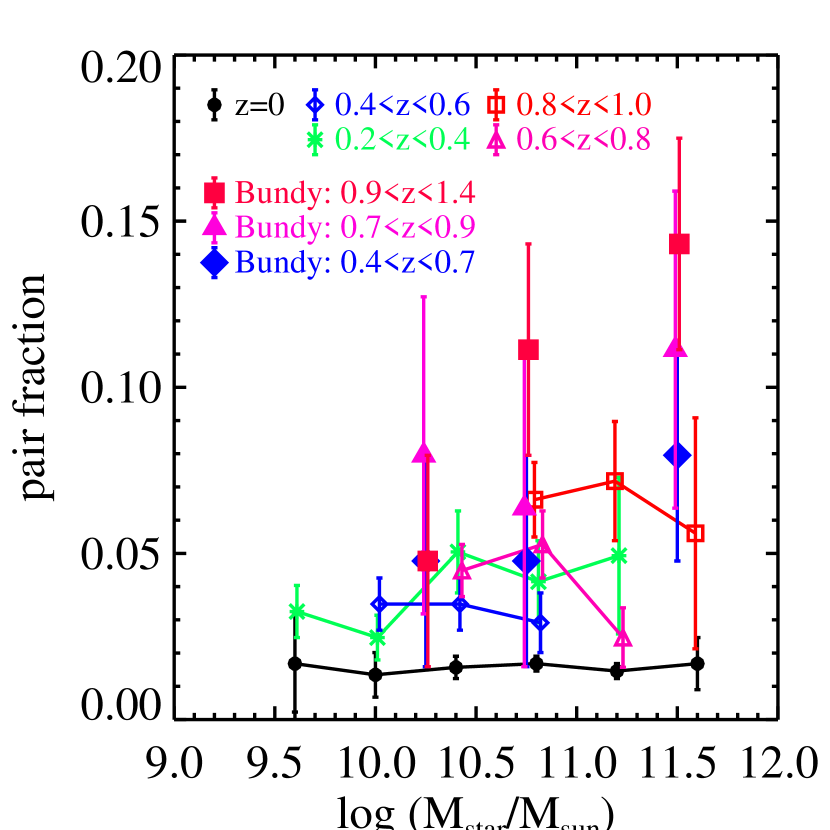
There is no evidence for a significant mass dependence of the pair fractions in higher photo-z bins, either. The trend for pair fractions to increase with redshift can be seen in all mass bins, though with substantial scatter. The major reason for the large scatter is the cosmic variance, given the relatively small volume explored by the COSMOS survey in each photo-z bin (Table 1). In particular, there is a strong density enhancement in the photo-z bin of (D09), which biases the pair fraction towards a higher value ( is proportional to the density). Cosmic variance often dominates the total error in the pair fraction: its contribution is usually except in those bins where the number of paired galaxies, , is less than 10 (hence the random error is large). In Fig. 3, we plot the redshift dependence of the integral pair fraction (pair fraction of all galaxies regardless of the stellar mass), and that of the pair fraction for galaxies in the mass bin (the bin encompassing the ). These two results are very close to each other, in agreement with our conclusion that the pair fraction does not vary significantly with stellar mass.
The least-square fit to the redshift dependence of the integral pair fractions is . For the pair fractions in the mass bin of , the best fit is .
5.2. Differential Major-Merger Rate
| Mass Bin | (Gyr-1) | |||||||||
|---|---|---|---|---|---|---|---|---|---|---|
| …… | …… | …… | ||||||||
| …… | …… | |||||||||
| …… | ||||||||||
| …… | ||||||||||
| …… | …… | …… | ||||||||
The differential major-merger rate is the probability for each galaxy to be involved in a major merger per Gyr: , where is the merger time scale in Gyr. Because the physical process of a galaxy merger is very complex (see Hopkins 2010b for a review), has been a major source of uncertainty in the merger rate studies. In the literature the most common approach has been the approximation of by the dynamical friction time scale (Binney & Tremaine, 1987; Patton et al., 2000; Jiang et al., 2008; Kitzbichler & White, 2008). Kitzbichler & White (2008) studied the in a semi-analytical model built on the results of the Millennium Simulation. They assumed circular orbits to estimate the dynamical friction process, and found relatively weak mass and redshift dependence in the form of . However, their dynamical friction time is only appropriate for small satellite galaxies at large radii. For the massive close major-merger pairs in our samples, it becomes a very poor approximation because of two issues (Hopkins et al., 2010a): (1) Angular momentum loss at these radii is not dominated by the dynamical friction, but rather by exchange in strong resonances between the baryonic components that act much more efficiently. (2) By these radii, even the initially circular orbits have become highly radial, leading to shorter merger times.
On these reasons, we instead estimated using the results of Lotz et al. (2010). They carried out high resolution hydro-dynamical simulations for a large number of galaxy mergers with diverse initial conditions, and derived at different projected separations in a view-angle averaged format. These simulated mergers have line-of-sight velocity difference , identical to the pairs in our sample. Nine mergers in Lotz et al. (2010) have baryonic mass ratios (i.e. one 1:1 merger and eight 3:1 mergers) with . In the bin of , these nine mergers have an average merging time scale of . The three 1:1 mergers in Lotz et al. (2010) have stellar masses in the range of – , and their ’s in the bin show a weak mass dependence of , consistent with what found by Kitzbichler & White (2008). Because Lotz et al. (2010) did not study the red-shift dependence of , and because their sample is too small (3 mergers) to derive a meaningful mass dependence, we adopt the relation found by Kitzbichler & White (2008), namely . These dependences are sufficiently weak that the associated uncertainties will not have any significant effect on our results. The final merger time scale we adopted is:
| (9) |
And the differential merger rate for major mergers of mass ratio is:
| (10) |
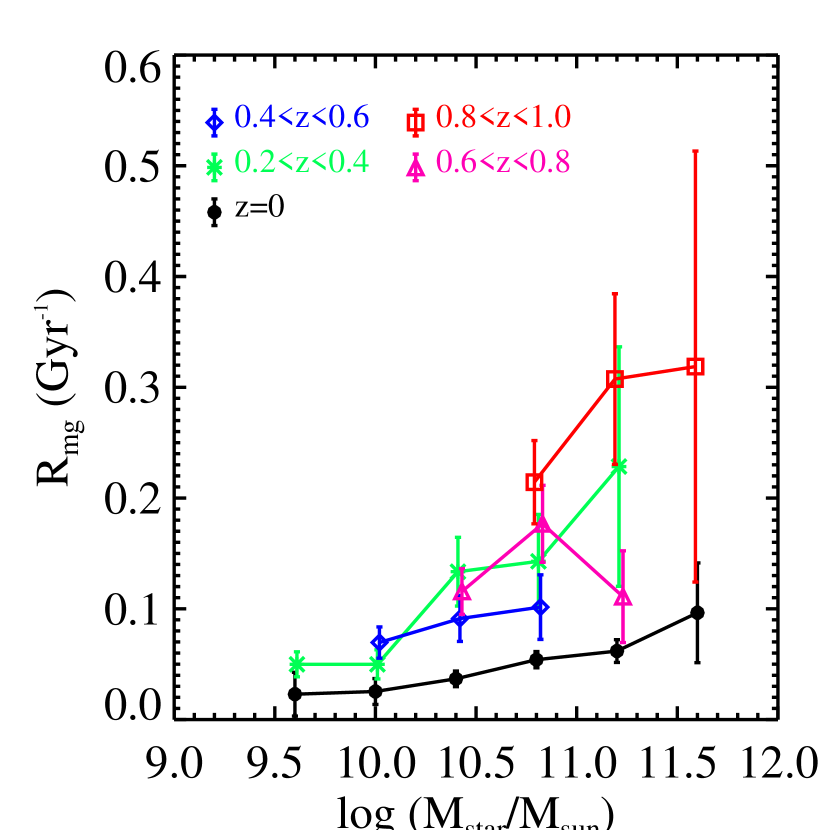
where is the factor converting the pair fraction in this work (for mergers of mass ratio ) to that of mergers of mass ratio . Here we assumed that (Appendix E). In Table 5 and Fig. 4 we present our results on .
Using the least-square fit to the pair fraction evolution, , and Eq. 9, we derived a best-fit function for the mass-dependent evolution:
| (11) |
Integrating this merger rate over time, we find that the probability for individual galaxies to be involved in a major merger since z=1 is 0.8. Accordingly, on average, massive galaxies of have undergone – 1.5 times mergers since z=1.
5.3. Comparisons with Previous Results
Our results on the mass independence of the local pair fraction (filled circles in Fig. 2) are in agreement with those of Domingue et al. (2009) and Patton & Atfield (2008) while contradicting Xu et al. (2004), the latter were derived using a small sample of 19 pairs. For pairs of higher redshifts, Bundy et al. (2009) found a trend of positive mass dependence, which was not confirmed by our results. In Fig. 5, our results are compared to those of Bundy et al. (2009). In order to compensate the difference in the mass ratios in the two works ( in this work and in Bundy et al. 2009), both results are converted to the for mergers. In Appendix E, it is shown that the pair fraction increases proportionally with . Accordingly, the pair fractions from this work were scaled up by a factor of , and those of Bundy et al. (2009) were scaled down by a factor of . The results of Bundy et al. (2009) might have suffered from large uncertainties: Those obtained using their “method I” (projected pairs without any redshift information for the companions), which are plotted in Fig. 5, were based on pair samples with high contaminations (60 – 70%) of unphysical pairs; and those from their “method II” (spectroscopic and/or photometric redshifts for both components) were based on small samples (3 to 15 paired galaxies in each mass/redshift bin). de Ravel et al. (2009) claimed evidence for strong mass dependence of the evolutionary index of the pair fraction, in the sense that low mass pairs have strong pair fraction evolution () and high mass pairs have weak evolution (). However their results are very uncertain, as indicated by their large errors. de Ravel et al. (2009) also claimed evidence for strong evolution () in optically faint pairs (, Q=1.11) and for weak evolution () in optically bright pairs (). But the low evolutionary index of the bright pairs was obtained only when they included in their fit the z=0 pair fraction of de Propris et al. (2007), one of the highest local pair fraction in the literature (Fig. 6). Indeed, when being calculated in the same way as for the evolutionary index of faint pairs (i.e. fitting only high z data points), the index of bright pairs is , consistent with that for faint pairs.
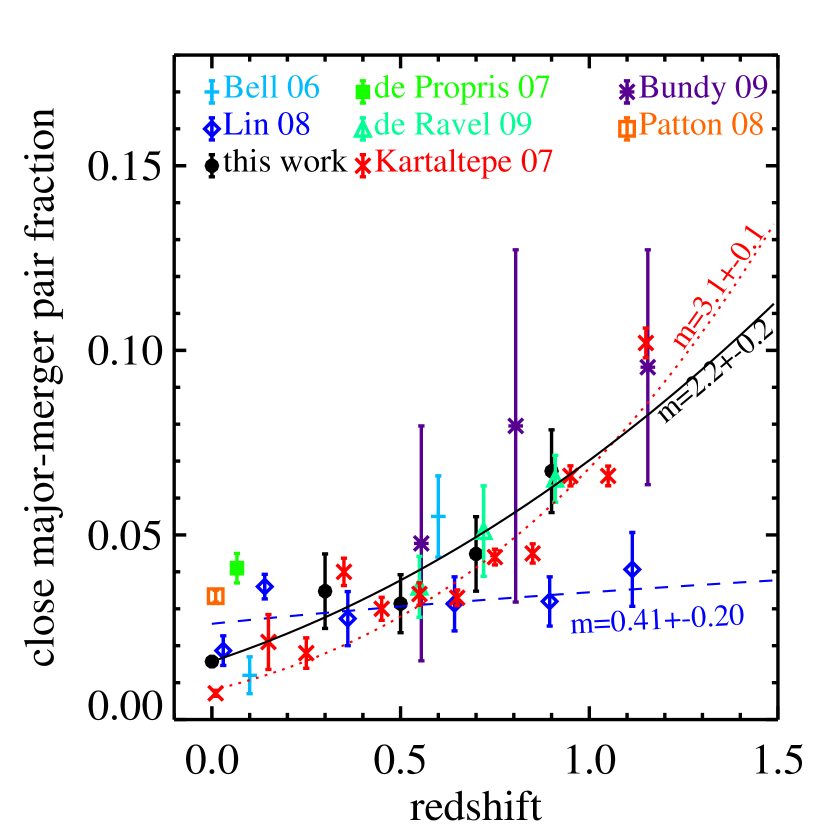
In Fig. 6, our results on the cosmic evolution of the integral pair fraction are compared with those taken from the literature. It shows that the evolutionary rate derived from our results is in between those for the strong evolution (e.g. the result of K07) and for weak evolution (e.g. the result of Lin et al. 2008), respectively. Actually, our pair fractions in the photo-z bins of –1.0 agree well with those of K07 in the same redshift range. The marginally significant difference between the two evolutionary rates is mainly due to the relatively low pair fraction at z=0, which may be caused by an incompleteness associated to the “missing secondary” bias (Xu et al., 2004), and the relatively high pair fraction at z=1.3 in the results of K07. We clearly see much stronger evolution than that of Lin et al. (2008). Their results, based on spectroscopically confirmed pair samples in incomplete redshift surveys, may have relatively large statistical uncertainties because of the large correction factors (a factor of ) for the incompleteness. The color based pre-selection of their redshift surveys may indeed introduce biases in the pair selection, given the significant influence of galaxy-galaxy interaction on optical colors (Larson & Tinsley, 1978).
| Mass Bin | ||||||||||
|---|---|---|---|---|---|---|---|---|---|---|
| …… | …… | …… | ||||||||
| …… | …… | |||||||||
| …… | ||||||||||
| …… | ||||||||||
| …… | …… | …… | ||||||||
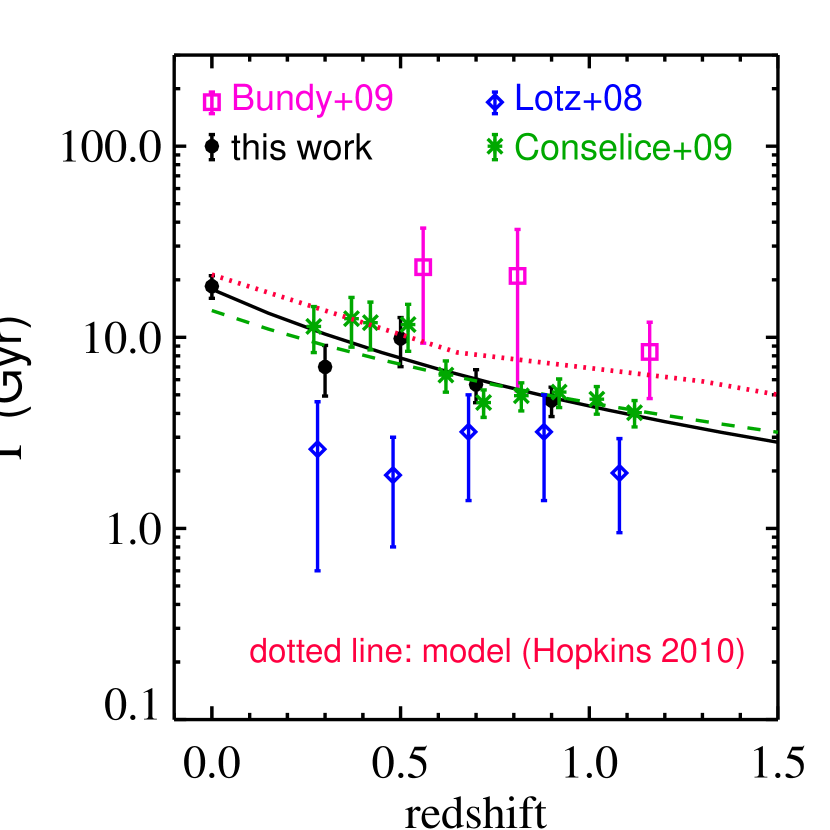
In the literature, pair fractions are often compared to merger fractions estimated using counts of peculiar galaxies (Conselice et al., 2003, 2009; Lotz et al., 2008; Jogee et al., 2009). In general the latter are higher than the former, because (1) Contaminations from irregular galaxies (Jogee et al., 2009); (2) morphologically selected merger samples based on the G – method (Lotz et al., 2008, 2010) include minor mergers; (3) the merger time scales for morphologically selected merger samples based on the CAS method are longer than the merger time scales of close major-merger pairs (Conselice et al., 2009). Given the different merger time scales for close pairs and for peculiar galaxies, it is more appropriate to compare the differential merger rates . In Fig. 7 we compare the inverse of the , (Conselice et al., 2009), of morphologically selected mergers by Conselice et al. (2009) and by Lotz et al. (2008) with that of galaxies (, Ilbert et al. (2010)) in close major-merger pairs in this work and in Bundy et al. (2009). The parameter derived using paired galaxies in our sample (the inverse of Eq. 11) and that of Conselice et al. (2009) derived using morphologically selected mergers are in very good agreement. The higher values of Bundy et al. (2009) are likely due to the relatively long merging time scale they adopted from Kitzbichler & White (2008). On the other hand, the low values and lack of evolution of Lotz et al. (2008) are because of the inclusion of minor mergers in their sample. Our results are in good agreement with the prediction of the default (semi-empirical) model of Hopkins et al. (2010b).
6. Major Mergers, Elliptical Galaxy Formation, and Galaxy Assembly
6.1. Mass Dependent Volume Merger Rate
The volume merger rate, , measures the frequency of merger events in a given volume in the universe. Here we define the mass dependent in terms of the stellar mass of the merger remnant, which is the total stellar mass of the two galaxies involved in the merging (ignoring the mass of stars formed during the merger):
| (12) |
where is the GSMF of galaxies in the parent sample (D09), the factor of 0.5 is due to the fact that every major merger event involves two galaxies of similar mass. We also assume that on average the mass of a merger remnant is 0.2 dex higher than that of individual galaxies involved in the merger. This is because, under the assumption that mass ratio distribution is flat (Appendix C), pairs in our sample has a mean mass ratio of 0.2 dex. Therefore the logarithm of the mean ratio between the total mass of a pair and that of the primary is . Our results on the are presented in Table 6.
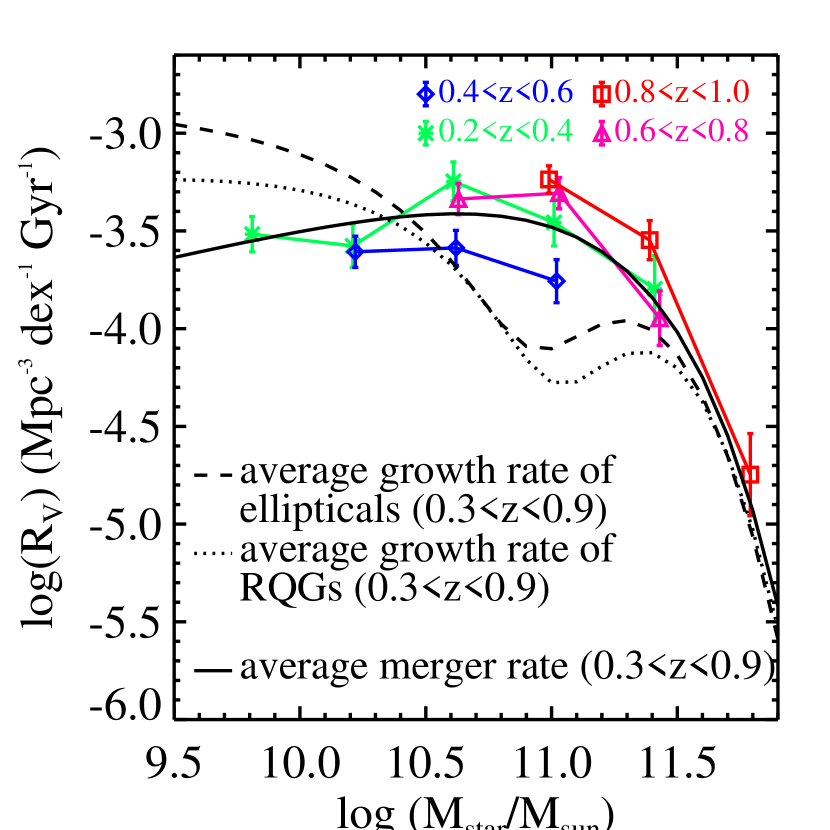
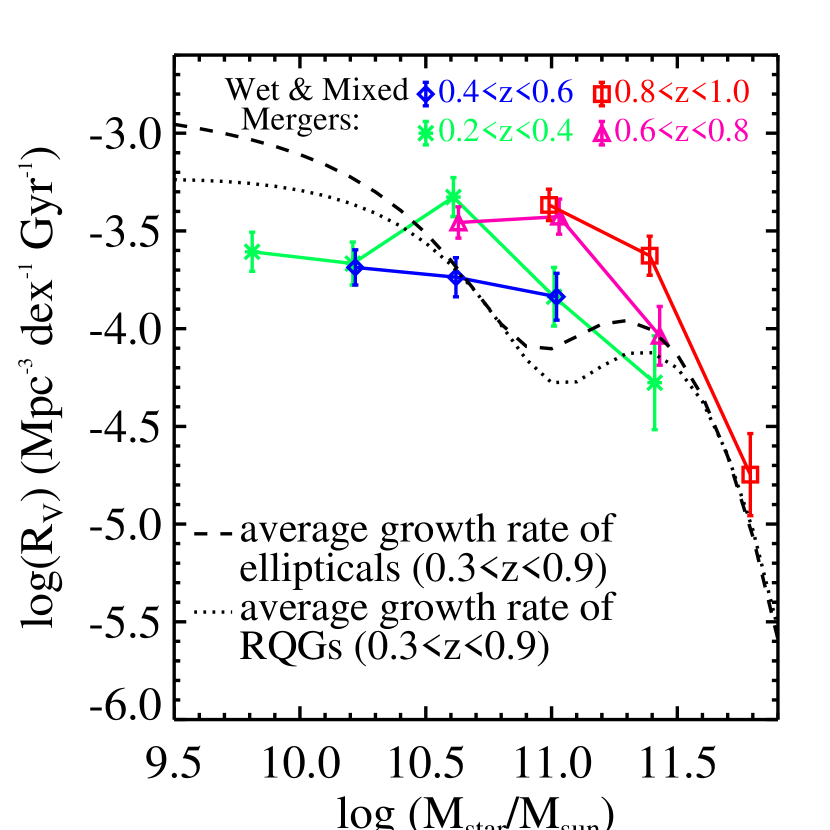
In Fig. 8 we compare our results with the average growth rate of elliptical galaxies (dashed line) and that of RQGs (dotted line) between z=0.3 – 0.9, estimated using the differences between their GSMFs at z=0.3 and z=0.9, taken from Ilbert et al. (2010), divided by 3.88 Gyr (the time span corresponding to the redshift interval of [0.3,0.9]). The solid line is the average volume merger rate calculated using Eq. 12 by replacing with its best fit (Eq. 11) and averaged over the same redshift range of 0.3 – 0.9. It shows that major mergers can fully account for the formation of both massive ellipticals and RQGs (). This contradicts Bundy et al. (2009) who concluded that the major-merger rate is too low to fully explain the formation of RQGs since z=1. The major reason for the contradiction is due to the difference in the adopted merger time scales in this work and in Bundy et al. (2009): Our , derived from the results of Lotz et al. (2010), is about a factor of 2 shorter than that used by Bundy et al. (2009). There is also a difference in the formation rates of ellipticals and RQGs adopted in this work (estimated from results of Ilbert et al. (2010)) and in Bundy et al. (2009). The latter is about 50 – 100% higher than the former.
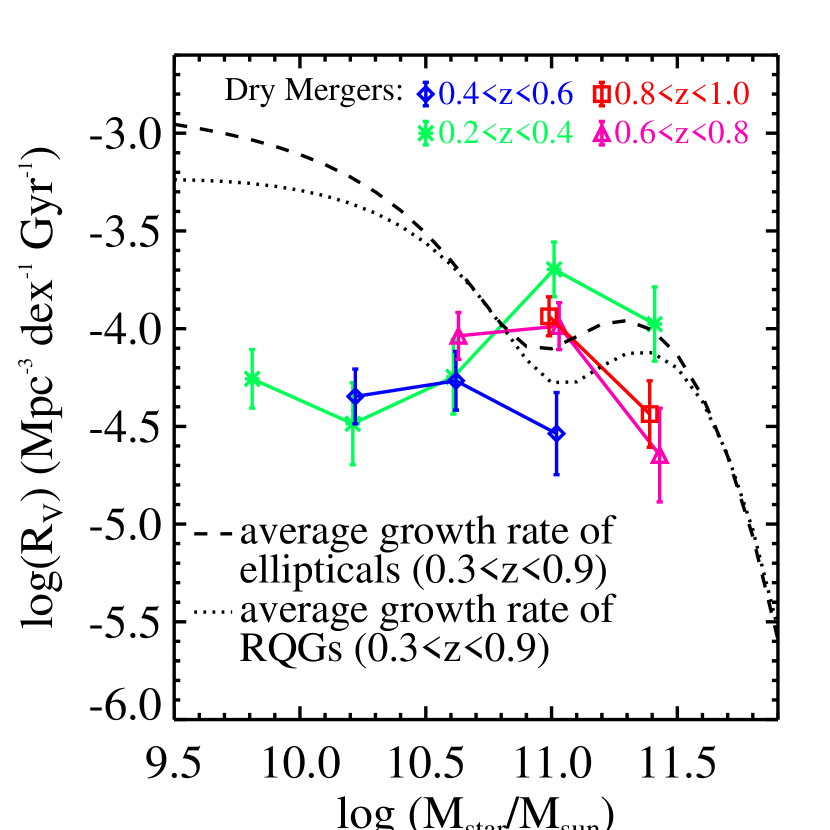
We define “dry mergers” (“wet mergers”) as those in pairs or multiple systems consisted of only RQGs (SFGs), and “mixed mergers” the rest of galaxies in the pair sample. In Fig. 9 we compare the volume merger rates of dry mergers, and those of wet and mixed mergers combined, to the formation of ellipticals. Our results show that wet/mixed mergers alone can account for the formation rate of massive ellipticals and RQGs, even for the most massive ones of . Our results are consistent with Lin et al. (2008), who also found that the wet and mixed mergers dominated over the dry mergers since z.
It should be pointed out that ellipticals (Es) and RQGs are not identical (albeit with large overlap) since there are both red disk galaxies (Bamford et al., 2009; Bundy et al., 2010) and blue ellipticals (Kannappan et al., 2009; Huertas-Company et al., 2010). Both Es and RQGs are likely originated from star forming disk galaxies: RQGs formed through SFR quenching (Bell et al., 2007; Faber et al., 2007), and ellipticals through mergers (Toomre, 1978; Barnes, 1988) or secular evolution (Kormendy & Kennicutt, 2004). Hopkins et al. (2008) argue that only major mergers can reproduce the kinematic properties of massive ellipticals, whereas some low mass ellipticals are “pseudo-bulges” formed through disk instabilities and secular evolution in late type galaxies.
Many quenching mechanisms in the literature are related either directly to merger induced feed-backs (e.g. gas consumption by extreme starbursts and gas loss due to superwinds) or to massive bulges (such as the AGN quenching, Bensen et al. 2003; Somerville et al. 2008, and morphological quenching, Martig et al. 2009). Hence a close relation between major mergers and RQGs formation is expected. Indeed Hopkins et al. (2008) argued that a wide range of observations (e.g. the bivariate red fraction as a function of galaxy and halo mass, the density of passive galaxies at high redshifts, the emergence/evolution of the color-morphology-density relations at high redshift, and the fraction of disky/boxy spheroids as a function of mass) favor a major-merger related quenching model to other quenching models.
Our results (Fig. 8 and Fig. 9) support the model of Hopkins et al. (2008). Major mergers, dominantly wet or mixed, can fully account for the formation rates of both ellipticals and RQGs with . For most massive galaxies with , the major-merger rate agrees very well with the two formation rates (in this mass range most ellipticals and RQGs belong to the same population of red elliptical galaxies). In the mass range of , the major-merger rate is slightly higher than both formation rates. Two factors may be responsible for this: (1) Remnants of some gas-rich wet mergers may remain to be blue disk galaxies (Hopkins et al., 2009). (2) Dry mergers, contributing most in this mass range, may move some red ellipticals to higher mass.
Fig. 8 and Fig. 9 also show that most (i.e. ) of low mass ellipticals and RQGs () are not produced by mergers. Many authors have argued that these galaxies are mostly quenched satellite galaxies whose gas halos are stripped by much more massive central galaxies (van den Bosch et al., 2008; Peng et al., 2010).
6.2. Impacts of Major Mergers on Galaxy Assembly
Mergers shift galaxies from lower mass bins to higher mass bins in the GSMF. The efficiency of this process is clearly critical for the hierarchical structure formation paradigm. Drory & Alvares (2008) tried to answer this question via comparisons between observed GSMF variation against redshift and that predicted by the SFR vs. z relation which was well established (in particular for ), attributing the difference to the merger effects (including both major and minor mergers). Our results on major-merger rates provide a new and more direct approach.
We define the following parameter to evaluate the impact of major mergers on the GSMF :
| (13) |
where is the GSMF (D09), the volume merger rate defined in Eq. 12, and the differential merger rate estimated using Eq. 11.
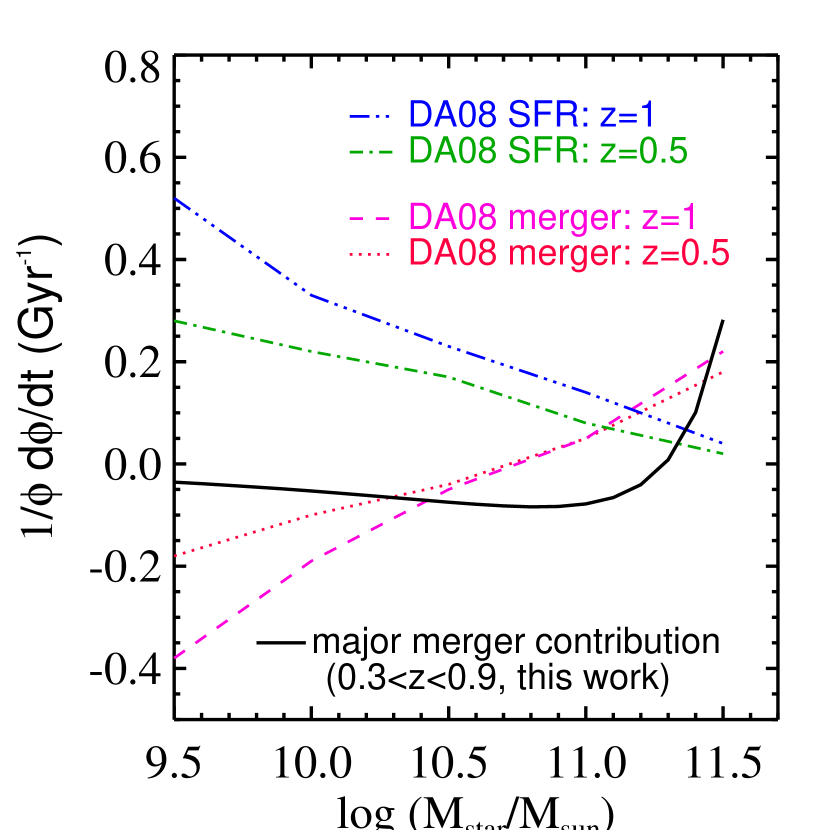
In Fig. 10 we compare our results with those of Drory & Alvares (2008). The solid line is our result on the mean over . In this redshift range, major mergers (as opposed to star formation) have significant impact to the galaxy mass assembly only for the most massive galaxies with . The GSMF change due to major mergers dominates that due to star formation only at . For less massive galaxies with the GSMF change due to major mergers is negligible (amplitude % Gyr-1) in comparison to that due to star formation. For these galaxies, our result is much flatter than that of Drory & Alvares (2008) for the GSMF change rate due to mergers at both z=0.5 and z=1. For massive galaxies () we find much steeper mass dependence than Drory & Alvares (2008). The major reason of the discrepancy is due to the difference between the redshift dependent GMSFs used in this work (Drory et al., 2009) and those in Drory & Alvares (2008), the latter were derived using data from earlier FDF/GOODS surveys.
7. Major Mergers and (U)LIRGs
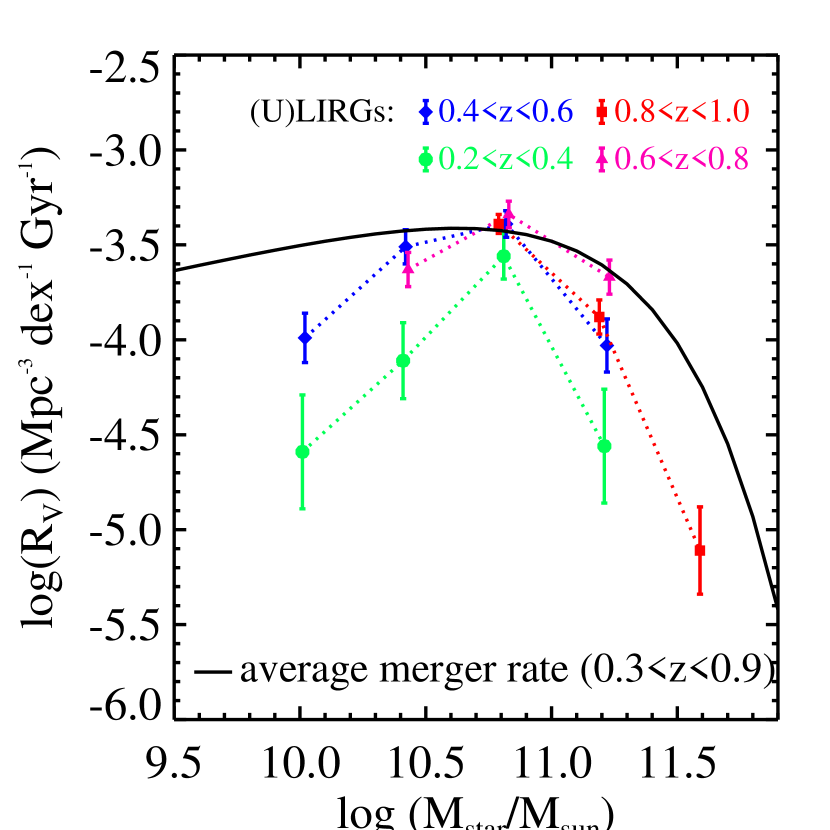
Kartaltepe et al. (2010) carried out a study of luminous IR galaxies (LIRGs: ) and ultra-luminous IR galaxies (ULIRGs: ) in the S-COSMOS survey (Sanders et al., 2007). We neglect ULIRGs of since very few galaxies have such high IR luminosities, and the AGN fraction increases rapidly with the among these galaxies (Kartaltepe et al., 2010). Taking galaxies with from their sample and adopting a (U)LIRG time scale of 140 Myr (Kartaltepe et al., 2010), we estimate the (U)LIRG rates in different stellar mass bins and in the redshift range of . The results are presented in Fig. 11, compared with the average mass dependent volume merger rate.
The mass dependence of (U)LIRG rates in all photo-z bins have the shape of the log-normal function, peaking at a rather constant mass of . In the low photo-z bin () (U)LIRGs are less frequent, consistent with the fact that (U)LIRGs are very rare in the local universe (Sanders & Mirabel, 1996). The average mass dependent volume merger rate is above or comparable to the (U)LIRG rates in all redshift and mass bins, and therefore it is possible that most of the (U)LIRGs in this redshift range are major-mergers, just like their local counterparts (Sanders & Mirabel, 1996). Using morphological classifications, Kartaltepe et al. (2010) found that of their (U)LIRGs are major-mergers. This means that the merger-induced (U)LIRG rates are even more below the average merger rate, in particular for and , than being depicted in Fig. 11. Hence, it is likely that a large fraction of major-mergers, in particular those with or , may not become (U)LIRGs. It is interesting to note that the most massive mergers of have rather low (U)LIRG rate. Most of them are wet or mixed mergers, but many probably have relatively low gas content. Galaxies of lower mass () also have low (U)LIRG rate because their gas mass is not adequate to sustain the very high SFR of the extreme starbursts in (U)LIRGs.
8. Summary
We have presented results of a statistical study on the cosmic evolution of the mass dependent major-merger rate since . A stellar mass limited sample of major-merger pairs (the CPAIR sample) was selected from the archive of the COSMOS survey. It includes 617 galaxies in pairs/multiple-systems with stellar mass ratios , projected separations in the range of , and in the photo-z range of . The pair selection was based on photo-z, with the criterion of , and on visual inspections of the HST-ACS images. The CPAIR sample is divided into four photo-z bins of [, , , ]. Various biases in the sample selection that caused incompleteness and spurious pair contaminations have been studied. This resulted in a completeness correction factor of [, , , ] and a reliability correction factor of [, , , ], respectively, for pairs in the four photo-z bins. The CPAIR sample is complemented by a local (z=0) major-merger pair sample, selected in the K-band from cross matches between 2MASS and SDSS-DR5 (an updated version of the KPAIR sample in Domingue et al. 2009).
Mass dependent pair fractions at different redshifts derived using CPAIR and KPAIR samples show no significant variations with stellar mass. The integral pair fraction (i.e. pair fraction of all galaxies regardless of stellar mass) demonstrates a moderately strong cosmic evolution, with the best-fitting function of .
The merger time scale was taken from the simulation results of Lotz et al. (2010): . The best-fitting function for the differential merger rate (for mergers) is . Accordingly, on average, galaxies of have undergone – 1.5 times major mergers since z=1. Our result on the differential merger rate is in very good agreement with that estimated using morphologically selected major-mergers (Conselice et al., 2009) and with the prediction of the “semi-empirical” model of Hopkins et al. (2010b).
The mass dependent major-merger rates derived in this work indicate that, for massive galaxies () at , major mergers involving star forming galaxies (i.e. wet and mixed mergers) can fully account for the formation rates of both ellipticals and red quiescent galaxies (RQGs), lending support to models that link both bulge formation and SFR quenching to major mergers (e.g. Hopkins et al., 2008). On the other hand, major mergers cannot be responsible for the formation of most low mass ellipticals and RQGs of . Dry mergers contribute negligibly to the major-merger rate in all mass and photo-z bins. Major mergers have significant impact to the stellar mass assembly of the most massive galaxies (). For less massive galaxies the stellar mass assembly is dominated by the star formation.
Comparisons with mass dependent (U)LIRG rates in different redshift bins suggest that the frequency of major-merger events is comparable or higher than that of (U)LIRGs. Most low mass mergers () and most very massive mergers () may not become (U)LIRGs.
Acknowledgments: This work is based on observations with the NASA/ESA Hubble Space Telescope, obtained at the Space Telescope Science Institute, which is operated by AURA Inc, under NASA contract NAS 5-26555; and Spitzer Space Telescope, which is operated by the Jet Propulsion Laboratory, California Institute of Technology under NASA contract 1407; also based on data collected at : the Subaru Telescope, which is operated by the National Astronomical Observatory of Japan; the XMM-Newton, an ESA science mission with instruments and contributions directly funded by ESA Member States and NASA; the European Southern Observatory under Large Program 175.A-0839, Chile; Kitt Peak National Observatory, Cerro Tololo Inter-American Observatory, and the National Optical Astronomy Observatory, which are operated by the Association of Universities for Research in Astronomy, Inc. (AURA) under cooperative agreement with the National Science Foundation; the National Radio Astronomy Observatory which is a facility of the National Science Foundation operated under cooperative agreement by Associated Universities, Inc ; and the Canada-France-Hawaii Telescope with MegaPrime/MegaCam operated as a joint project by the CFHT Corporation, CEA/DAPNIA, the NRC and CADC of Canada, the CNRS of France, TERAPIX and the Univ. of Hawaii. C.K.X acknowledges Kevin Bundy for constructive discussions and Alexie Leauthaud for helps in analyzing the COSMOS HST-ACS lensing catalog. Zara Scoville is thanked for proofing the English of the manuscript. Y.Z. and Y.G. are grateful for the financial support from the NSF of China (grants 10833006 and 10903029). Y.Z. thanks IPAC for the hospitality and the financial support during his visit.
References
- Bamford et al. (2009) Bamford, S. P. et al. 2009, MNRAS, 393, 1324
- Barnes (1988) Barnes, J. E. 1988, ApJ, 331, 699
- Bell et al. (2005) Bell, E. F., Papovich, C., Wolf, C., et al. 2005, ApJ, 625, 23
- Bell et al. (2006) Bell, E. F., Phleps, S., Somerville, R. S., R.S., et al. 2006, ApJ, 652, 270
- Bell et al. (2007) Bell, E. F. et al. 2007, ApJ, 663, 834
- Bensen et al. (2003) Bensen, A. J. et al. 2003, ApJ, 599, 38
- Bertin & Arnouts (1996) Bertin, E. & Arnouts, S. 1996, A&AS, 117, 393
- Binney & Tremaine (1987) Binney, J. & Tremaine, S. 1987, Galactic Dynamics (Princeton: Princeton Univ. Press)
- Bridge et al. (2007) Bridge, C. R., Appleton, P. N., Conselice, C. J., et al. 2007, ApJ, 659, 931
- Brinchmann et al. (1998) Brinchmann, J., Abraham, R., Shade, D., et al. 1998, ApJ, 499, 112
- Bundy et al. (2009) Bundy, K. et al. 2009, ApJ, 697, 1369
- Bundy et al. (2010) —. 2010, ApJ, 719, 1969
- Capak et al. (2007) Capak, P., Abraham, R. G., Ellis, R. S., Mobasher, B., Scoville, N., Sheth, K., & Koekemoer, A. 2007, ApJS, 172, 284
- Carlberg et al. (2000) Carlberg, R. G., Cohen, J. G., Patton, D. R., et al. 2000, ApJL, 532, 1
- Conselice (2006) Conselice, C. J. 2006, ApJ, 638, 686
- Conselice et al. (2003) Conselice, C. J., Bershady, M. A., Dickinson, M., & Papovich, C. 2003, AJ, 126, 1183
- Conselice et al. (2009) Conselice, C. J., Yang, C., C., & Bluck, A. F. L. 2009, MNRAS, 394, 1956
- Daddi et al. (2010) Daddi, E. et al. 2010, ApJL, 714, 118
- Dasyra et al. (2006) Dasyra, K. M. et al. 2006, ApJ, 638, 745
- de Propris et al. (2007) de Propris, R. et al. 2007, ApJ, 666, 212
- de Ravel et al. (2009) de Ravel, L. et al. 2009, A&A, 498, 379
- Domingue et al. (2009) Domingue, D. L., Xu, C. K., Jarrett, T. H., & Cheng, Y.-H. 2009, ApJ, 695, 1559
- Drory & Alvares (2008) Drory, N. & Alvares, M. 2008, ApJ, 680, 41
- Drory et al. (2009) Drory, N. et al. 2009, ApJ, 707, 1995
- Ellison et al. (2010) Ellison, S. L., Patton, D. R., Simard, L., et al. 2010, MNRAS, 407, 1514
- Faber et al. (2007) Faber, S. M. et al. 2007, ApJ, 665, 265
- Flores et al. (1999) Flores, H., Hammer, F., Thuan, T. X., et al. 1999, ApJ, 517, 148
- Foucaud et al. (2010) Foucaud, S., Conselice, C. J., Hartley, W. G., et al. 2010, MNRAS, 406, 147
- Genzel et al. (2001) Genzel, R. et al. 2001, ApJ, 563, 527
- Hammer et al. (2005) Hammer, F., Flores, H., Elbaz, D., et al. 2005, A&A, 430, 115
- Hibbard & van Gorkom (1996) Hibbard, J. E. & van Gorkom, J. H. 1996, AJ, 111, 655
- Hibbard & Yun (1999) Hibbard, J. E. & Yun, M. S. 1999, ApJ, 522, 93
- Hopkins et al. (2008) Hopkins, P. F. et al. 2008, ApJS, 75, 390
- Hopkins et al. (2009) —. 2009, ApJ, 691, 1186
- Hopkins et al. (2010a) —. 2010a, ApJ, 724, 915
- Hopkins et al. (2010b) —. 2010b, ApJ, 715, 202
- Huertas-Company et al. (2010) Huertas-Company, M. et al. 2010, A&A, 515, 3
- Ilbert et al. (2009) Ilbert, O. et al. 2009, ApJ, 690, 1236
- Ilbert et al. (2010) —. 2010, ApJ, 709, 644
- Jiang et al. (2008) Jiang, C. Y. et al. 2008, ApJ, 675, 1095
- Jogee et al. (2009) Jogee, S., Miller, S. H., Penner, K., et al. 2009, ApJ, 697, 1971
- Kampczyk et al. (2007) Kampczyk, P. et al. 2007, ApJS, 172, 329
- Kannappan et al. (2009) Kannappan, S. J. et al. 2009, AJ, 138, 579
- Kartaltepe et al. (2007) Kartaltepe, J. S. et al. 2007, ApJS, 172, 320
- Kartaltepe et al. (2010) —. 2010, ApJ, 721, 298
- Kauffmann et al. (1993) Kauffmann, G., S, D. M. W., & Guiderdoni, B. 1993, MNRAS, 264, 201
- Kauffmann et al. (2003) Kauffmann, G. et al. 2003, MNRAS, 341, 33
- Kennicutt et al. (1987) Kennicutt, R. C., Keel, W., van der Hulst, J., et al. 1987, AJ, 93, 1001
- Khochfar & Burkert (2005) Khochfar, S. & Burkert, A. 2005, MNRAS, 359, 1379
- Kitzbichler & White (2008) Kitzbichler, M. G. & White, S. D. M. 2008, MNRAS, 391, 1488
- Koekemoer et al. (2007) Koekemoer, A. M. et al. 2007, ApJS, 172, 196
- Kormendy & Kennicutt (2004) Kormendy, J. & Kennicutt, R. C. 2004, ARA&A, 42, 603
- Lacey & Cole (1993) Lacey, C. & Cole, S. 1993, MNRAS, 262, 627
- Larson & Tinsley (1978) Larson, R. B. & Tinsley, B. M. 1978, ApJ, 219, 46
- Leauthaud et al. (2007) Leauthaud, A. et al. 2007, ApJS, 172, 219
- Leauthaud et al. (2010) —. 2010, ApJ, 709, 70
- LeFévre et al. (2000) LeFévre, O., Abraham, R., & Lilly, S. J. 2000, MNRAS, 311, 565
- Lilly et al. (2007) Lilly, S. J. et al. 2007, ApJS, 172, 70
- Lin et al. (2004) Lin, L., Koo, D. C., Wilmer, C. N. A., et al. 2004, ApJL, 617, 9
- Lin et al. (2008) Lin, L., Patton, D. R., & Koo, D. C. 2008, ApJ, 681, 232
- Lotz et al. (2008) Lotz, J. M., Davis, M., Faber, S. M., S.M., et al. 2008, ApJ, 672, 177
- Lotz et al. (2010) Lotz, J. M., Jonsson, P., Cox, T. J., & Primack, J. R. 2010, MNRAS, 404, 575
- Man et al. (2011) Man, A. W. S. et al. 2011, arXiv:1109.2985
- Martig et al. (2009) Martig, M. et al. 2009, ApJ, 707, 250
- Melbourne et al. (2005) Melbourne, J., Koo, D. C., & Flóch, E. L. 2005, ApJL, 632, 65
- Meneux et al. (2008) Meneux, B. et al. 2008, A&A, 478, 299
- Patton & Atfield (2008) Patton, D. R. & Atfield, J. E. 2008, ApJ, 685, 235
- Patton et al. (2002) Patton, D. R., Pritchet, C. J., & Carlberg, R. G. 2002, ApJ, 565, 208
- Patton et al. (2000) Patton, D. R. et al. 2000, ApJ, 536, 153
- Peebles (1980) Peebles, P. 1980, The Large-Scale Structure of the Universe (Princeton: Princeton Univ. Press)
- Peng et al. (2010) Peng, Y. et al. 2010, ApJ, 721, 193
- Rawat et al. (2008) Rawat, A. et al. 2008, ApJ, 681, 1089
- Robaina et al. (2010) Robaina, A. R., Bell, E. F., van der Well, A., et al. 2010, ApJ, 719, 844
- Sanders & Mirabel (1996) Sanders, D. B. & Mirabel, I. F. 1996, ARA&A, 34, 749
- Sanders et al. (1988) Sanders, D. B. et al. 1988, ApJ, 325, 74
- Sanders et al. (2007) —. 2007, ApJS, 172, 86
- Schweizer (1982) Schweizer, F. 1982, ApJ, 252, 455
- Schweizer (1996) Schweizer, F. 1996, in Saas-Fee Advanced Course, Vol. 26, Galaxies: Interactions and Induced Star Formation, ed. D. Friedli, L. Martinet, & D. Pfenniger (Berlin and Heidelberg: Springer-Verlag), 105
- Scoville et al. (2007) Scoville, N. Z. et al. 2007, ApJS, 172, 1
- Somerville et al. (2004) Somerville, R. S., Lee, K., C., H., C.Ferguson, & Gardner, J. P. 2004, ApJL, 600, 171
- Somerville et al. (2008) Somerville, R. S. et al. 2008, MNRAS, 391, 481
- Toomre (1978) Toomre, A. 1978, in The Evolution of Galaxies and Stellar Populations, ed. B. M. Tinsley & R. B. Larson (New Haven: Yale Univ. Press), 401
- Toomre & Toomre (1972) Toomre, A. & Toomre, M. 1972, ApJ, 178, 623
- van den Bosch et al. (2008) van den Bosch, F. C. et al. 2008, MNRAS, 387, 79
- Wang et al. (2004) Wang, Z. et al. 2004, ApJS, 154, 193
- Whitmore et al. (1995) Whitmore, B. C. et al. 1995, AJ, 109, 960
- Xu et al. (2000) Xu, C., Gao, Y., Mazzarella, J., Lu, N., Sulentic, J. W., & Domingue, D. L. 2000, ApJ, 541, 644
- Xu & Sulentic (1991) Xu, C. & Sulentic, J. W. 1991, ApJ, 374, 407
- Xu et al. (2010) Xu, C. K., Domingue, D., Cheng, Y., Lu, N., Huang, J., Gao, Y., Mazzarella, J. M., Cutri, R., Sun, W., & Surace, J. 2010, ApJ, 713, 330
- Xu et al. (2004) Xu, C. K., Sun, Y. C., & He, X. T. 2004, ApJ, 603, L73
- Zehavi et al. (2005) Zehavi, I., Zheng, Z., & Weinberg, D. 2005, ApJ, 630, 1
- Zheng et al. (2004) Zheng, X. Z., Hammer, F., Flores, H., et al. 2004, A&A, 421, 847
Appendix A Incompleteness due to Missing Very Close Pairs — Analysis
In order to estimate how many pairs with are missing in our sample, we carried out an analysis exploiting the COSMOS HST-ACS lensing catalog (Leauthaud et al., 2007, 2010). It includes galaxies detected by HST-ACS in the F814 band (hereafter band), with an angular resolution of (Leauthaud et al., 2007). From this catalog, we selected a sample of “very close ACS pairs” through the following procedure:
-
(1) Find the match in the HST-ACS lensing catalog for every D09 galaxy of (see Section 2 for the definition of ) with a searching radius of and the criterion of mag.
-
(2) Around the ACS matches of D09 galaxies, we search for ACS pairs with three criteria: (i) mag; (ii) ; (iii) .
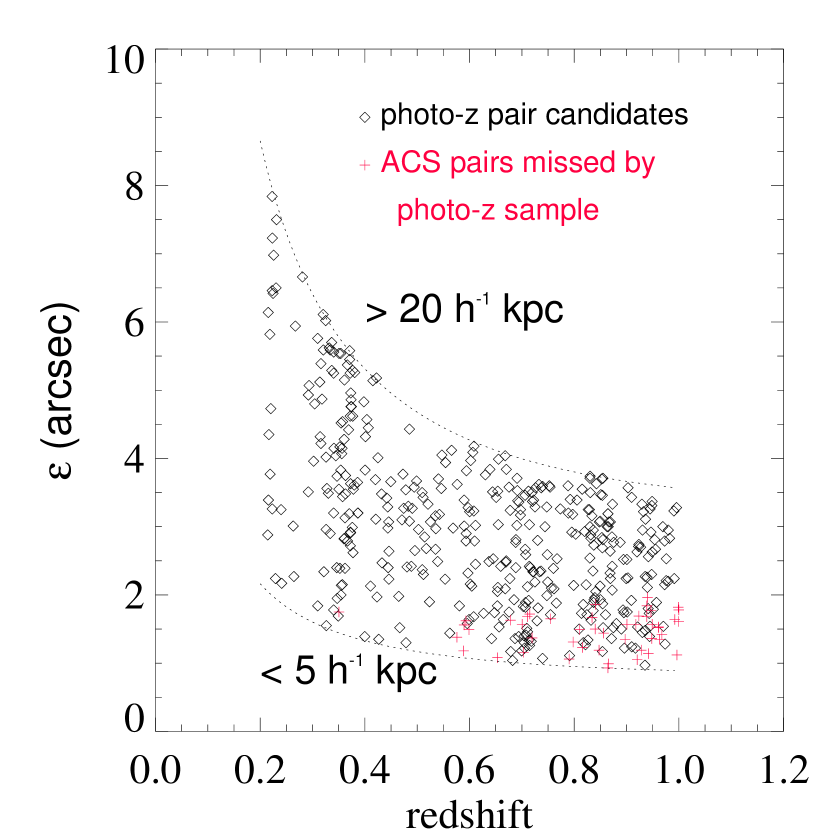
The procedure selected 222 very close ACS pairs. Among them, 171 pairs have both component galaxies with photo-z matches, including 53 pairs found in the photo-z pair sample and the remaining 118 pairs consisting of galaxies of discordant photo-z’s or with mass ratios larger than 2.5. In the remaining 51 pairs, 4 are multi-peak single galaxies in the ACS images. The final sample has 47 pairs in which only one of two galaxies was detected in the photo-z catalog. These pairs, shown in Fig. A-1 by red crosses, have the average angular separation with the standard deviation of . Fig. A-1 also shows that, for pairs of , the lower boundary for the pair separations, , corresponds to a angular separation of .
We then used Monte Carlo simulations to estimate the expected number of spurious pairs in the sample of very close ACS pairs, utilizing the 138001 galaxies in D09 sample. In each of the 100 simulations, we randomly put these galaxies in a 1.7 deg2 region, with all other properties of the galaxies, including the photo-z and stellar mass, intact. We then search companions around each of the galaxies of in the simulated sample according to the following criteria: mag, (ii) , and (iii) . Spurious pairs that do not pass the four pair selection criteria in Section 2 were then counted. These simulations found a mean spurious pair number of 103.3 with a 1- dispersion of 7.0. As described above, the number of confirmed spurious pairs of photo-z galaxies in the sample of very close ACS pairs is 118. This number is slightly higher than the mean total number of spurious pairs (103.3) predicted by the Monte Carlo simulations, perhaps due to galaxy clustering. Thus majority of 47 single photo-z ACS pairs are in fact real and not chance superpositions. Indeed their ACS images very often show signs of interaction. In what follows we shall make the conservative assumption that all 47 ACS pairs are real major-merger pairs.
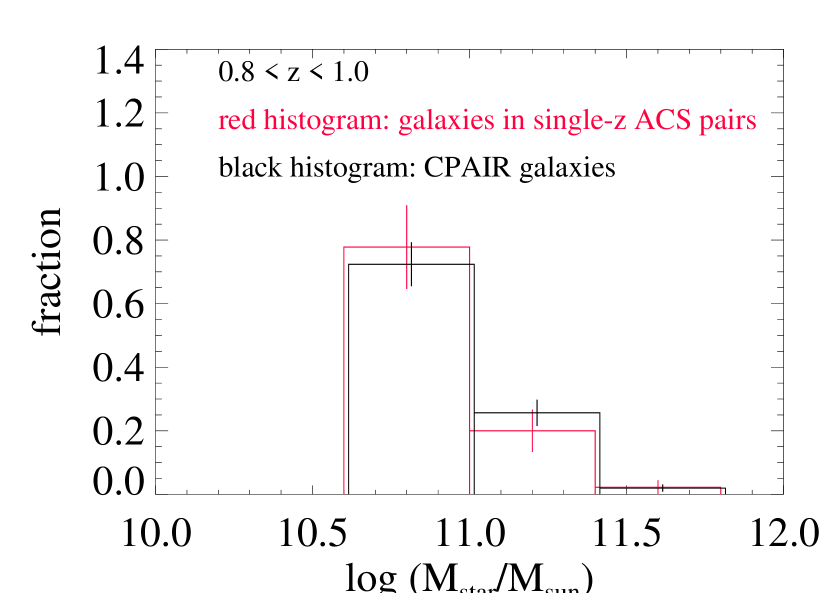
There are single photo-z ACS pairs in the four photo-z bins. The corresponding incompleteness due to missing of very close pairs, estimated according to the ratio ( being the number of photo-z pair candidates), is 0.01, 0.06, 0.08, and 0.20 for the four photo-z bins, respectively. As a check, we found no significant difference between the stellar mass distributions of galaxies in the ACS single photo-z pairs and of those in the CPAIR sample in the redshift bin of (Fig. A-2).
Appendix B Incompleteness due to Photo-z Errors and Spurious Pairs due to Projection — Monte Carlo Simulations
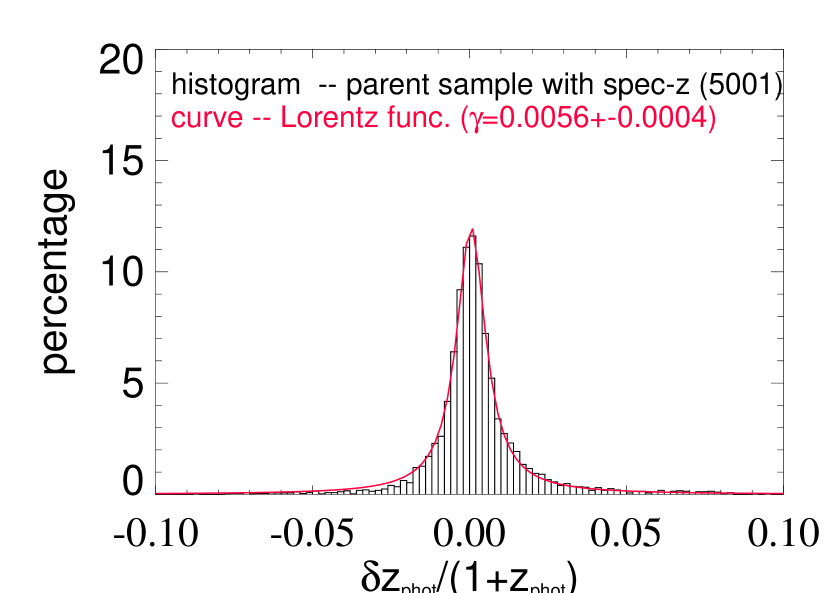
We examine the accuracy of the photo-z using the spectroscopically measured redshift (hereafter spec-z) of galaxies in the parent sample that were observed in the zCOSMOS survey (Lilly et al., 2007). zCOSMOS includes a magnitude-limited survey (zCOSMOS-bright) for about 20,000 galaxies of and , covering 1.7 deg2 COSMOS includes 10643 galaxies. There are 5001 matches (matching radius ) between galaxies in the parent sample (Table 1) and zCOSMOS sources with reliable spec-z measurements (z-class indices being 4’s, 3’s, 9.5, 9.4, 9.3, 2.5, 2.4 or 1.5). This is 19.5% of 25711 galaxies in the parent sample that have . Fig. B-1 shows of the 5001 galaxies. The distribution, an estimate of the photo-z error distribution (the spec-z error , Lilly et al. 2007), has a , consistent with the result of Ilbert et al. (2009). It can be best fitted by a Lorentzian function of the form
| (B1) |
with , and .
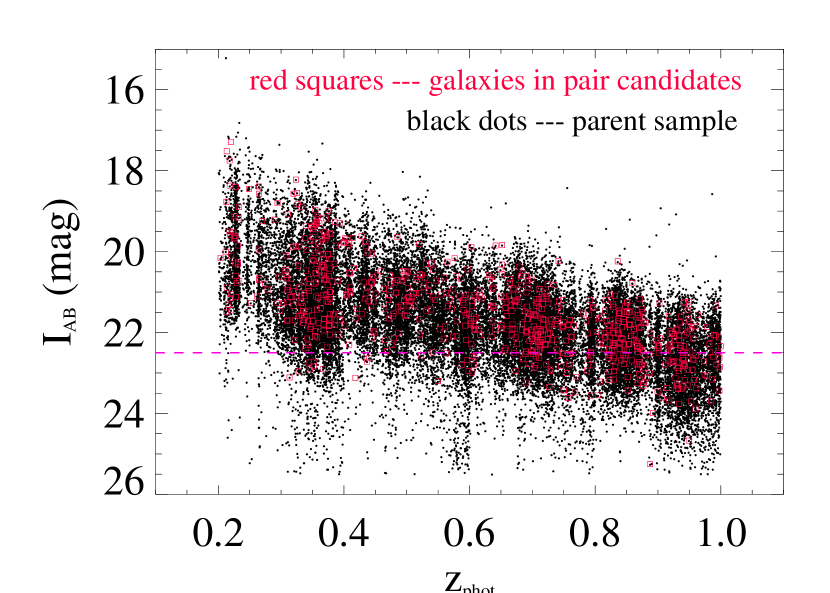
In Fig. B-2, the i-band magnitudes are shown for galaxies in pair candidates (red squares) and in the parent sample (black dots). Both the pair sample and the parent sample are dominated by galaxies brighter than . In the pair candidates, factions of 0.032, 0.061, 0.168, 0.352 of the sample are fainter than for the four redshift bins.
The Monte Carlo simulations for the estimation of completeness correction factor due to photo-z errors were based on the above results. The simulations included a total of 1000 repeats for each photo-z bin, each containing 100 pairs. For pairs in a given photo-z bin, each galaxy had a chance to be fainter (or brighter) than , the probability (simulated by a random number generator) being equal to the observed fraction of such galaxies in the photo-z bin. For galaxies brighter than , an error of was assigned to it using a random number generator with weighted probability distribution function given by a Lorentzian with and . For galaxies fainter than , the random error was generated according to a Lorentzian function with and (, where is the ratio between the photo-z accuracies for galaxies of and of , Ilbert et al. 2009). We ignored the real velocity difference and assumed that the photo-z difference in a pair is purely due to photo-z errors. The completeness factor was estimated by the fraction of simulated pairs with . According to the simulations, the completeness correction factor is [ , , ] in the four photo-z bins.
Another set of Monte Carlo simulations (each consisting of 1000 repeats) were carried out to estimate the SPF due to projection, utilizing the 138001 galaxies in D09 sample. Here we pretended that the photo-z’s in that sample are 100% accurate, and then added errors to them using the same algorithm as described above. The sky coordinates of the galaxies were also randomized, filling a 1.7 deg2 region uniformally. The other properties of the galaxies, including the stellar mass, were left intact. We then selected pairs from this simulated parent sample by applying the four selection criteria presented in Section 2. Spurious pairs were identified when the “true velocity difference”, calculated using the “true redshifts” (i.e. the photo-z’s without added error), is . In the four photo-z bins, the simulations found [, , , ] spurious pairs. Dividing these numbers by the numbers of photo-z pair candidates, the predicted SPF in the four photo-z bins are , , and , respectively.
Appendix C Distribution of Line-of-sight Velocity Difference of Major-Merger Pairs

Local major-merger pairs in Domingue et al. (2009) were selected using nearly identical selection criteria as the CPAIR sample (cf. Section 4) except for that spec-z were used and they include all pairs (isolated or in groups/clusters) with km sec-1. Here we exploit these data to determine the cumulative distribution of and, in particular, the fraction of pairs with . We assume that all pairs with are spurious. In the sample of Domingue et al. (2009), which is complete for the spec-z, 135 pairs have measured for both components and (excluding pairs in the local super-cluster). The cumulative distribution of of these pairs is plotted in Fig. C-1. From this distribution, we found that the fraction of pairs with km sec-1 is with a random error of (binomial statistics). It should be pointed out that the distribution is sensitive to the environment and to the pair separation (Ellison et al., 2010). Therefore caution should be taken when applying the result here to other pair samples.
Appendix D Incompleteness and Spurious Pairs Fraction — A Comparison with Spec-z Pairs
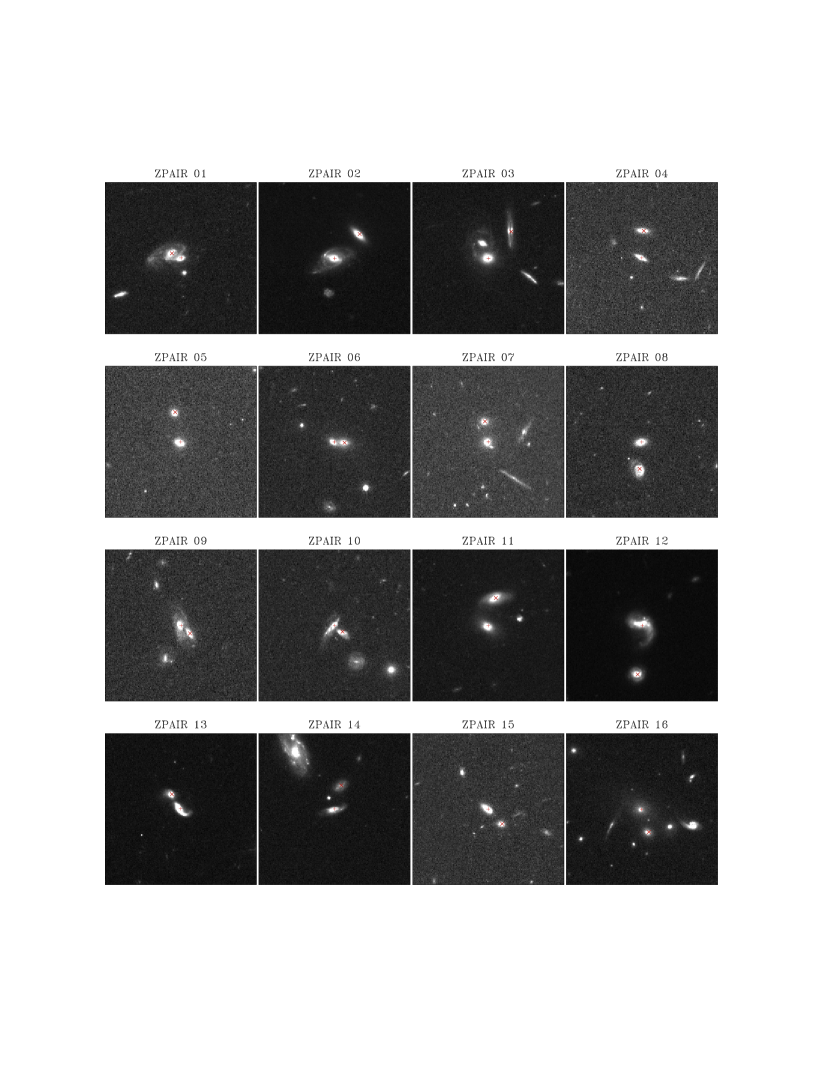
We made a comparison between pairs in the CPAIR sample and a sample of spec-z pairs (ZPAIR sample) selected from the zCOSMOS survey (Lilly et al., 2007). In principle, this comparison applies only to galaxies brighter than , the magnitude limit of zCOSMOS. However, most of galaxies in photo-z pairs are brighter than (Fig. B-2). Images of the 16 pairs in the ZPAIR sample, listed in Table D-1, are shown in Fig. D-1. Among them are all CPAIRs (14) where both components have spec-z’s. They comprise a very small fraction of total CPAIR sample because only 19.5% of galaxies of in the parent sample have spec-z. All but two of the 14 pairs have the velocity difference . This results in an empirical estimate for the SPF of , or a reliability of , with a binomial uncertainty of .
Table D-1 also includes two pairs (ZPAIR-03 and ZPAIR-07) that were missed by CPAIR sample, both having but . As shown in Fig. D-1, the primary of ZPAIR-03 is a close pair itself, and its large error (Table D-1) is likely due to confusion in the photometric data. ZPAIR-07, having , barely missed the cut for the photo-z pairs. Adding the 12 genuine CPAIRs, there are 14 pairs with in the ZPAIR sample. This results in a completeness for the CPAIR sample of , with a statistical error 0.12.
Appendix E Distribution of Primary-to-Secondary Mass Ratio of Close Pairs
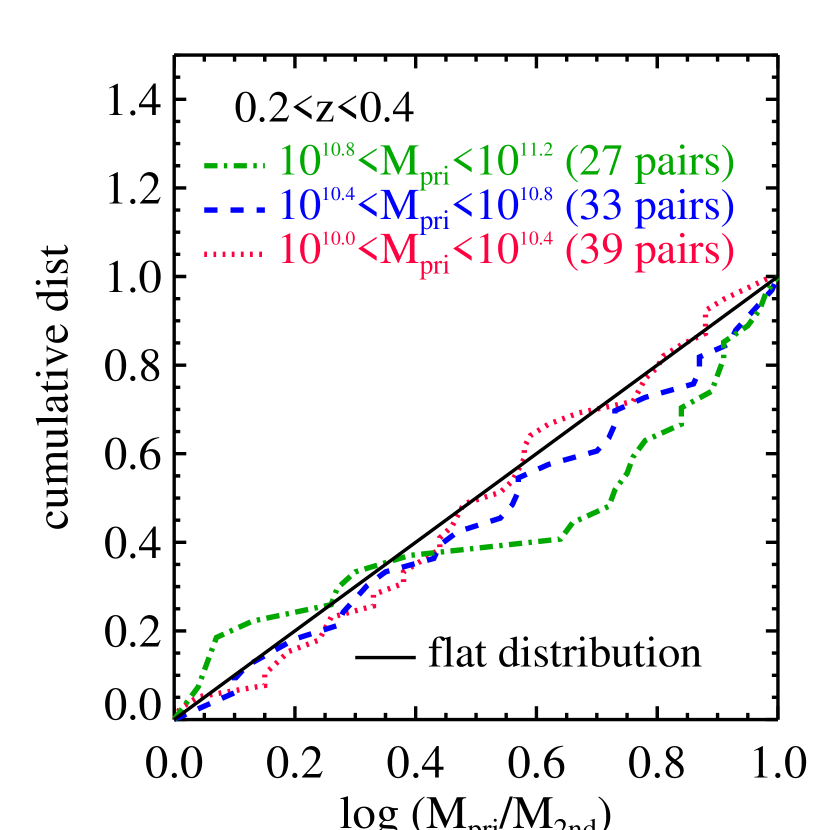
In the parent sample of CPAIR, galaxies in the photo-z bin of form a volume-limited sample above the stellar mass limit . Using this volume limited sample and applying the same pair selection criteria in Section 2 except for expanding the mass ratio limit to , where is the mass ratio, we selected pair candidates (including both major and minor pairs) in three mass bins: , , and . Assuming that completeness and reliability corrections for these pair candidates do not depend on the mass ratio , we calculated the differential and cumulative distributions of these close pairs (). The results are plotted in Fig. E-1. It shows that the flat distribution, i.e. , is a reasonably good approximation. It is worth noting that our result is different from that of Ellison et al. (2010), who found a mass ratio distribution for SDSS pairs that is tilted toward low pairs (i.e. major mergers). However, their result is affected significantly by the “missing secondary” bias, causing severe incompleteness of the minor-mergers in their sample.
| ZPAIR | RA1 | Dec1 | ||||||||||||
|---|---|---|---|---|---|---|---|---|---|---|---|---|---|---|
| ID | () | (degree) | (degree) | () | ||||||||||
| RA2 | Dec2 | |||||||||||||
| (degree) | (degree) | () | ||||||||||||
| 01 | 43 | 149.713610 | 2.019610 | 0.6444 | 4.5 | 0.6518 | 10.92 | |||||||
| 0.012 | 149.713950 | 2.019773 | 0.6441 | 4.5 | 0.6324 | 10.83 | ||||||||
| 02 | 218 | 149.839700 | 1.929228 | 0.3722 | 3.5 | 0.3856 | 10.80 | |||||||
| 0.020 | 149.838780 | 1.930125 | 0.3711 | 4.5 | 0.3585 | 10.76 | ||||||||
| 03† | 70 | 150.009050 | 2.274964 | 0.4726 | 2.5 | 0.5769 | 11.05 | |||||||
| 0.071 | 150.008210 | 2.275954 | 0.4730 | 2.5 | 0.4645 | 10.78 | ||||||||
| 04∗ | 817 | 150.107580 | 2.556516 | 0.5038 | 3.5 | 0.4915 | 10.33 | |||||||
| 0.004 | 150.107510 | 2.557509 | 0.4990 | 3.5 | 0.4969 | 10.21 | ||||||||
| 05 | 73 | 150.115480 | 1.975120 | 0.4385 | 4.5 | 0.4431 | 10.45 | |||||||
| 0.025 | 150.115680 | 1.976216 | 0.4381 | 3.5 | 0.4069 | 10.05 | ||||||||
| 06 | 65 | 150.126060 | 1.913758 | 0.7360 | 2.5 | 0.7168 | 11.17 | |||||||
| 0.003 | 150.125690 | 1.913726 | 0.7365 | 3.5 | 0.7108 | 11.15 | ||||||||
| 07† | 11 | 150.168760 | 2.315481 | 0.8524 | 2.5 | 0.7921 | 10.97 | |||||||
| 0.031 | 150.168890 | 2.316234 | 0.8523 | 1.5 | 0.8473 | 10.94 | ||||||||
| 08 | 220 | 150.196380 | 2.371582 | 0.6834 | 4.5 | 0.6783 | 10.86 | |||||||
| 0.003 | 150.196460 | 2.370591 | 0.6850 | 22.5 | 0.6726 | 10.64 | ||||||||
| 09 | 103 | 150.230880 | 1.845002 | 0.6226 | 2.5 | 0.6072 | 10.67 | |||||||
| 0.014 | 150.230550 | 1.844713 | 0.6233 | 3.5 | 0.5840 | 10.60 | ||||||||
| 10 | 118 | 150.258800 | 1.988773 | 0.7258 | 2.5 | 0.7168 | 10.70 | |||||||
| 0.001 | 150.258510 | 1.988547 | 0.7267 | 2.5 | 0.7191 | 10.32 | ||||||||
| 11∗ | 6318 | 150.359560 | 2.659517 | 0.4309 | 22.5 | 0.3991 | 10.94 | |||||||
| 0.002 | 150.359280 | 2.660543 | 0.3974 | 3.5 | 0.4018 | 10.81 | ||||||||
| 12 | 142 | 150.396810 | 2.519130 | 0.2189 | 24.5 | 0.2283 | 9.97 | |||||||
| 0.003 | 150.396980 | 2.517332 | 0.2195 | 4.5 | 0.2323 | 9.93 | ||||||||
| 13 | 333 | 150.421160 | 2.654335 | 0.2144 | 4.5 | 0.2312 | 9.57 | |||||||
| 0.003 | 150.421480 | 2.654870 | 0.2158 | 4.5 | 0.2271 | 9.21 | ||||||||
| 14 | 118 | 150.457210 | 2.695287 | 0.2189 | 4.5 | 0.2277 | 9.45 | |||||||
| 0.008 | 150.456970 | 2.696160 | 0.2194 | 4.5 | 0.2184 | 9.07 | ||||||||
| 15 | 219 | 150.494640 | 2.187936 | 0.3695 | 4.5 | 0.3674 | 9.97 | |||||||
| 0.007 | 150.494120 | 2.187388 | 0.3684 | 3.5 | 0.3772 | 9.58 | ||||||||
| 16 | 196 | 150.504990 | 2.225083 | 0.8374 | 22.5 | 0.8360 | 11.72 | |||||||
| 0.002 | 150.504730 | 2.224246 | 0.8357 | 2.5 | 0.8315 | 11.34 |
Note. —
-
Missing in the CPAIR sample.
-
Spurious pairs (with ) in the CPAIR sample.