A search for naphthalene in diffuse interstellar clouds
Abstract
We have obtained high resolution optical spectroscopy of 10 reddened O-type stars with UVES at VLT to search for interstellar bands of the naphthalene cation (C10H8+) in the intervening clouds. No absorption features were detected near the laboratory strongest band of this cation at 6707 Å except for star HD 125241 (O9 I). Additional bands in the optical spectrum of this star appear to be consistent with other transitions of this cation. Under the assumption that the bands are caused by naphthalene cations we derive a column density N = (1.2 0.3) x 10 13 cm-2 similar to the column density claimed in the Perseus complex star Cernis 52 (Iglesias-Groth et al. 2008). The strength ratio of the two prominent diffuse interstellar bands at 5780 and 5797 Å suggests the presence of a -type cloud in the line of sight of HD 125241.
keywords:
ISM:molecules—ISM:lines and bands—ISM:abundances1 Introduction
The detection of discrete infrared emission bands near 3.3, 6.2, 7.7, 8.6, 11.3 and 12.7 m, in dusty environments excited by UV photons led to the suggestion that polycyclic aromatic hydrocarbons (PAHs) were present in the interstellar medium (Léger & Puget 1984, Allamandola et al. 1985). These infrared bands are due to C-C and C-H stretching and bending vibrations in an aromatic hydrocarbon material. Since these bands mostly probe specific chemical bonds and not any particular molecular structure, they cannot proivde unambiguous identification of single PAHs. The naphthalene cation (C10H8+) is the most simple PAH and one of the best characterized spectroscopically in low-temperature gas phase at laboratory (Pino et al. 1999, Romanini et al. 1999). The laboratory characterization, crucial for a potential identification in the interstellar medium, shows that the strongest optical band of the naphthalene cation is located at 6707.4 Å with a full width at half maximum (FWHM) of approx. 12 Å. Progressively weaker bands of similar width have been measured at 6488.9, 6125.2 and 5933.5 Å(Biennier et al. 2003). Iglesias-Groth et al. (2008) reported the detection of weak absorption ( less than 1.5 % of the continuum) broad optical bands in the spectrum of the star Cernis 52 (A3 V, Cernis 1993) which appear to be consistent with the measured laboratory bands of the naphthalene cation. González Hernández et al. (2009) show that the detected bands are too broad to be originated in the photosphere of this star.

Cernis 52 is located behind or embedded in a molecular cloud in the Perseus star forming complex (one of the nearest to the Sun) that causes moderate extinction (AV= 3 mag). This cloud presents millimetric emission (Enoch et al. 2006) and anomalous microwave (10-70 GHz) emission (Watson et al. 2005) which can be caused by electric dipole radiation of fast spinning PAHs in the intervening cloud (Draine and Lazarian 1998, Planck collaboration 2011m). It is possible that this anomalous microwave emission region in Perseus has an enhanced abundance of PAHs with respect to the diffuse interstellar medium or that the feature is of circumstellar origin and therefore that we are considering a rather peculiar star. Detection of bands of the naphthalene cation in other lines of sight could show whether this is indeed an exceptional case. Alternatively, if this is a common feature in interstellar clouds, the hypothesis that some of the ubiquituous diffuse interstellar bands (DIBs) are caused by PAHs would be reinforced. So far there is no firm identification of a PAH as responsible of DIBs (Sarre 2006).
With the goal to investigate the presence of naphthalene cations in diffuse clouds we have obtained optical spectra of high resolution and high signal-to-noise of 10 early-type stars with E(B-V) in the range 0.5 to 1.7 (see Table I). There is no report of anomalous microwave emission for any of the lines of sight of the stars in our sample. We detect the presence of broad absorption features in star HD 125241 with wavelengths and widths consistent with those of the strongest optical bands of the naphthalene cation. Upper limits to the strength of these bands are set for the other lines of sight.
| Star | Spectral type | E(B-V) | V | S/N |
|---|---|---|---|---|
| HD114213 | B1Ib | 1.11 | 8.97 | 690 |
| HD125241 | 09Iab | 0.76 | 8.23 | 670 |
| HD142468 | B0.5IB2 | 0.78 | 7.88 | 530 |
| HD147889 | B2III,IV | 1.03 | 7.90 | 520 |
| HD157038 | B1/B2Ia | 0.81 | 6.71 | 560 |
| HD159176 | O6V | 0.36 | 5.68 | 224 |
| HD166734 | 07.5If | 1.36 | 8.42 | 500 |
| HD167971 | 08,09f | 1.04 | 7.46 | 250 |
| HD168607 | B9Iap | 1.65 | 8.28 | 400 |
| HD176162 | B4V | 0.11 | 5.5 | 550 |
| Star | 5780 | 5797 | 6113 | 6196 | 6203 | 6270 | 6284 | 6376 | 6379 | 6613 | |
|---|---|---|---|---|---|---|---|---|---|---|---|
| HD114213 | 332 (3) | 111 (5) | 13 (1) | 39 (2) | 70 (4) | 42 (5) | 540 (60) | 31 (2) | 52 (2) | 157(5) | |
| HD125241 | 526 (10) | 109 (5) | 9 (1) | 56 (2) | 131 (5) | 107 (5) | 1086 (90) | 45 (2) | 69 (2) | 208 (4) | |
| HD142468 | 449 (10) | 115 (5) | 14 (1) | 55 (2) | 75 (4) | 87 (5) | 1176 (90) | 25 (2) | 70 (2) | 185 (5) | |
| HD147889 | 347 (8) | 144 (5) | 12 (1) | 39 (2) | 80 (5) | 25 (4) | 389 (50) | 60 (2) | 86 (2) | 185 (5) | |
| HD157038 | 413 (8) | 93 (5) | 7 (1) | 45 (2) | 200 (8) | 74 (5) | 1147 (90) | 26 (2) | 136 (4) | 161 (5) | |
| HD159176 | 161 (5) | 41 (4) | 7 (2) | 25 (2) | 31 (3) | 25 (4) | 224 (30) | 7 (1) | 29 (2) | 66 (4) | |
| HD166734 | 687 (15) | 250 (8) | 48 (3) | 89 (4) | 227 (8) | 181 (8) | 1209 (90) | 99 (8) | 220 (2) | 398 (7) | |
| HD167971 | 530 (20) | 149 (5) | 31 (3) | 16 (2) | 100 (8) | 122 (6) | 1073 (95) | 45 (3) | 92 (4) | 241 (9) | |
| HD168607 | 796 (36) | 273 (8) | 25 (2) | 72 (3) | 149 (5) | 134 (6) | 1398 (95) | 57 (2) | 152 (4) | 342 (8) | |
| HD168625 | 818 (25) | 209 (8) | 37 (3) | 88 (4) | 146 (5) | 185 (7) | 993 (80) | 88 (3) | 191 (3) | 434 (7) |

2 Observations
The data presented here are based on observations conducted with the UV-Visual Echelle Spectrograph (UVES) fed by the VLT (Kueyen unit) of the ESO Paranal Observatory, Chile. The observed stars, their V magnitude, their E(B-V) colour excesses, and the final signal-to-noise ratio (S/N) measured near 6750 Å, are listed in Table 1. The spectral range was set to investigate the presence of the four strongest optical bands of the naphthalene cation. Each exposure provided nearly complete spectral coverage from about 5000 to 7000 Å, at a resolving power R 80000. The maximum S/N per pixel that can be achieved in a single exposure is limited by the nonlinearity of the detector. Several spectra (typically between 10 and 20) were obtained for each star in an attempt to achieve the desired S/N in the summed spectrum. Total integration times per star ranged from 1 min to 3 min depending on its visual magnitude. The many individual exposures were processed and reduced using the standard UVES Data reduction package (ESO). When a spectral range required correction for telluric lines, each individual spectrum was divided by a featureless spectrum of a hot fast rotating star observed with the same instrument configuration. The spectra of a given star were combined using the task scombine in IRAF and subsequently normalized to unity. The nomalization was carried out with the task combine of this package using low order Legendre polynomials. The continuum regions were selected outside photospheric features and known diffuse interstellar bands and telluric lines. Alternative normalization was also investigated using a cubic spline fit. The results in both cases were similar. The profiles of the Na I doublet were examined for the existence of more than one dominating Doppler component visible in our high resolution and high S/N spectra. Fig. 1 shows this spectral range for each star in the sample.
3 Results and Discussion
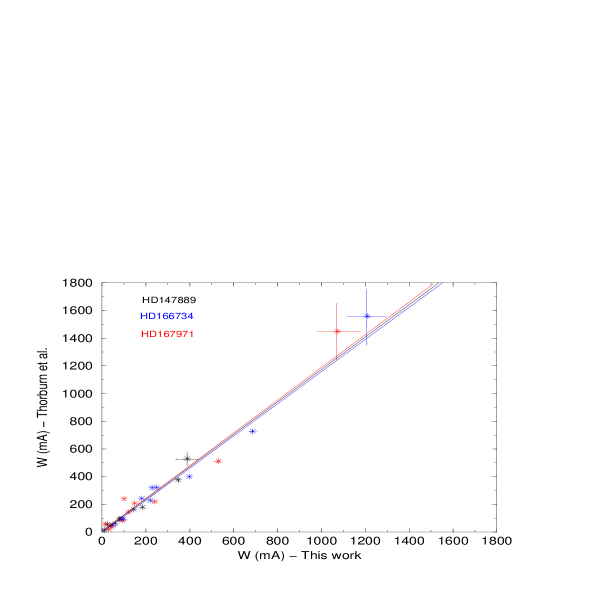
In Table 2 we report equivalent widths (W) for a set of well known DIBs present in the spectra of our stars. We used the IRAF splot task to either fit a Gaussian profile to the band (whenever this was suitable) or to integrate the band with respect to the pseudocontinuum. The uncertainties of the equivalent widths were estimated with the same task, taking into account the S/N in the relevant region of the spectrum and the uncertainty in the location of the continuum and in the shape of the band. In general these errors (listed in Table 2 are larger than those derived from the formula = 1.064 x FWHM / (S/N) (see e.g. Hobbs et al. 2009) which strictly refers to a band of Gaussian shape. We tested our error determination measuring separately in averaged subsets of spectra for each star and calculating the rms deviation of the equivalent widths. High resolution spectroscopy for several stars in our sample is available in the literature and DIB equivalent widths have been previously reported (see e.g. Thorburn et al. 2003). A comparison with previous measurements for our stars it is made in Fig. 2. In general good agreement is found for most of the DIBs with the largest differences in W being of order 20 % for the strongest and broadest bands where errors are dominated by the uncertainty in the location of the continuum.
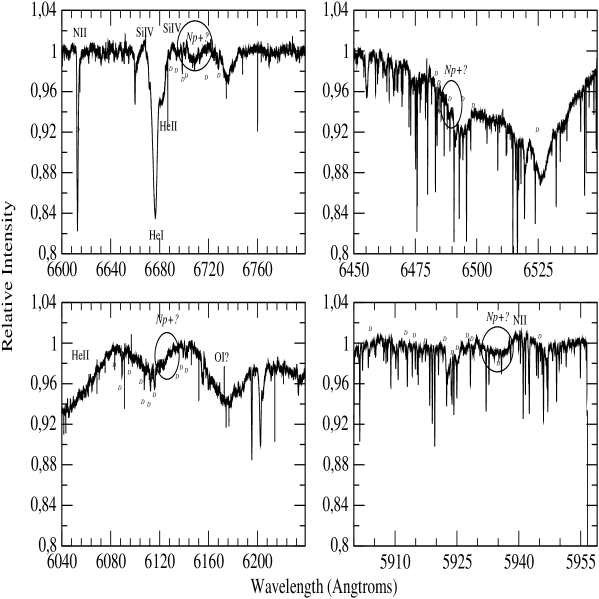
In Fig. 3 we plot the final spectra in the region of the strongest optical band of the naphthalene cation. The zero-point of the wavelength scale adopted here is set by assigning the DIB wavelengths listed by Hobbs et al. (2008) to the DIBs detected in our spectra. No obvious broad absorptions are detected at the wavelength of the strongest optical band of the naphthalene cation (6707 Å), except in the case of HD 125241 where a broad absorption appears to be present from approximately 6700 to 6720 Å. HD 125241 is classified as spectral type O9. We note the similarity of the spectra of HD 125241 and HD 167971 (spectral type O8-9) also plotted in Fig. 3. In the spectral range of this figure, the most remarkable features in common between these two stars are: the He II 6683 absorption band and a broad absorption at 6736 Å whose origin is not well established. There are also weaker features in both stars associated with the DIBs at 6699 and 6729 Å and the SI IV emission line at 6701 Å. HD 167971 has been extensively studied in the literature, Thorburn et al. (2003) provide equivalent widths for numerous narrow DIBs in this star which compare well in strength with the values listed in Table 2. If the feature at 6707 Å were related to the most intense band of the naphthalene cation we would expect to find other bands of this cation in the spectrum. We plot in Fig. 4 the spectrum of HD 125241 in a broad region around each of the four relevant bands. Since the expected widths of the naphthalene bands are of order 12 Å according to laboratory measurements we plot spectral ranges at least 10 times larger. In panel a) we see a complex set of features with He I in absorption as the dominant at 6678 Å and the emission lines of Si IV at 6668 and 6701 Å and the already noticed He II absorption at 6683 Å. These Si IV lines are detected in other stars (HD 94963, HD 163758 HD 188001) and are likely formed under non-LTE in an extended atmosphere. We also note the weak emission line of N II at 6610 Å and that other weak emission lines of N II are present in the 5940-5942 Å range as can be seen in panel d) of the figure. Outside these emission line regions the spectrum looks normal with many narrow and some broad absorptions that can be mostly abscribed to well known DIBs (listed in Table 2). The other two remarkable features in panel a) are the absorptions at 6736 and 6707 Å. For the first one, we have no plausible explanation, we just note that in the atlas of star HD 183143 by Hobbs et al. (2009) there is a swath of DIBs around this wavelength, and for the second, we discuss below if it can be due to the strongest band of the naphthalene cation.
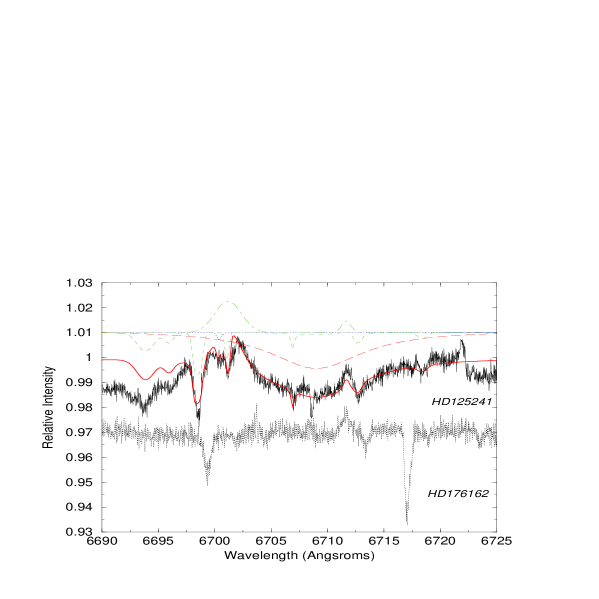
In Fig. 5, we provide an expanded view of the spectrum of HD 125241 in the region of the 6707 band and compare with the spectrum of HD 176162, a fast rotating star with a rather flat continuum in this region, observed with the same spectrograph configuration. The comparison with this star, but also with other stars in our sample, indicates that the absorption detected in HD 125241 between 6700 and 6720 Å is not due to any systematic effect. The narrow DIBs at 6699.32, 6702.02 and 6709.43 Å are clearly present in both spectra (note that the wavelength scale has been adopted to match the wavelengths listed by Hobbs et al. (2008) for these DIBs). In addition we detect the interstellar lithium doublet at 6707.8 Å in the spectrum of HD 125241. This is a narrow weak feature at the expected wavelength. The total equivalent width of the interstellar Li line is 41 mÅ. The broad absorption between 6700 and 6720 Å seems to be distorted by two possible emission features at approximately 6701 and 6712.5 Å, respectively, which appear to be of photospheric origin. The Si IV 6701 Å emission is significantly stronger with a bandwidth of 2 Å. In the Figure we plot the synthetic photospheric spectrum of a star with similar spectral type to that of HD 125241 from Tuairisg et al. (2000). The only relevant photospheric feature is an absorption precisely at 6702 Å, we argue that this feature may appear in emission in our star due to different physical conditions in its atmosphere. We reproduce the emission features at 6701 and 6712 Å using Gaussians. The latter emission line, of uncertain origin, is also seen in the spectrum of the comparison star plotted at the bottom of Fig. 5. We also plot a synthetic DIB spectrum using the list provided by Hobbs et al. (2008) and scaling the features in strength to match those observed in our spectrum. The features are scaled individually to obtain a best fit to the observed DIBs but we note that a similar scaling is required for most of them. All the DIBs in this spectral range are narrow (FWHM 0.8 Å), so neither the pure photospheric or the pure DIB theoretical spectrum can reproduce the observed 6707 broad feature in HD 125241. We now explore whether an additional band with the characteristics of the naphthalene cation 6707.4 Å band (FWHM=12 Å) can provide a better description of the 6700-6720 Å region of the spectrum. The dashed line in the figure shows that the band which would best fit the observation has a maximum depth 1.4 %. The continuous red line is the combination of this naphthalene band plus the stellar photospheric spectrum (including the two emission lines mentioned above) and the DIB synthetic spectrum. The combination provides a good description of the observations in the region 6700-6720 Å (with reduced -squared of 1.06). The total equivalent width of this tentative cation band would be W(6707)= 24050mÅ. We also verified that the adoption of the list of DIBs by Hobbs et al. (2009),which is based on a different stellar atlas, leads to very similar fits.
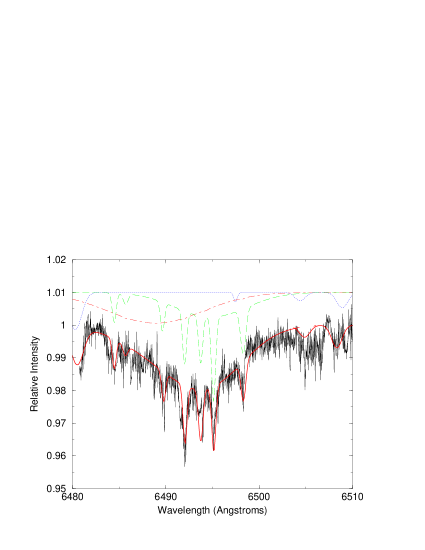
If the absorption seen at 6707 Å were due to naphthalene cations in the interstellar or circumstellar medium in the line of sight of HD 125241, then according to Biennier et al. (2003) we should expect the presence of broad absorption bands at 6488.9, 6125.2 Å and 5933.5 Å albeit weaker than the 6707 band by a factor 2,4 and 8, respectively. The precision of the laboratory wavelength of these bands is 0.5 Å. In Fig. 5 we plot the three relevant spectral regions for HD 125241. Adopting these wavelengths and a width of 12 Å we compute the theoretical naphthalene cation bands and plot them in the top, middle and bottom panels of Fig. 5 (dashed lines). We also account for the known DIBs in these spectral ranges (green dashed lines) and synthetic photospheric lines (dotted blue lines).
In the range 6480-6500 Å, there is a broad absorption in the spectum of the star. The synthetic photospheric spectrum clearly denotes that most of the absorption in this spectral range is of interstellar or circumstellar origin. A very significant contribution comes from the well known DIB at 6494.05 (FWHM9 Å) which has been detected in many lines of sight (see e.g. Hobbs et al. 2008, 2009). It is difficult to disentangle the contribution of this DIB from the potential absorption at 6489 Å produced by the naphthalene cations, but a combination of our predicted naphthalene cation band (dashed red line with maximum absorption of 0.7 %) with the DIB synthetic model (green continuous line) plotted in the figure seems to reproduce well (with reduced -squared of 1.06) the observations in this spectral range.
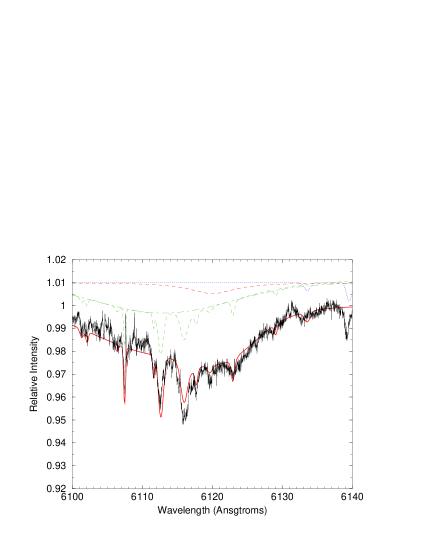
In order to study the presence of the third strongest band of naphthalene, at the middle panel of Fig. 5 we plot our prediction for this band scaling from the 6707 Å band (red dashed line) as indicated above. After combining with the known DIBs (green dashed line) and the stellar photospheric spectra (dotted blue line) we compare with the observations (red solid line). There are no significant stellar photospheric bands in this spectral range, neither strong DIBs. Two narrow DIBs are clearly seen at 6113 and 6117 Å which are helpful to set precisely the wavelength scale of interstellar absoprtions. We produce a synthetic DIB model using the information in Hobbs et al. (2008) which reproduces well the two narrow DIBs. The observed spectrum can be reproduced by a combination of these DIBS with two new broad band features at 6113 and at 6124 Å (with reduced -squared of 1.9). The latter coincides in wavelength and intensity with the values expected for the third band of the naphthalene cation.
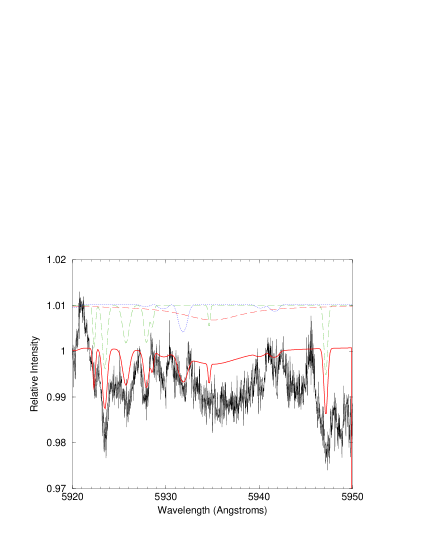
Finally, at the bottom panel of Fig. 5. we investigate the presence of the fourth and weakest naphthalene cation band at 5934.5 Å. This is a band particularly difficult to address since the maximum depth we expect is about 0.2 % of the continuum. As in the other panels of the figure we plot the synthetic photospheric spectrum, the DIB synthetic spectrum and the predicted scaled naphthalene cation band. The combination of the three leads to the continuous red line. The model does provide a poor fit according to the -squared value. A broad absorption band seems to be present in the observed spectrum at the expected location of the fourth naphthalene band, so the presence of naphthalene is possible, but other additional bands of unknown nature are likely contributing to the strength of the observed feature.
In summary, the characteristics of the absorption features found in the spectral ranges of the four strongest optical bands of the naphthalene cation are consistent with the presence of these molecules in the intervening cloud in the line of sight of HD 125241. Adopting for the oscillator strength of the transition at 6707.4 Å a value of f=0.05 (Pino et al. 1999) and using the measured equivalent width of the band, we derive as in Iglesias-Groth et al. (2008) a column density of N (1.2 0.3) x 1013 cm2. This is a very similar value to that found in the line of sight of Cernis 52. For the remaining stars in our sample we can set upper limits to the column density which vary from one star to other depending on the S/N in the relevant spectral region. As listed in Table 1 most of the stars have S/N of order 500. This means that bands at 6707 Å with maximum depth 1 % would have been detected in most cases with high level of confidence. We set upper limits of N 5 x 1012 cm2 for the intervening clouds in the other lines of sight.

The extinction in HD 125241 is similar to that of Cernis 52, but the equivalent widths and profiles of the 5780 and 5797 DIBs in HD 125241 (see Fig. 6) indicate that the intervening cloud is of type while in Cernis 52 is of -type. It is important to carry out a detailed characterization of the physical parameters and molecular material in this new cloud. In the case of the intervening cloud towards Cernis 52, spectroscopy of the C2 bands (Iglesias-Groth 2010a) and CH, CH+ (Iglesias-Groth et al. 2010b) indicate a rather high abundance of these molecules. The physical and chemical conditions may be suitable for formation of PAHs. Unfortunately very little is known about the cloud in HD 125241 and CH and CH+ transitions are not covered by our spectra neither the strongest series of C2. Only the (4,0) Phillips series is present in our spectrum but the transitions are too weak preventing any reliable measurement of the gas kinetic temperature.
Interestingly, there are four clouds identified using Spitzer images in the field of the star HD 125241, they are located at angular distances of 1.3, 5.1, 6.9 and 7.5 arcmin from the star (Peretto & Fuller 2009). The angular size of the cloud at a closer angular distance seems to be only 0.1 arcmin, and therefore, without more information it is not possible to abscribe the absorption features detected in the spectrum to this cloud. Inspection of IRAS data shows that HD 125241 is among the stars in our sample with higher dust emission in the light of sight.
Very recent work by Galazutdinov et al. (2011) confirms the presence of a broad band at 6708 Å in the spectrum of the star Cernis 52. The significantly lower S/N of their spectrum with respect the one obtained by Iglesias-Groth et al. (2008) at the 9m HET telescope prevents that these authors detect other weaker bands of naphthalene in Cernis 52. They obtained however high S/N spectra for other brighter and reddened stars where they do not find evidence for any broad absorption at 6707-08 Å. . We do find a similar result in the search carried out here. Only one over 10 stars may present a broad absorption at 6707-08 Å which could be caused by naphthalene cations. Similarly, the search carried out by Searles et al. (2011) has not provided any clear detection of this band in other lines of sight, these authors set stringent upper limits to the column density of naphthalene cations and note that a weak broad absorption may exist in just a few cases. In summary, the broad feature first detected in Cernis 52 appears to be rather uncommon. While it is possible that in certain clouds the column density of these cations is high enough to allow detection, we cannot discard the possibility that such feature originates in the circumstellar environment of Cernis 52 and of HD 125241 because of special circumstances that may lead to a rich PAH chemistry. It is important to conduct additional studies of these two stars and their environments in order to establish if this is the case.
4 Conclusions
We have searched for the strongest optical transition of the naphthalene cation at 6707 Å in the spectra of 10 reddened O and B type stars. We find evidence for a broad absorption which could be associated to this band only in the case of the O9 I star HD 125241 which displays a broad absorption band at 6707 Å consistent in wavelength and FWHM with laboratory measurements of the strongest optical band of the naphthalene cation. Weaker bands of this cation seem to be present in the spectrum of this star with consistent strength at 6489, 6125 and 5934 Å. Assuming that these bands are indeed caused by the naphthalene cations we derive a column density of N = (1.2 0.3) x 1013 cm2. The diffuse interstellar bands at 5780 and 5797 support the presence of a sigma-type cloud in the line of sight of this star.
In the other stars of the sample we set upper limits to this column density a factor 2-3 lower in spite of the higher extinction associated with several of the intervening clouds. Additional studies of the intervening cloud and circumstellar environment in HD 125241 may provide valuable information on the physical and chemical conditions that may govern an active formation of PAHs.