NEON INSIGHTS FROM OLD SOLAR X-RAYS: A PLASMA TEMPERATURE DEPENDENCE OF THE CORONAL NEON CONTENT
Abstract
An analysis using modern atomic data of fluxes culled from the literature for O VIII and Ne IX lines observed in solar active regions by the P78 and Solar Maximum Mission satellites confirms that the coronal Ne/O abundance ratio varies by a factor of two or more, and finds an increase in Ne/O with increasing active region plasma temperature. The latter is reminiscent of evidence for increasing Ne/O with stellar activity in low-activity coronae that reaches a “neon saturation” in moderately active stars at approximately twice the historically accepted solar value of about 0.15 by number. We argue that neon saturation represents the underlying stellar photospheric compositions, and that low activity coronae, including that of the Sun, are generally depleted in neon. The implication would be that the solar Ne/O abundance ratio should be revised upward by a factor of about two to NeO. Diverse observations of neon in the local cosmos provide some support for such a revision. Neon would still be of some relevance for reconciling helioseismology with solar models computed using recently advocated chemical mixtures with lower metal content.
1 Introduction
Interest in Neon, the newcomer, has been strongly piqued recently by two possibly related puzzles concerning the value of the Ne abundance in the Sun and stars. In a study of 21 mostly magnetically active stars observed by the Chandra high resolution X-ray spectrometers, Drake & Testa (2005) found Ne/O abundance ratios to be consistently higher by a factor of 2.7 than the recommended solar value of the time, Ne/O=0.15 by number111Throughout we use the notation Ne/O to refer to the ratio by number of Ne to O nuclei, rather than the implicit logarithmic abundance ratio sometimes used.. The latter value is traceable to the assessment of Anders & Grevesse (1989).
Drake & Testa (2005) suggested that the same ratio might also be appropriate for the Sun and help solve the “Solar Model Problem”. Models employing a recently advanced solar chemical composition based on 3-D non-LTE hydrodynamic photospheric modelling (Asplund et al., 2005) led to predictions of the depth of the convection zone, helium abundance, density and sound speed in serious disagreement with helioseismology measurements (Basu & Antia, 2004; Bahcall et al., 2005a). The Asplund et al. (2005) mixture contained less of the elements C, N, O and Ne that are important for the opacity of the solar interior by 25-35 % compared to earlier assessments (e.g. Anders & Grevesse, 1989; Grevesse & Sauval, 1998). Antia & Basu (2005) and Bahcall et al. (2005b) suggested the uncertain solar Ne abundance might be raised to compensate. The estimated Ne/O ratio required was in agreement with that found in stellar coronae by Drake & Testa (2005).
More detailed investigations of helioseismology models now suggest that raising the Ne abundance alone cannot fully reconcile models and observations (Delahaye & Pinsonneault, 2006; Lin et al., 2007; Delahaye et al., 2010). Nevertheless, the Ne abundance still remains an important individual ingredient, not only for the Sun but also for nucleosynthesis and galactic chemical evolution.
Ne exhibits no lines in the visible light spectra of late-type stars and is not retained in meteorites. Consequently, the solar abundance is based largely on transition region and coronal lines, and energetic particle measurements, supplemented with local cosmic estimates (e.g. Meyer, 1985; Anders & Grevesse, 1989; Asplund et al., 2009). Two studies of transition region EUV and coronal X-ray lines find consistency with the ratio Ne/O=0.15 (Young, 2005; Schmelz et al., 2005) and conclude that this ratio represents that of the bulk of the Sun. However, based on UV lines observed during a flare Landi et al. (2007) obtained an absolute abundance Ne/H a factor of 1.9 larger than the Asplund et al. (2005) value. Subsequently, the latter authors have revised their recommended Ne and O abundances back up toward older values by 0.13 and 0.07 dex, respectively (Asplund et al., 2009), raising their favoured absolute logarithmic Ne abundance to Ne/H and Ne/O ratio to 0.17—just within formal agreement with the Landi et al. (2007) Ne abundance, but still somewhat short of the Drake & Testa (2005) Ne/O ratio.
Another important clue to the solar neon content is provided by past coronal X-ray Ne/O measurements. Results reviewed by Drake & Testa (2005) showed considerable scatter, and an extensive study of active regions has demonstrated variations in the coronal Ne/O ratio by factors of more than 2 (McKenzie & Feldman, 1992). Such variations indicate coronal fractionation of Ne relative to O by mechanisms that are not yet firmly identified or understood, and cast serious doubt on the validity of conclusions based on a simple average of observed values to infer the Ne content of the Sun.
The variation in observed solar Ne/O ratios motivates re-examination of existing observations using modern atomic data for further insights into the behaviour of Ne in the solar outer atmosphere. Unfortunately, some earlier studies of Ne in the solar X-ray spectrum did not list spectral line fluxes, rendering re-analysis somewhat difficult. Observations made between 1979 March 23 and November 29 by the SOLEX spectrometer on the US Department of Defense P78-1 satellite analysed by McKenzie & Feldman (1992), and the recent study by Schmelz et al. (2005) of Solar Maximum Mission (SMM) Flat Crystal Spectrometer (FCS) observations obtained between 1986 May 20 and 1987 December 18 are two exceptions that form the basis of this work.
2 Analysis
2.1 Methods and Atomic Data
The analysis presented here is similar to that originally applied to Ne and O lines by Acton et al. (1975), and duplicated in successive papers including McKenzie & Feldman (1992) and Schmelz et al. (2005) (see also Drake & Testa 2005): Ne/O abundance ratios are inferred from observed ratios of the intensities of the transitions Ne IX and O VIII and comparison with theoretical predictions.
Line intensities were taken from Table 2 of McKenzie & Feldman (1992) and Table 2 of Schmelz et al. (2005). One possible complication to the analysis of the Ne IX line is the potential presence of Fe XIX blends (see, e.g. Ness et al., 2003); both McKenzie & Feldman (1992) and Schmelz et al. (2005) take pains to note this and assess that for their non-flaring spectra such blends are negligible. This assessment is verified below when specific account of the Fe XIX contribution to Ne IX is taken.
The theoretical Ne IX/O VIII line ratio has significant temperature dependence and derivation of an abundance ratio from a measured flux ratio requires an estimate of temperature (see Drake & Testa, 2005, for a more temperature-insensitive ratio using both Ne IX and Ne X lines). McKenzie & Feldman (1992) utilised the ratio of Fe XVIII and Fe XVII as a temperature diagnostic. They list the line fluxes which we use here to re-derive temperatures using the atomic data noted below. Schmelz et al. (2005) used the same Fe XVIII lines combined with Fe XVII but omit measured fluxes and only list their derived temperatures which we employ directly. Questions have been raised in the past regarding possible optical depth of Fe XVII due to resonance scattering: Brickhouse & Schmelz (2006) have recently concluded the line is consistent with being optically thin in FCS observations of active regions, and attribute apparent quenching to Fe XVI blends in the neighbouring Fe XVII line often used as an optically thin comparison.
Spectral line fluxes were analysed using the PINTofALE222PINTofALE is freely available from http://hea-www.harvard.edu/PINTofALE/ IDL333Interactive Data Language, Research Systems Inc. software (Kashyap & Drake, 2000), employing collisional excitation rates and energy levels from the CHIANTI database v6.0.1 (Landi et al., 2006; Dere et al., 1997, and references therein), together with the ionization fractions as function of temperature from Bryans et al. (2009). The sensitivity of the results to the adopted atomic data was also investigated.
2.2 Ne/O Line Ratios
2.2.1 Isothermal Analysis
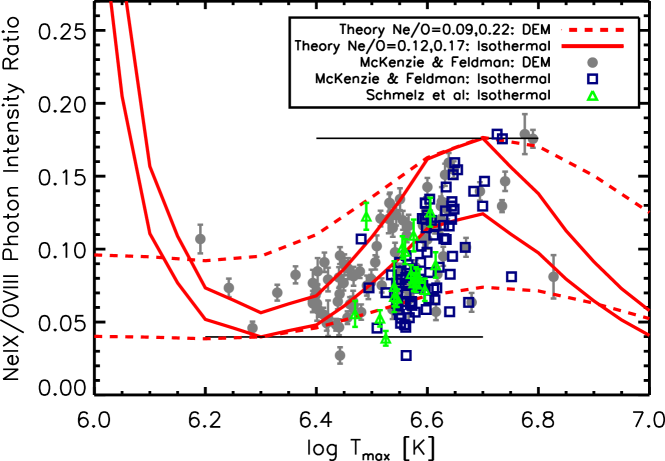
We first illustrate in Figure 1 the McKenzie & Feldman (1992) and Schmelz et al. (2005) Ne/O line ratios (in photon units) as a function of the isothermal plasma temperature. Uncertainties in the temperatures, both from Schmelz et al. (2005) and derived here using the McKenzie & Feldman (1992) Fe XVII and Fe XVIII line fluxes and measurement uncertainties, amount typically to no more than 0.05-0.1 dex and are omitted for clarity. The McKenzie & Feldman (1992) and Schmelz et al. (2005) Ne/O flux ratios are consistent with one another and follow a steep, approximately linear, trend of increasing ratio with increasing temperature.
We now examine whether the data simply reflect the temperature dependence of the Ne IX/O VIII line ratio and are consistent with a single Ne/O abundance ratio. To do this, we first compare the observed flux ratios with the theoretical ratio computed as a function of the isothermal plasma temperature. This comparison assumes the individual observations also correspond to isothermal plasma; this is strictly not likely to be the case and we return to this later in Section 2.2.2.
The theoretical line intensity ratio depends linearly on the assumed Ne/O abundance ratio, and a single theoretical intensity ratio vs temperature locus was found to be a poor match to the observed data for any single adopted Ne/O abundance ratio. In Figure 1 we illustrate this by showing two theoretical isothermal intensity ratio curves corresponding to two different Ne/O abundance ratios. These curves are analogous to both the upper panel in Figure 1 of Acton et al. (1975), and the curves bounding the line flux ratios in Figure 10 of McKenzie & Feldman (1992). The Ne/O abundance ratio for the lower curve (Ne/O=0.12) is such that the minimum theoretical photon intensity ratio reached matches the minimum observed ratio, excluding the most extreme observed point. The abundance ratio for the upper curve (Ne/O=0.17) is such that the maximum theoretical photon intensity ratio reached matches the maximum observed ratio, again excluding the most extreme observed point. Note that there are still observed photon intensity ratios that lie below the lower theoretical ratio curve and one that lies slightly above the upper one: in principle, these could be made to fit within the two curves were there to be some source of additional error in the derived plasma temperatures which allowed the points to be shifted arbitrarily to the left or right. In this way, the two curves represent the minimum possible spread in Ne/O abundance ratio (Ne/O=0.12 and 0.17) that can match the data. The separation of the two curves is much greater than the statistical errors in the data, and we conclude that the observed intensity ratios cannot be explained by a single Ne/O abundance ratio.
The trend of the observed intensities with temperature is also much steeper than the theoretical ratio. If the observed intensities are from isothermal plasma, this indicates a trend of increasing Ne/O abundance ratio with temperature.
2.2.2 DEM Analysis
The fields of view of the SOLEX and FCS instruments from which the observations analysed here were obtained were 1 arcmin and 15 arcsec across, respectively (McKenzie & Feldman, 1992; Schmelz et al., 2005). It is likely than in regions of this size the observed plasma is not isothermal. Any deviation from isothermality tends to flatten out the theoretical line intensity ratio curves. We investigate this quantitatively using a model continuous differential emission measure distribution (DEM).
For the DEM model, we adopted the form , where is the volume occupied by material with electron density at temperature . was approximated by a combination of two power laws bridged by a constant flat top:
| (1) |
where the DEM peaks at a temperature between ,
| (2) |
and is the rectangular function
Here, and are constants describing the steepness of the rise of the DEM for and its subsequent decay for . Constant conductive loss models and quasi-static, constant cross-section uniformly heated loop models have the well-known power law slope in the case when coronal structures are small compared to the pressure scale height (e.g. Jordan et al., 1987). Observations indicate that active regions can be characterized by much steeper ; e.g. Drake et al. (2000) found for the brightest solar active regions and the coronae of the intermediate activity stars Boo A and Eri.
The observed line intensity for a transition in species with an abundance in a plasma with an DEM characterized by a peak temperature can be written
| (3) |
where is the effective line emissivity. We can use theoretical line fluxes as a function of the characteristic temperature, , calculated using Equation 3 in a similar way to the use of isothermal fluxes described above in Section 2.2.1. As an illustrative case, we adopted , with a small flat-topped maximum of width in . Using this model DEM and the McKenzie & Feldman (1992) Fe XVII and FeXVIII line intensities, we computed the DEM peak temperature, , corresponding to all the different observations, as for the isothermal case. The McKenzie & Feldman (1992) Ne/O line intensity ratios are illustrated as a function of this as grey points in Figure 1. Overlaid are two dashed curves representing the multi-thermal DEM theoretical Ne IX/O VIII line intensity ratios as a function of the DEM peak temperature . These two curves correspond to two Ne/O abundance ratios (Ne/O=0.09 and 0.22) chosen in the same way as for the isothermal case described in Section 2.2.1: these dashed curves are the multi-thermal equivalent of the isothermal ones illustrated as solid curves. They represent the minimum spread in Ne/O that can explain the observations and demonstrate that under multi-thermal conditions the data cannot be explained by a single Ne/O abundance ratio.
The multi-thermal intensity ratio curves are relatively insensitive to the adopted values of , and : as slopes and tend toward much higher values, the curve approaches the isothermal case; for much shallower slopes and larger values of , the curve simply becomes flatter, tending toward the constant ratio of line emissivities integrated over all temperatures. The smoother multi-thermal theoretical intensity ratios require a much larger spread in Ne/O abundance ratio than the isothermal ones. Again, the observed Ne/O intensities rise much more steeply with peak DEM temperature than the theoretical curve, indicating a general trend of increasing Ne/O abundance ratio with plasma temperature.
The conclusion that the active region Ne/O line ratios are inconsistent with a single Ne/O abundance ratio was made earlier by McKenzie & Feldman (1992), who found Ne/O varied by a factor of 2.4. What is new here is the trend of increasing Ne/O with increasing plasma temperature.
We note in passing that indications of Ne/O abundance variations of a factor of about 2, consistent with those found here and by McKenzie & Feldman (1992), are also apparent in the earlier analysis of Ne, O and Fe lines in some SMM FCS spectra by Strong et al. (1988). Their Figure 4 shows observed Ne/O intensity ratios as a function of plasma temperature that lie between theoretical curves spanning Ne/O abundance ratios of 0.33 to 0.17. That work was focused on temperature diagnostics, and the authors drew attention to probable abundance errors but not variations.
2.3 Ne/O Abundance Ratios
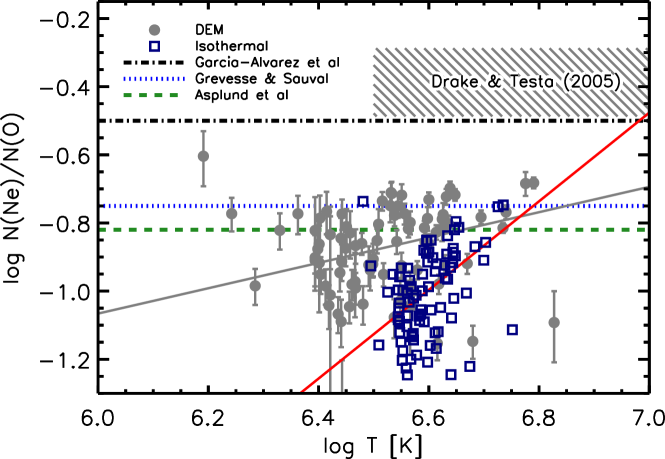
The Ne/O abundance ratio for each of the observed line intensity ratios was obtained for isothermal and DEM cases using the theoretical ratios like those illustrated in Figure 1. In these calculations, specific account of the possible contribution of Fe XIX blends at 14.423 and 14.462 Å to the Ne XI flux was taken. The largest contribution found amounted to 15%, but was less than 10% for the great majority of the lines, confirming the assessment of McKenzie & Feldman (1992) that Fe XIX blends are not significant for these observations. The abundance ratios as a function of temperature for both isothermal and DEM cases are shown in Figure 2, together with their error-weighted linear best fits. Best-fits accounted for errors both in the Ne/O flux ratios, and in the temperatures derived from the Fe XVII and Fe XVIII lines.
The temperature dependence in the derived Ne/O abundance ratios is again obvious, with both DEM and isothermal cases showing a rise to higher Ne/O with rising temperature. The mean Ne/O ratio is slightly lower than values proposed by Asplund et al. (2005, Ne/O=0.15 by number, or in logarithm), Asplund et al. (2009, Ne/O=0.17 by number, or in log) and Grevesse & Sauval (1998, Ne/O=0.18 by number or in log). The data of Schmelz et al. (2005) did not include the Fe fluxes we require here to derive DEM peak temperatures and are therefore not shown. However, it is clear from the overlap of Schmelz et al. (2005) and McKenzie & Feldman (1992) line intensity ratios shown in Figure 1, and comparison of Figures 1 and 2, that those data also correspond to a mean slightly lower than these values.
3 Discussion
3.1 Atomic Data
Can errors in the underlying atomic data be responsible for the apparent trend of Ne/O with temperature? The He-like and H-like ions present the simplest cases for computing both ion balances and collisional excitation rates, and atomic data for these species should in general be more accurate than for more complex ions. The shape of the theoretical Ne IX/O VIII emissivity ratio in the temperature range of interest here is determined primarily by the increasing excitation rate with temperature for both species and the ramp-down of the Ne IX and O VIII ion populations toward higher temperatures. It is difficult to imagine incurring an error of a factor of in the ratio of the former. Revised assessments of the emissivity ingredients for the Ne IX and O VIII resonance lines were included in version 6 of the CHIANTI database (Dere et al., 2009) used here. Dere et al. (2009) note that O VIII line intensities are in close agreement with the previous ones. Chen et al. (2006) also reported -Matrix collision strengths for Ne IX within a few percent of early data. We have nevertheless repeated the calculations reported here for CHIANTI versions 4 and 5, and find only very small differences of less than 10% in derived abundances.
The rising Ne abundance with increasing temperature observed in active regions could be mimiced by an ion population error in Ne IX, but the required errors are again of order a factor of 2 at temperatures of , or a shift in the Ne IX ion population curve toward higher temperatures by 25% or so. Such a shift would also require commensurate changes in the Ne X population, and it seems difficult to introduce such a change in Ne without invoking similar changes in the O ion balance. The calculations presented here employ the most recent ion balance assessment currently available (Bryans et al., 2009), and it seems highly unlikely that residual errors of such magnitude remain. We have also repeated the abundance calculations for the ionization equilibria of Mazzotta et al. (1998) and Arnaud & Rothenflug (1985). The latter result in slightly lower temperatures from Fe XVII and Fe XVIII lines by about 0.1 dex, and systematically higher Ne/O abundance ratios by a similar amount, but the abundance trends are unaffected (see also §3.2 below).
Desai et al. (2005) found the Fe XVIII resonance line strength predicted by CHIANTI v4.2 and other databases appeared lower by 25% relative to the resonance line compared with the ratio observed in Capella. More recent Fe XVIII electron collisional excitation calculations have been published by Witthoeft et al. (2007). Using these data, Del Zanna (2006) finds good agreement between observed and predicted Fe XVIII line strengths. It is these data that are included in CHIANTI v6.0.1 used here.
We conclude that atomic data errors are a very unlikely explanation for the observed temperature trend in Ne/O, and that it is the underlying abundance ratio itself which is responsible.
3.2 A “Neon Saturation” interpretation of fractionation in the coronae of the Sun and stars
We noted in §2.3 that the mean Ne/O abundance ratio indicated by the data in Figure 2 is somewhat lower than the assessments of Asplund et al. (2005, 2009) and Grevesse & Sauval (1998). The mean ratio would tend to reconciliation with these values were the estimated active region temperatures to be systematically too high by dex or so. In this regard, the ionization balance of Arnaud & Rothenflug (1985) provides better agreement with the solar assessments than that of Bryans et al. (2009). However, the trend with temperature cannot be erased by plausible adjustments of the estimated temperatures: the scatter in the observed Ne/O ratios is simply much larger than variations in the theoretical line ratio. The main result we emphasise here is this temperature dependence in the abundance ratio, rather than its absolute value.
By comparison of Fe/O and Ne/O ratios, McKenzie & Feldman (1992) showed that it is the abundance of Ne that varies rather than that of O. This is also expected on other grounds: the almost identical ionization potentials of neutral O and H, and the consequently large charge-exchange cross-section between their neutral and ionized species, should couple these elements quite efficiently such that the coronal O abundance is expected to follow that of H. Echoing McKenzie & Feldman (1992), we conclude that the coronal Ne abundance varies by more than a factor of 2. We also conclude here that the mechanism that fractionates Ne operates so as to either enhance hotter plasma with Ne, or to deplete Ne in cooler plasma (or perhaps both). Until this fractionation mechanism can be identified and understood, it is not obvious which case applies. This has profound consequences for the solar Ne abundance since it is not yet possible to ascertain whether the cooler or hotter regions represent the true Ne abundance, or whether any region of the solar outer atmosphere has a Ne content representative of that of the bulk of the Sun. The well-known chemical fractionation based on first ionization potential (FIP) observed in the solar corona is thought to originate in the chromosphere (e.g. Meyer, 1985; Feldman, 1992). If the Ne fractionation operates in a similar region, it is then quite possible that the Ne abundance is modified in all regions of the corona, and in the solar wind and energetic particles. Assessment of the true solar Ne content must then be undertaken deeper into the atmosphere (see Drake & Ercolano, 2007, for a method based on photospheric X-ray fluorescence).
Based on the constancy of the Ne/O abundance ratio derived from Chandra X-ray spectra of a sample of mostly quite magnetically active stars, Drake & Testa (2005) concluded that the data likely represented the true underlying stellar Ne/O abundance ratios. Their value is times higher than that of Asplund et al. (2005), albeit with some uncertainty, and 2.4 times higher than the Asplund et al. (2009) ratio. An assessment of Ne/O ratios for a larger stellar sample culled from the literature by García-Alvarez et al. (2009) finds a slightly lower factors of 2.1 and 1.9, respectively, or Ne/0. In this regard, the increasing Ne/O ratio we see toward hotter coronal temperatures is quite conspicuous. Using plasma temperature as an activity proxy, the Ne/O ratio increases as a function of solar region “activity”. This activity-dependent Ne content of the solar corona fits in well with a recent study of Ne/O ratios in low-activity stars by Robrade et al. (2008), who find evidence for a trend of higher Ne/O ratios with increasing stellar activity level (but assumed the lower stellar activities represented photospheric abundances). A similar trend is also possibly present in the compilation of Güdel (2004).
Based on existing results, we echo the earlier conclusions of Drake & Testa (2005) and suggest that active stars represent coronal “neon saturation”, with Ne content reaching photospheric levels. It seems otherwise unlikely that the Ne/O ratio can be so well controlled by a chemical fractionation mechanism when in the same stars fractionation varies the Fe/O ratio by an order of magnitude (e.g. Güdel, 2004; García-Alvarez et al., 2008, 2009). In this scenario, the solar corona, and the coronae of similar “low activity” stars, is depleted in Ne by factors ; the currently recommended solar Ne abundance underestimates the true abundance by a factor of about 2, or possibly more. A ratio Ne/O is also formally consistent with the valued preferred by Delahaye et al. (2010) based on helioseismology constraints.
This picture of depleted Ne in the solar corona is not unprecedented: the element with a FIP closest to that of Ne is He, which is depleted in the solar corona and wind by a factor of 2 or so (e.g. Laming, 2009, and references therein). Laming (2009) presents a fractionation model based on the ponderomotive force resulting from the oscillating electric field of Alfvén waves propagating through the chromosphere and corona. This model predicts coronal depletion of He to the different degrees required by observations of slow and fast solar winds, and also of Ne by a factor of .
Neon to oxygen “overabundance” ranging up to factors of 2 or more relative to the old canonical Ne/O=0.15 mixture is also the prevalent situation in many representative objects of the nearby Galaxy, including B stars and BA-type supergiants (Kilian, 1994; Kilian-Montenbruck et al., 1994; Sigut, 1999; Przybilla et al., 2006; Cunha et al., 2006; Morel & Butler, 2008; Lanz et al., 2008), and planetary nebulae and H II regions (e.g. Tsamis et al., 2003; Liu et al., 2004; Perinotto et al., 2004; Pottasch & Bernard-Salas, 2006; Stanghellini et al., 2006; Wang & Liu, 2008; Magrini et al., 2009; Rubin et al., 2011). Upward revision of the solar Ne/O ratio by a factor of 2 would not be out of line with some of these findings.
4 Conclusions
An analysis using modern atomic data of solar active region X-ray spectra obtained in the 1970s and 1980s confirms that the coronal Ne content varies by a factor of 2 or more, and reveals a trend of increasing Ne abundance with increasing plasma temperature. This trend seems to reflect the emerging picture of Ne/O abundances in late-type stellar coronae, with Ne/O appearing to increase with stellar activity until quickly reaching a fairly constant “neon saturation” in only moderately active stars. We argue this latter value represents photospheric ratios. Instead, the Sun is more capricious and withholds neon (as well as helium), from its outer atmosphere: the true solar Ne abundance cannot yet be inferred with any degree of certainty from any existing observations of the outer solar atmosphere or wind. Under the “neon saturation” hypothesis it is more abundant than currently assessed, perhaps by as much as a factor of two.
References
- Acton et al. (1975) Acton, L. W., Catura, R. C., & Joki, E. G. 1975, ApJ, 195, L93
- Anders & Grevesse (1989) Anders, E., & Grevesse, N. 1989, Geochim. Cosmochim. Acta, 53, 197
- Antia & Basu (2005) Antia, H. M., & Basu, S. 2005, ApJ, 620, L129
- Arnaud & Rothenflug (1985) Arnaud, M., & Rothenflug, R. 1985, A&AS, 60, 425
- Asplund et al. (2005) Asplund, M., Grevesse, N., & Sauval, A. J. 2005, in ASP Conf. Ser. 336: Cosmic Abundances as Records of Stellar Evolution and Nucleosynthesis, 25
- Asplund et al. (2009) Asplund, M., Grevesse, N., Sauval, A. J., & Scott, P. 2009, ARA&A, 47, 481
- Bahcall et al. (2005a) Bahcall, J. N., Basu, S., Pinsonneault, M., & Serenelli, A. M. 2005a, ApJ, 618, 1049
- Bahcall et al. (2005b) Bahcall, J. N., Basu, S., & Serenelli, A. M. 2005b, ApJ, 631, 1281
- Basu & Antia (2004) Basu, S., & Antia, H. M. 2004, ApJ, 606, L85
- Brickhouse & Schmelz (2006) Brickhouse, N. S., & Schmelz, J. T. 2006, ApJ, 636, L53
- Bryans et al. (2009) Bryans, P., Landi, E., & Savin, D. W. 2009, ApJ, 691, 1540
- Chen et al. (2006) Chen, H., Gu, M. F., Beiersdorfer, P., Boyce, K. R., Brown, G. V., Kahn, S. M., Kelley, R. L., Kilbourne, C. A., Porter, F. S., & Scofield, J. H. 2006, ApJ, 646, 653
- Cunha et al. (2006) Cunha, K., Hubeny, I., & Lanz, T. 2006, ApJ, 647, L143
- Del Zanna (2006) Del Zanna, G. 2006, A&A, 459, 307
- Delahaye & Pinsonneault (2006) Delahaye, F., & Pinsonneault, M. H. 2006, ApJ, 649, 529
- Delahaye et al. (2010) Delahaye, F., Pinsonneault, M. H., Pinsonneault, L., & Zeippen, C. J. 2010, ArXiv e-prints
- Dere et al. (1997) Dere, K. P., Landi, E., Mason, H. E., Monsignori Fossi, B. C., & Young, P. R. 1997, A&AS, 125, 149
- Dere et al. (2009) Dere, K. P., Landi, E., Young, P. R., Del Zanna, G., Landini, M., & Mason, H. E. 2009, A&A, 498, 915
- Desai et al. (2005) Desai, P., Brickhouse, N. S., Drake, J. J., Dupree, A. K., Edgar, R. J., Hoogerwerf, R., Kashyap, V., Wargelin, B. J., Smith, R. K., Huenemoerder, D. P., & Liedahl, D. A. 2005, ApJ, 625, L59
- Drake & Ercolano (2007) Drake, J. J., & Ercolano, B. 2007, ApJ, 665, L175
- Drake et al. (2000) Drake, J. J., Peres, G., Orlando, S., Laming, J. M., & Maggio, A. 2000, ApJ, 545, 1074
- Drake & Testa (2005) Drake, J. J., & Testa, P. 2005, Nature, 436, 525
- Feldman (1992) Feldman, U. 1992, Physica Scripta Volume T, 46, 202
- Güdel (2004) Güdel, M. 2004, A&A Rev., 12, 71
- García-Alvarez et al. (2008) García-Alvarez, D., Drake, J. J., Kashyap, V. L., Lin, L., & Ball, B. 2008, ApJ, 679, 1509
- García-Alvarez et al. (2009) García-Alvarez, D., Drake, J. J., & Testa, P. 2009, in American Institute of Physics Conference Series, Vol. 1094, American Institute of Physics Conference Series, ed. E. Stempels, 796–799
- Grevesse & Sauval (1998) Grevesse, N., & Sauval, A. J. 1998, Space Science Reviews, 85, 161
- Jordan et al. (1987) Jordan, C., Ayres, T. R., Brown, A., Linsky, J. L., & Simon, T. 1987, MNRAS, 225, 903
- Kashyap & Drake (2000) Kashyap, V., & Drake, J. J. 2000, Bulletin of the Astronomical Society of India, 28, 475
- Kilian (1994) Kilian, J. 1994, A&A, 282, 867
- Kilian-Montenbruck et al. (1994) Kilian-Montenbruck, J., Gehren, T., & Nissen, P. E. 1994, A&A, 291, 757
- Laming (2009) Laming, J. M. 2009, ApJ, 695, 954
- Landi et al. (2006) Landi, E., Del Zanna, G., Young, P. R., Dere, K. P., Mason, H. E., & Landini, M. 2006, ApJS, 162, 261
- Landi et al. (2007) Landi, E., Feldman, U., & Doschek, G. A. 2007, ApJ, 659, 743
- Lanz et al. (2008) Lanz, T., Cunha, K., Holtzman, J., & Hubeny, I. 2008, ApJ, 678, 1342
- Lin et al. (2007) Lin, C.-H., Antia, H. M., & Basu, S. 2007, ApJ, 668, 603
- Liu et al. (2004) Liu, Y., Liu, X.-W., Barlow, M. J., & Luo, S.-G. 2004, MNRAS, 353, 1251
- Magrini et al. (2009) Magrini, L., Stanghellini, L., & Villaver, E. 2009, ApJ, 696, 729
- Mazzotta et al. (1998) Mazzotta, P., Mazzitelli, G., Colafrancesco, S., & Vittorio, N. 1998, A&AS, 133, 403
- McKenzie & Feldman (1992) McKenzie, D. L., & Feldman, U. 1992, ApJ, 389, 764
- Meyer (1985) Meyer, J.-P. 1985, ApJS, 57, 151
- Morel & Butler (2008) Morel, T., & Butler, K. 2008, A&A, 487, 307
- Ness et al. (2003) Ness, J.-U., Brickhouse, N. S., Drake, J. J., & Huenemoerder, D. P. 2003, ApJ, 598, 1277
- Perinotto et al. (2004) Perinotto, M., Morbidelli, L., & Scatarzi, A. 2004, MNRAS, 349, 793
- Pottasch & Bernard-Salas (2006) Pottasch, S. R., & Bernard-Salas, J. 2006, A&A, 457, 189
- Przybilla et al. (2006) Przybilla, N., Butler, K., Becker, S. R., & Kudritzki, R. P. 2006, A&A, 445, 1099
- Robrade et al. (2008) Robrade, J., Schmitt, J. H. M. M., & Favata, F. 2008, A&A, 486, 995
- Rubin et al. (2011) Rubin, R. H., Simpson, J. P., O’Dell, C. R., McNabb, I. A., Colgan, S. W. J., Zhuge, S. Y., Ferland, G. J., & Hidalgo, S. A. 2011, MNRAS, 410, 1320
- Schmelz et al. (2005) Schmelz, J. T., Nasraoui, K., Roames, J. K., Lippner, L. A., & Garst, J. W. 2005, ApJ, 634, L197
- Sigut (1999) Sigut, T. A. A. 1999, ApJ, 519, 303
- Stanghellini et al. (2006) Stanghellini, L., Guerrero, M. A., Cunha, K., Manchado, A., & Villaver, E. 2006, ApJ, 651, 898
- Strong et al. (1988) Strong, K. T., Claflin, E. S., Lemen, J. R., & Linford, G. A. 1988, Advances in Space Research, 8, 167
- Tsamis et al. (2003) Tsamis, Y. G., Barlow, M. J., Liu, X.-W., Danziger, I. J., & Storey, P. J. 2003, MNRAS, 345, 186
- Wang & Liu (2008) Wang, W., & Liu, X.-W. 2008, MNRAS, 389, L33
- Witthoeft et al. (2007) Witthoeft, M. C., Del Zanna, G., & Badnell, N. R. 2007, A&A, 466, 763
- Young (2005) Young, P. R. 2005, A&A, 444, L45