11email: kospal@strw.leidenuniv.nl
Millimeter interferometric observations of
FU Orionis-type
objects in Cygnus
Abstract
Context. FU Orionis-type objects (FUors) are low-mass young eruptive stars that probably represent an evolutionary phase characterized by episodic periods of increased accretion rate from the circumstellar disk to the star. Theory predicts that a circumstellar envelope, the source of continuous mass infall onto the disk, is necessary for triggering such accretion bursts.
Aims. We intend to study the spatial and velocity structure of circumstellar envelopes around FUors by means of molecular line observations at millimeter wavelengths. We target three prototypical FUors as well as an object possibly in a pre-outburst state.
Methods. We present archival PdBI interferometric observations of the J=1–0 line of 13CO at 110.2 GHz. For three of our targets, these represent the first millimeter interferometric observations. The data allow the study of the molecular environment of the objects on a spatial resolution of a thousand AU and a velocity resolution of 0.2 km s-1.
Results. Strong, narrow 13CO(1–0) line emission is detected from all sources. The emission is spatially resolved in all cases, with deconvolved sizes of a few thousand AUs. For V1057 Cyg and V1331 Cyg, the emitting area is rather compact, suggesting that the origin of the emission is a circumstellar envelope surrounding the central star. For V1735 Cyg, the 13CO emission is offset from the stellar position, indicating that the source of this emission may be a small foreground cloud, also responsible for the high reddening of the central star. The 13CO emission towards V1515 Cyg is the most extended in the sample, and apparently coincides with the ring-like optical reflection nebula associated with V1515 Cyg.
Conclusions. We suggest that millimeter interferometric observations are indispensable for a complete understanding of the circumstellar environment of FUors. Any theory of the FUor phenomenon that interprets the geometry of the circumstellar structure and its evolution using single beam measurements must be checked and compared to interferometric observations in the future.
Key Words.:
stars: formation – infrared: stars – circumstellar matter – stars: individual: V1057 Cyg, V1331 Cyg, V1515 Cyg, V1735 Cyg1 Introduction
FU Orionis-type objects, or shortly FUors, constitute a small group of young stars characterized by large outbursts in visible light, attributed to highly enhanced accretion (Hartmann & Kenyon, 1996). During these outbursts, accretion rates from the circumstellar disk to the star are in the order of 10-4 M⊙/yr, three orders of magnitude higher than in quiescence. Enhanced accretion is often accompanied by enhanced mass loss: most FUors have optical jets, molecular outflows, and optically visible ring-like structures that are sometimes explained by expanding shells thrown off during previous outbursts.
During a single, century-long outburst, as much as 0.01 M⊙ of material can be dumped onto the stellar surface. Thus, the inner disk needs to be replenished after each outburst, possibly by material from the infalling envelope. Recent theoretical studies show that the continuous infall from the envelope is also necessary to trigger the outbursts (Vorobyov & Basu, 2006). After many outbursts, the envelope vanishes, and the object finally enters a state of permanently low accretion. This general paradigm of the evolution of young, low-mass stars was invoked by Quanz et al. (2007) to explain the observed diversity of FUors: while some objects are still deeply embedded (e.g. L1551 IRS 5, V1735 Cyg), others have already cleared away part of their envelopes (e.g. V1057 Cyg, V1515 Cyg). Statistics show that probably all low-mass young stars undergo FUor-like phases during their evolution, implying that FUors might be the clue objects to study envelope evolution and dispersal.
Interferometric observations of molecular line emission have been successfully used to probe small-scale structure of molecular material around young stellar objects. For example, for a sample of low-mass YSOs in Taurus (Hogerheijde et al., 1998), Serpens (Hogerheijde et al., 1999), and Ophiuchus (van Kempen et al., 2009), it was found that most YSOs are surrounded by compact envelopes of up to a few thousand AU in radius, well traced by 13CO and C18O. Condensations, inhomogeneities in the envelopes can be seen in HCO+ and 13CO. The HCO+ and HCN molecules trace the walls of the outflow, while SiO and SO emission originates from shocked material in the outflow. These observations provided detailed kinematical picture of the envelopes (for molecular studies of some individual young stellar objects, see e.g. Jørgensen et al. 2004; Matthews et al. 2006; Brinch et al. 2009).
Despite being “accretion laboratories”, there are relatively few molecular gas observations published for FUors. Single-dish observations often show the presence of strong CO emission towards FUors, and line profiles sometimes indicate the presence of molecular outflows (e.g. Hartmann & Kenyon 1996, and references therein). However, due to the large single dish beam, it is not possible to study the spatial distribution of the emission using these data. Out of the 9 FUors listed in Hartmann & Kenyon (1996), millimeter interferometric observations are only available for L1551 IRS 5 (e.g. Momose et al., 1998).
In this paper, we present interferometric observations of the molecular emission from four FUor-type objects in Cygnus: V1057 Cyg, V1331 Cyg, V1515 Cyg, and V1735 Cyg. With the exception of V1331 Cyg (Levreault, 1988; McMuldroch et al., 1993), these data represent the first millimeter interferometric observations for our targets. We use the 13CO(1–0) line emission to perform a high spatial and spectral resolution study of the gaseous material around FUors. We analyze the spatial and kinematic structure of the 13CO gas, and check whether the emission can be associated with the circumstellar envelopes. Our results can be compared with those obtained for normal YSOs. Such a comparison may also contribute to the on-going debate whether all young stars undergo an eruptive phase in their early evolution or FUors are atypical objects.
2 Observations
We reduced unpublished 13CO observations of our targets obtained with the Plateau de Bure Interferometer (PdBI) on May 30 and 31, 1993 (program ID: C057, PI: D. Fiebig). The observations were carried out in snapshot mode (about 1 hour on-source correlation time per object), using four antennas (4D1 configuration), and the baselines ranged from 24 to 64 m. The receiver was tuned to the 13CO(1–0) line at 110.2 GHz (lower sideband), the channel spacing was 78 kHz (0.21 km/s). At this wavelength, the single dish HPBW is 45′′. Bright quasars (3C454.3, 2005+403, 2037+511, 2200+420, 0648–165, and 0727–115) were observed to enable RF bandpass, phase, and amplitude calibration. The phase center was 20h58m537 +44∘15′279 for V1057 Cyg, 21h01m093 +50∘21′422 for V1331 Cyg, 20h23m479 +42∘12′248 for V1515 Cyg, and 21h47m207 +47∘32′041 for V1735 Cyg.
Data reduction was done in the standard way with CLIC, a GILDAS-based application written especially for the reduction of PdBI data111http://www.iram.fr/IRAMFR/GILDAS. The rms phase noise was less than 18∘ for all observations. We estimate a flux calibration accuracy of 15%. MAPPING was used to create naturally weighted dirty maps in an area of 6464′′, which were then deconvolved using the Clark CLEAN method. The synthesized beam is approximately 76′′ while the rms noise in the channel maps is 0.15 Jy/beam. For the exact phase centers and beam parameters, see the log of observations in Table 1.
3 Results
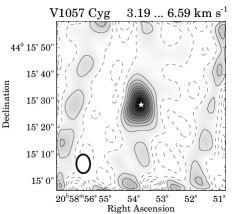
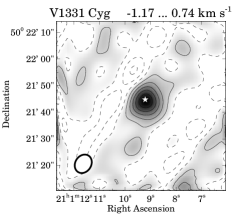
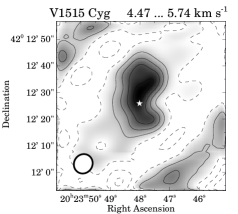
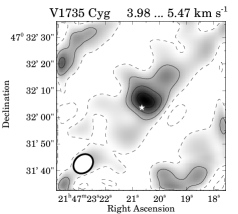
The 13CO(1–0) spectra of our sources, integrated over the whole 6464′′ maps, are plotted in Fig. 1. Strong 13CO(1–0) emission was detected towards all sources with high signal-to-noise ratio. In all cases, we found an emission line coinciding with the systemic velocity of each source (from optical and near-IR spectra, Herbig 1977, Kenyon & Hartmann 1989, and Chavarría et al. 1979 determined heliocentric radial velocities of 142, 152, 122, and 102 km s-1, coresponding to LSR velocities of 1.9, 0.6, 5.2, and 3.9 km s-1 for V1057 Cyg, V1331 Cyg, V1515 Cyg, and V1735 Cyg, respectively). We collapsed a few channels centered on the peak emission, and calculated visibility amplitudes as a function of radius (Fig. 2), and produced velocity-integrated maps (Fig. 3). The LSR velocities where the emission peaks are listed in Table 1. Velocity-integrated line fluxes calculated for the emission areas visible in Fig. 3 are also listed in Table 1.
| Synthesized beam | Peak position | Fitted Gaussian | ||||||||||
| Name | Distance | Date | FWHM | P.A. | FWHM | P.A. | Flux | |||||
| (pc) | () | (∘) | (h:m:s) | (∘:′:′′) | () | (∘) | (km s-1) | (Jy km s-1) | ||||
| V1057 Cyg | 600 | 1993-May-31 | 7.025.16 | 2 | 20:58:53.8 | +44:15:28.7 | 9.65.2 | 177 | 4.6 | 4.1 | ||
| V1331 Cyg | 550 | 1993-May-31 | 7.305.97 | 147 | 21:01:09.2 | +50:21:44.2 | 9.76.5 | 148 | 0.1 | 2.5 | ||
| V1515 Cyg | 1000 | 1993-May-30 | 7.436.90 | 148 | 20:23:48.0 | +42:12:30.0 | 21.910.6 | 166 | 5.1 | 5.1 | ||
| V1735 Cyg | 900 | 1993-May-30 | 8.016.53 | 133 | 21:47:20.5 | +47:32:06.3 | 9.49.4 | 78 | 4.2 | 1.5 | ||
3.1 Line profiles
The line profile of V1057 Cyg is the broadest in our sample (FWHM2.1 km s-1), and is centered at 4.6 km s-1. This is consistent with the velocity seen in single dish 12CO(1–0), 12CO(2–1), and 13CO(1–0) data by Bechis & Lo (1975) and Levreault (1988). V1331 Cyg shows a narrow 13CO(1–0) line (FWHM0.7 km s-1). McMuldroch et al. (1993) presents Owens Valley interferometric observations of V1331 Cyg in the same line, as well as in other transitions and other isotopes of CO. The velocities of these lines are consistent with ours. V1515 Cyg shows two separate, narrow emission components (FWHM0.6 km s-1) at 5.1 km s-1 and at 11.9 km s-1. Both of these components are also visible in single dish 12CO(3–2) and 13CO(2–1) data from Evans et al. (1994). The spectrum of V1735 Cyg shows a narrow, single-peaked 13CO(1–0) line (FWHM0.7 km s-1). The shape and position of this line coincides well with that of the 13CO(2–1) line detected in single dish data by Evans et al. (1994). The 12CO(2–1) line from the same paper shows self-absorption at this velocity, and broad line wings indicating outflow activity. We plotted position-velocity diagrams along different angles through our sources, but except for V1515 Cyg (which will be discussed later), we found no significant velocity gradients.


3.2 Spatial extent
In Fig. 2 we plotted the visibility amplitudes as a function of radius. Since these are snapshot observations, the -space is only partially sampled; there are ranges of radii where no visibility information is available. However, even with this coarse sampling, the graphs show a decline of amplitude with radius, indicating that our sources are spatially resolved. Simple 2D Gaussian fits to the maps presented in Fig. 3 also indicate that our targets are spatially resolved. The deconvolved sizes and PAs of the Gaussian fits are listed in Table 1. Gaussian models fitted to the visibilities give sizes within 2′′ and PAs within 10∘ to those determined from the Gaussian fits to the images. Thus, we consider these numbers as representative uncertainties of the values given in Table 1. We emphasize that these fits are not physical envelope models, and thus the obtained parameters should be regarded only as rough quantitative estimates of the size of the emitting region.
V1057 Cyg and V1331 Cyg are the most compact sources in our sample, with FWHM of about 105′′. Moreover, in both cases, the emission in centered precisely on the optical position of the stars. V1515 Cyg shows the most extended emission in our sample. The stellar position seems to be located at the southern tip of a bright, slightly curved, elongated filament, but extended emission can be seen both to the south and to the north of the star (20′′ across). A map produced for the channels around the emission line at 11.9 km s-1 reveals that this separate velocity component comes from a compact area 13′′ to the northwest (P.A. 330∘) of the optical source. The bulk of the emission in the V1735 Cyg region comes from an area with a FWHM of 9′′ centered 29 to the northwest with respect to the optical position of the star. Moreover, there is also some tentative extended emission towards the northwest about 14′′ from the stellar position.
3.3 Gas masses
Following Scoville et al. (1986), the total H2 mass can be calculated from the observed 13CO(1–0) line fluxes by
where is the excitation temperature, is the optical depth, is the distance of the source, is the molecular abundance relative to H2, and is the velocity-integrated line flux in units of Jy km s-1. Using =50 K (as determined from dust continuum observations by Sandell & Weintraub 2001), assuming the lines to be optically thin (1), and taking =1.610-6 (Langer & Penzias, 1993), the total gas masses are 0.12, 0.06, 0.43, and 0.10 M⊙ for V1057 Cyg, V1331 Cyg, V1515 Cyg, and V1735 Cyg, respectively. Of course these numbers should be considered lower limits if the lines are actually optically thick, or if part of the 13CO emission is resolved out by the interferometer. However, these values are in good agreement with total masses derived from single-dish 850m dust continuum maps of comparable size by Sandell & Weintraub (2001), which were 0.10, 0.13, 0.15, and 0.42 M⊙ for V1057 Cyg, V1331 Cyg, V1515 Cyg, and V1735 Cyg, respectively. This suggests that our interferometric observations probably recover most of the 13CO emission.
3.4 2.7 mm continuum
Although the main focus of our data analysis is the study of the 13CO emission, the PdBI observations could also be used to look for 2.7 mm continuum emission by excluding channels around the lines and collapsing the remaining channels. The resulting continuum maps have a typical rms noise of 2 mJy/beam. We detected 2.7 mm continuum emission only for one of our targets, V1331 Cyg. This is not surprising because, based on the observations of Sandell & Weintraub (2001), out of our four targets, V1331 Cyg is the brightest also at 1.3 mm and at 850m. The 2.7 mm emission we detected is not resolved, its position is consistent with the optical stellar position, and the measured total flux is 122 mJy. Assuming optically thin emission, dust opacity of =0.01 cm2 g-1 (Ossenkopf & Henning, 1994), an emissivity law of and dust temperature of 50 K (Sandell & Weintraub, 2001), this flux corresponds to a total (gas+dust) mass of 0.19 M⊙, similar to what we obtained from the line flux of V1331 Cyg. Using 6 mJy as a 3 upper limit for the 2.7 mm continuum flux of the other sources, we can give upper limits of 0.11, 0.32, and 0.26 M⊙ for V1057 Cyg, V1515 Cyg, and V1735 Cyg, respectively.
4 Discussion
In the following subsections, we discuss what our interferometric 13CO(1–0) data can add to what we already know about the circumstellar environment of our targets based on optical images, sub-millimeter continuum maps, CO line observations, and SED analysis from the literature. We will also discuss whether the detected 13CO emission can be associated with the envelopes.
4.1 V1057 Cyg
After its outburst in 1969-70, an eccentric ring-like nebulosity of 115 appeared around V1057 Cyg (Herbig, 1977). The monitoring of this ring in the subsequent years indicated that it is fading together with the central star without any changes in the structure. This implies that the ring is a reflection nebula: a pre-existing structure illuminated by the outbursting star, and not material ejected from the central source by the outburst. From the line wings of single dish 12CO data, Levreault (1988) and Evans et al. (1994) concluded the presence of a molecular outflow on a similar spatial scale. The surroundings of V1057 Cyg was mapped by Sandell & Weintraub (2001), whose 850m continuum image indicates the presence of a rather compact but resolved (4′′) source coinciding with the star and a fainter, north-south oriented filament.
In our 13CO(1–0) data we do not detect emission either from the ring-like reflection nebula of from the north-south filament. However, our interferometric observations definitely resolve the central source: the deconvolved Gaussian FWHM at the distance of V1057 Cyg corresponds to about 58003100 AU. The lack of observable line wings, the relatively narrow line profile, and the compact spatial appearance of the emission points to quiescent gas, probably situated in the outer parts of a circumstellar envelope.
The infrared SED of the source (e.g. Ábrahám et al., 2004) suggests a continuous temperature distribution in the system. This supports our conclusion that there is an envelope associated with and heated by the central star. The presence and measured size of the envelope is consistent with the model prediction of 7000 AU proposed by Green et al. (2006). They also suggested that the envelope has a rather large conical cavity which explains the modest far-infrared excess. The relatively low extinction along the line-of-sight and the detectability of the 10m silicate emission feature implies a close to pole-on geometry for the source, in accordance with its relatively symmetric shape in our interferometric observations. The circumstellar mass of 0.12 M⊙ derived from our 13CO observations, consistently with the dust mass estimate by Sandell & Weintraub (2001), is rather high, significantly exceeding the typical disk masses of T Tauri-type stars.
4.2 V1331 Cyg
V1331 Cyg is not a FUor in its present state, but – based on the similarity of its spectrum to that of V1057 Cyg prior to maximum light – is probably in a pre-outburst state, or between outbursts (McMuldroch et al., 1993). Single-dish and interferometric 12CO and 13CO observations by Levreault (1988) and McMuldroch et al. (1993) revealed a complex circumstellar environment containing a molecular outflow approximately along the line of sight, a flattened gaseous envelope of about 60004400 AU in size, and a gaseous expanding ring of about 41 00028 000 AU. The latter coincides well with the large ring-shaped optical reflection nebula seen by Quanz et al. (2007).
Our interferometric 13CO observations of V1331 Cyg, consistently with the similar angular resolution measurements of McMuldroch et al. (1993), reveal a rather compact structure towards the star with a deconvolved Gaussian FWHM of about 53003600 AU at the distance of V1331 Cyg. This core is also visible in continuum emission in the 850m maps of Sandell & Weintraub (2001), although it is only marginally resolved (6′′ or 3300 AU). We suggest that both the 13CO gas emission and the dust thermal emission is originated in a circumstellar envelope, probably the same flattened structure that was proposed by McMuldroch et al. (1993) to explain the nature of the 13CO emission. It is probable that the dust in this flattened envelope scatters the stellar light and gives rise to the inner ring observed in optical images by Quanz et al. (2007).
The presence of a circumstellar envelope around V1331 Cyg is also consistent with the SED, which exhibits significant infrared excess indicating substantial amounts of circumstellar material (e.g. Ábrahám et al., 2004). The geometry proposed by McMuldroch et al. (1993) and by Quanz et al. (2007) suggests that we see the inner part of the system through a conical cavity filled with a pole-on molecular outflow. However, we detect 13CO emission neither from the outflow nor from the outer, large expanding ring, in agreement with the interferometric observations of McMuldroch et al. (1993).
4.3 V1515 Cyg
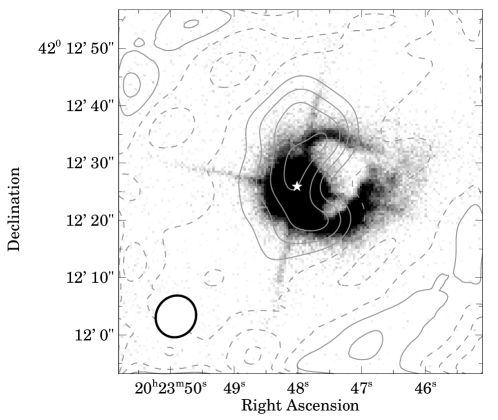
V1551 Cyg brightened in optical light slowly during the 1940s and 1950s (Herbig, 1977). Photographic plates from this time show a bright, narrow arc of nebulosity extending to the north and west of the star. Later images from the 1970s to the present day still show this northern arc, but a brighter nebulosity is also visible to the south and west, together forming a nearly complete circular ring with a diameter of 16′′ (corresponding to 16 000 AU, see also the Sloan Digital Sky Survey r-band image from 2003 in Fig. 4). The fact that the size of this ring did not change significantly for 60 years but the brightness distribution did, suggests that it is a reflection nebula similar in nature to that around V1057 Cyg.
Our 13CO(1–0) measurement shows arc-shaped emission, which, plotted over the optical image in Fig. 4, clearly coincides with the ring-shaped reflection nebula. The similar morphology of the 13CO emission and the scattered light, as well as the matching radial velocities of the 13CO emission and the star suggest that the detected molecular gas is physically associated with the FUor. Similarly to V1057 Cyg, the 12CO line profile of V1515 Cyg in Evans et al. (1994) indicate the presence of a molecular outflow. Our 13CO(1–0) data, however, show no high-velocity line wings; the emission line is narrow and thus probably traces quiescent, not outflowing material. We detect a small (0.5 km s-1) velocity difference between the northern and the southern part of the ring, the southern part being slightly more red-shifted. However, the ring is clearly not expanding.
A map of the 850m dust continuum from Sandell & Weintraub (2001) shows faint extended emission towards V1515 Cyg and also at about 10′′ to the north and northwest to the star. Although these observations were made with a relatively large (15′′) beam, the results are not inconsistent with a potentially arc-shaped dust emission. It is thus possible that the ring of material that is responsible for the optical reflection nebula and for the 13CO emission also emits in dust continuum.
Although the observed molecular emission does not exactly peak towards the star, some dust and gas must be located in the vicinity of V1515 Cyg forming a circumstellar envelope. This claim is suggested by the SED of the FUor, which was modeled with a disk+envelope geometry by Turner et al. (1997) and Green et al. (2006). However, this envelope does not show up as a separate localized peak in our 13CO map. We measured the highest gas mass towards this object within our sample, which can probably be explained by the contribution from both the circumstellar envelope and from the arc-shaped feature. Thus the 0.43 M⊙ is an upper limit for the envelope mass.
4.4 V1735 Cyg
V1735 Cyg had its outburst some time in the 1950s or the 1960s (Elias, 1978). The star is associated with faint patches and filaments of reflected light within 1′. Submillimeter dust continuum observations by Sandell & Weintraub (2001) indicate the presence of two sources: one associated with (albeit slightly offset from the optical position of) V1735 Cyg, and a brighter one located about 20-24′′ to the northeast (the deeply embedded Class I protostar V1735 Cyg SM1). Single-dish 12CO and 13CO observations (Levreault, 1983; Richardson et al., 1985; Evans et al., 1994) revealed a complex molecular gas structure in the vicinity of these sources. The 12CO emission is extended in the arcminute spatial scale, and broad line wings indicate outflow activity. Evans et al. (1994) concluded that both V1735 Cyg and SM1 drive molecular outflows.
Similarly to the other three FUors in our sample, our 13CO interferometric observations of V1735 Cyg show narrow emission with no line wings. This again points to quiescent gas in some kind of envelope. Our map shows a compact peak close to V1735 Cyg, but with a definite offset of 29 to the northwest. Based on multi-filter optical images, Goodrich (1987) discovered that V1735 Cyg itself is much more reddened than the surrounding reflection nebulosity. He speculates that the reason for this may be a dark cloud in front of V1735 Cyg. In this scenario, the dark cloud may be offset from the star, as long as it causes enough interstellar extinction to explain the observed colors. Based on the fact that the 13CO emission we detect is offset from the stellar position, we propose that a significant part of the emission is coming from this foreground dark cloud. This suggestion is supported by the results of Quanz et al. (2007), who, based on the analysis of mid-infrared ice features, concluded that the extinction for V1735 Cyg might be caused by ices somewhere in the line of sight to the source, rather than material related to the young star. The foreground structure, however, may not be completely unrelated to the star because of their identical radial velocities.
For continuum observations such as those presented in Weintraub et al. (1991) and in Sandell & Weintraub (2001), the dominant source is not the FUor, but V1735 Cyg SM1. This source also emits molecular line emission, as evidenced by the single-dish 12CO(3–2) map presented by Evans et al. (1994). Interestingly, we did not detect V1735 Cyg SM1 in 13CO. The reason for the non-detection may be partly due to the fact that V1735 Cyg SM1 is separated from V1735 Cyg by about 20′′, thus it is at the very edge of our primary beam. Additionally, the submillimeter source is very extended, thus the interferometer may filter out most of its emission.
5 Summary and Conclusions
In this paper, we present interferometric observations of the 13CO(1–0) line of four well known FUors, young stellar objects characterized by large optical outbursts due to enhanced disk accretion. For V1057 Cyg, V1515 Cyg, and V1735 Cyg, these represent the first millimeter interferometric data published so far. This makes it possible to study the gas distribution on a few thousand AU spatial scale.
Although all of our sources are known to drive molecular outflows, as evidenced by the high-velocity line wings of 12CO, our data suggest that the 13CO(1–0) emission traces quiescent gas. With the exception of V1515 Cyg, the size of the emitting region is within a few thousand AU, consistent with typical circumstellar envelope sizes. Gas masses calculated from our 13CO line fluxes and from dust continuum data from Sandell & Weintraub (2001) are also consistent. This indicates that the 13CO emission seen towards our sources is mostly originated from a relatively compact circumstellar envelope, or, as in the case of V1735 Cyg, possibly from a small foreground cloud.
All of our sources are surrounded by reflection nebulosities, which are probably pre-existent structures illuminated by the brightened central source. With the exception of V1515 Cyg, we detect no 13CO emission from these structures. For V1515 Cyg, the 13CO emission coincides with the ring-shaped optical reflection nebula. This indicates that the source is surrounded by a ring of material that on one hand scatters the optical light of the central star, and on the other hand emits at millimeter wavelengths. An important consequence is that attributing unresolved, single-dish millimeter fluxes of V1515 Cyg to the circumstellar envelope may not be entirely correct.
Based on the appearance of the 10m silicate feature, Quanz et al. (2007) defined two categories of FUors. They argue that objects showing the feature in absorption (e.g. V1735 Cyg) are younger, still embedded in a circumstellar envelope. Objects showing the silicate band in emission (e.g. V1057 Cyg, V1331 Cyg, and V1515 Cyg) are more evolved, with direct view on the surface layer of the accretion disk. However, in case of V1735 Cyg, the millimeter emission and the absorption at shorter wavelengths may be due to a foreground cloud, and consequently the object may be more evolved (less embedded) than it appears. Our 13CO data, especially the case of V1515 Cyg and V1735 Cyg, demonstrate that millimeter emission and consequently absorption at other wavelengths may not be necessarily or exclusively associated with circumstellar envelopes. Thus, large beam, single-dish data alone are probably not enough to obtain a complete picture of the circumstellar environment of FUors. We suggest that any theory of the FUor phenomenon that interprets the geometry of the circumstellar material and its evolution using single beam measurements must be checked and compared to interferometric observations in the future. Millimeter observations with facilities such as ALMA for both the dust continuum and for the line emission of molecules such as 13CO, C18O, HCO+, HCN, etc. will be a fruitful direction in future studies of FUors.
Acknowledgements.
The author thanks Prof. Wolfgang J. Duschl for making available the PdBI data and Dr. Roberto Neri for his help during the data reduction. Discussions with Dr. Michiel Hogerheijde and Dr. Maria Kun greatly improved the presentation of the data analysis. Funding for the Sloan Digital Sky Survey (SDSS) and SDSS-II has been provided by the Alfred P. Sloan Foundation, the Participating Institutions, the National Science Foundation, the U.S. Department of Energy, the National Aeronautics and Space Administration, the Japanese Monbukagakusho, and the Max Planck Society, and the Higher Education Funding Council for England. The SDSS Web site is http://www.sdss.org/. The SDSS is managed by the Astrophysical Research Consortium (ARC) for the Participating Institutions. The Participating Institutions are the American Museum of Natural History, Astrophysical Institute Potsdam, University of Basel, University of Cambridge, Case Western Reserve University, The University of Chicago, Drexel University, Fermilab, the Institute for Advanced Study, the Japan Participation Group, The Johns Hopkins University, the Joint Institute for Nuclear Astrophysics, the Kavli Institute for Particle Astrophysics and Cosmology, the Korean Scientist Group, the Chinese Academy of Sciences (LAMOST), Los Alamos National Laboratory, the Max-Planck-Institute for Astronomy (MPIA), the Max-Planck-Institute for Astrophysics (MPA), New Mexico State University, Ohio State University, University of Pittsburgh, University of Portsmouth, Princeton University, the United States Naval Observatory, and the University of Washington.References
- Ábrahám et al. (2004) Ábrahám, P., Kóspál, Á., Csizmadia, S., et al. 2004, A&A, 428, 89
- Bechis & Lo (1975) Bechis, K. P. & Lo, K. Y. 1975, ApJ, 201, 118
- Brinch et al. (2009) Brinch, C., Jørgensen, J. K., & Hogerheijde, M. R. 2009, A&A, 502, 199
- Chavarría et al. (1979) Chavarría, C., Appenzeller, I., & Bertout, C. 1979, A&AS, 36, 465
- Elias (1978) Elias, J. H. 1978, ApJ, 223, 859
- Evans et al. (1994) Evans, II, N. J., Balkum, S., Levreault, R. M., Hartmann, L., & Kenyon, S. 1994, ApJ, 424, 793
- Goodrich (1987) Goodrich, R. W. 1987, PASP, 99, 116
- Green et al. (2006) Green, J. D., Hartmann, L., Calvet, N., et al. 2006, ApJ, 648, 1099
- Hartmann & Kenyon (1996) Hartmann, L. & Kenyon, S. J. 1996, ARA&A, 34, 207
- Herbig (1977) Herbig, G. H. 1977, ApJ, 217, 693
- Hogerheijde et al. (1998) Hogerheijde, M. R., van Dishoeck, E. F., Blake, G. A., & van Langevelde, H. J. 1998, ApJ, 502, 315
- Hogerheijde et al. (1999) Hogerheijde, M. R., van Dishoeck, E. F., Salverda, J. M., & Blake, G. A. 1999, ApJ, 513, 350
- Jørgensen et al. (2004) Jørgensen, J. K., Hogerheijde, M. R., van Dishoeck, E. F., Blake, G. A., & Schöier, F. L. 2004, A&A, 413, 993
- Kenyon & Hartmann (1989) Kenyon, S. J. & Hartmann, L. 1989, ApJ, 342, 1134
- Langer & Penzias (1993) Langer, W. D. & Penzias, A. A. 1993, ApJ, 408, 539
- Levreault (1983) Levreault, R. M. 1983, ApJ, 265, 855
- Levreault (1988) Levreault, R. M. 1988, ApJS, 67, 283
- Matthews et al. (2006) Matthews, B. C., Hogerheijde, M. R., Jørgensen, J. K., & Bergin, E. A. 2006, ApJ, 652, 1374
- McMuldroch et al. (1993) McMuldroch, S., Sargent, A. I., & Blake, G. A. 1993, AJ, 106, 2477
- Momose et al. (1998) Momose, M., Ohashi, N., Kawabe, R., Nakano, T., & Hayashi, M. 1998, ApJ, 504, 314
- Ossenkopf & Henning (1994) Ossenkopf, V. & Henning, T. 1994, A&A, 291, 943
- Quanz et al. (2007) Quanz, S. P., Henning, T., Bouwman, J., et al. 2007, ApJ, 668, 359
- Richardson et al. (1985) Richardson, K. J., White, G. J., Avery, L. W., Lesurf, J. C. G., & Harten, R. H. 1985, ApJ, 290, 637
- Sandell & Weintraub (2001) Sandell, G. & Weintraub, D. A. 2001, ApJS, 134, 115
- Scoville et al. (1986) Scoville, N. Z., Sargent, A. I., Sanders, D. B., et al. 1986, ApJ, 303, 416
- Turner et al. (1997) Turner, N. J. J., Bodenheimer, P., & Bell, K. R. 1997, ApJ, 480, 754
- van Kempen et al. (2009) van Kempen, T. A., van Dishoeck, E. F., Salter, D. M., et al. 2009, A&A, 498, 167
- Vorobyov & Basu (2006) Vorobyov, E. I. & Basu, S. 2006, ApJ, 650, 956
- Weintraub et al. (1991) Weintraub, D. A., Sandell, G., & Duncan, W. D. 1991, ApJ, 382, 270