Formation Of The Rare Earth Peak: Gaining Insight Into Late-Time r-Process Dynamics
Abstract
We study the formation and final structure of the rare earth peak () of the -process nucleosynthesis. The rare earth peak forms at late times in the -process after neutron exhaustion (neutron-to-seed ratio unity or ) as matter decays back to stability. Since rare earth peak formation does not occur during equilibrium it is sensitive to the strong interplay between late time thermodynamic evolution and nuclear physics input. Depending on the conditions the peak forms either because of the pattern of the neutron capture rates or because of the pattern of the separation energies. We analyze three mass models under different thermodynamic conditions. We find that the subtleties of each mass model, including separation energies and neutron capture rates, influence not only the final shape of the peak but also when it forms. We identify the range of nuclei which are influential in rare earth peak formation.
pacs:
20.30.-k, 26.30.Hj, 26.50.+xI Introduction
Approximately half of the elements beyond are made in the ‘rapid’ neutron capture process, or -process, in which successive neutron captures occur on timescales faster than -decays. At the present time, there is significant uncertainty with the astrophysical environment responsible for this synthesis event Arnould200797 ; Qian2007237 . The leading candidate site argast2004 is believed to be core-collapse supernovae e.g 1992ApJ…399..656M ; 1996ApJ…471..331Q ; 2000PASJ…52..601S ; 2000ApJ…533..424O ; 2001ApJ…562..887T ; 2005NuPhA.752..550Q ; 2011PrPNP..66..346T even though most recent simulations do not yield favorable conditions for the -process arcones2007 ; 2010A&A…517A..80F ; 2010PhRvL.104y1101H . Other candidate sites include compact object mergers 1977ApJ…213..225L ; 1999ApJ…525L.121F ; 2005NuPhA.758..587G ; 2008ApJ…679L.117S ; 2010MNRAS.406.2650M ; 2011ApJ…738L..32G ; 2011arXiv1106.6142W ; Caballero2011arXiv1105.6371C , gamma-ray burst outflows 2004ApJ…603..611S ; 2005NuPhA.758..189M ; 2006ApJ…643.1057S , neutrino induced nucleosynthesis in He shells PhysRevLett.106.201104 ; 2011PhRvL.106t1104B , supernova fallback 2006ApJ…646L.131F , and collapse of O-Ne-Mg cores 1998ApJ…493L.101W ; 2003ApJ…593..968W ; 2007ApJ…667L.159N .
Experimentally, it is difficult to measure the properties of the short-lived nuclei far from stability that participate in the -process. Recent developments using radioactive beams show promise (e.g. PhysRevLett.94.112501 ; 2009AIPC.1098..153J ), but current experimental data on neutron-rich isotopes is limited. Thus -process studies must rely not only on model calculations of the environment, but also on theoretical mass models, e.g. Moller1995 ; 1996PhLB..387..455P ; 2009PhRvL.102o2503G .
Despite these difficulties, much has been learned about the -process over the past 50 years. The most prominent features in the -process abundance distribution above atomic mass number of are two distinct peaks occurring at and . It was hypothesized very early that the formation of these peaks should be associated with the long -decay rates of closed neutron shells 1957RvMP…29..547B . Since this seminal paper much effort has been put in to researching the conditions for a sufficient initial neutron-to-seed ratio, a key requirement in order to produce a ‘main’ -process out to the third peak (). For reviews see Arnould200797 ; 2003PrPNP..50..153Q ; Cowan:1991zz ; Qian2007237 .
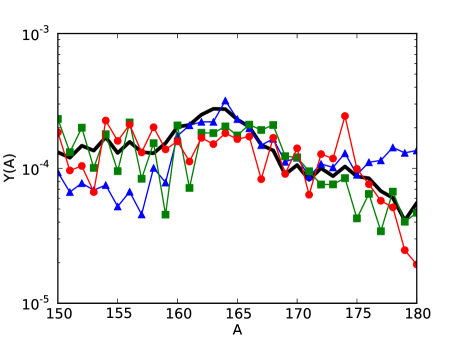
After the two main peaks, the second most prominent feature above A=100 is the smaller peak near known as the rare earth peak. While less abundant than the other peaks, the rare earth peak can in principle be used as a powerful tool and offers an alternative way to probe the -process. This is due to the following properties: (1) Observational data from metal-poor stars show very consistent trends among the rare earth and heavier elements. This suggests that these elements were created in the same type of synthesis event 2008ARA&A..46..241S . Thus, the rare earth peak provides a natural diagnostic of -process models. (2) The rare earth peak forms away from closed neutron or proton shells and therefore by a different mechanism than the main peaks. This means it is a different and unique probe of late-time -process conditions. (3) The rare earth peak is extremely sensitive not only to late-time thermodynamic behavior, but also to nuclear physics input Surman:1997 ; Mumpower2010ncr ; 2011PhRvC..83d5809A . Typical variations in final rare earth abundance patterns from simulations with different mass models are highlighted in Figure 1.
To date the rare earth region has received relatively little attention. Fission cycling has been suggested as a mechanism for obtaining the rare earth peak 1957PASP…69..201C ; 1971Natur.231..103S , but it is not favored marti&zeh1985 . Large uncertainties found in fission probabilities and fragment distributions of current nuclear models further compound difficulties with a successful description of rare earth peak formation by fission cycling 2011ApJ…738L..32G . Surman et al. Surman:1997 investigated the formation of the peak in a hot -process environment with temperatures high enough to support equilibrium. The formation of the rare earth peak under these conditions was attributed to the co-action of nuclear deformation and -decay as the free neutrons are quickly captured during freeze-out. This was followed by a study of late-time abundances changes among the major peaks 2001PhRvC..64c5801S . Otsuki et al. 2003NewA….8..767O investigated a range of r-process models and found similar rare earth elemental abundance patterns, provided the temperature was constant during freeze-out. Most recently, Arcones et al. 2011PhRvC..83d5809A studied the sensitivity of late-time abundance fluctuations to changes in the nuclear physics inputs. Arcones et al. 2011PhRvC..83d5809A pointed out that the rare earth peak is sensitive to changes at late-times, e.g. to non-equilibrium effects such as neutron capture even when the abundance of free neutrons can become very low ().
This manuscript presents a more complete picture of rare earth peak formation. We explore the sensitivity of the peak formation mechanism to late-time thermodynamic behavior and nuclear physics input. The ‘funneling’ formation mechanism of Surman:1997 is reviewed for hot evolutions. We introduce a different ‘trapping’ mechanism for peak formation in cold evolutions where the temperatures and densities decline relatively quickly and therefore photo-dissociation plays no role in the late-time dynamics after . We study the effects of three different mass models and show how large uncertainties in this region stem from nuclear physics. Lastly, we show that the nuclei which contribute to peak formation are approximately 10 to 15 neutrons from stability, and thus represent prime candidates to be measured in future radioactive ion beam facilities (FRIB 111http://www.frib.msu.edu or FAIR 222http://www.gsi.de/portrait/fair.html).
II r-Process Conditions and Calculations
Abundance weighted lifetimes are used throughout the text to characterize the late-time dynamics of the -process. These are provided below for the reader’s convenience:
| (1a) |
| (1b) |
| (1c) |
where is the neutron number density, the thermally averaged neutron capture cross section for nuclei , the photo-dissociation rate for nuclei , the full -decay rate (including -delayed neutron emission channels) for nuclei and the abundance of nuclei . A reduced sum denoted with a superscript “REP” is taken over the rare earth region, to , when applicable. The neutron-to-seed ratio or is defined as:
| (2) |
where is the abundance of free neutrons.
Since rare earth peak formation is highly dependent on the rate of decrease in the temperature and density, we consider rare earth peak formation under two different thermodynamic evolutions. One scenario is a classical ‘hot’ -process which operates under high temperatures () at the time in which neutron captures are important for peak formation. A second scenario is a ‘cold’ -process which operates under low temperatures () at the time in which neutron captures are important for peak formation 2007ApJ…666L..77W .
The classical -process begins with a phase of equilibrium marked by an abundance weighted lifetime ratio of neutron capture to photo-dissociation of . During this phase the temperature is still sufficiently high so that neutron captures dominate -decays () and the Saha equation can be used to determine abundances along an isotopic chain Cowan:1991zz .
The second phase, known as the freeze-out epoch, is marked by the weakening of the equilibrium () and the abundance weighted lifetime ratio of -decay versus neutron capture falls to . It is during this phase that the formation of the rare earth peak proceeds with competition between neutron captures, photo-disintegrations and -decays.
In the cold -process the first phase equilibrium is dramatically shorter than the first phase of the classical scenario. Freeze-out is now caused by a rapid drop in temperature rather than the consumption of free neutrons (as in the classical case). The bulk of the cold -process operates in the second phase, under low temperatures (), where photo-disintegrations have frozen out 2007ApJ…666L..77W .
Once neutron exhaustion () occurs in the cold -process the free neutrons available to the system must come from the recapture of -delayed emitted neutrons. The importance of this effect on the final abundance distribution was noted in 2010ApJ…712.1359F ; 2011PhRvC..83d5809A . This recapture effect is crucial to peak formation as can be seen from the fact that malformed abundance distributions result if -delayed neutron emission is artificially turned off (see 2011PhRvC..83d5809A ).
Our calculations consists of a nuclear reaction network containing -process relevant nuclides as described in Surman:1997 ; 2001PhRvC..64c5801S . Previous versions of this network code have been used in the studies of Beun Beun:2008gn and Surman Surman:2008ef . The primary reaction channels for nuclides in this section of the reaction network are beta-decay, neutron capture, and photo-dissociation. Our fully implicit -process reaction network handles consistently neutron capture rates at low temperatures and calculations with low abundances of free neutrons, both important for simulations with cold evolutions. For the initial abundances we use self-consistent output from an intermediate reaction network Hix:1999yd with PARDISO solver Schenk2004 .
Our -process calculations start at with densities g/cm3 for hot evolutions with and g/cm3 for cold evolutions with . At this time the neutron-to-seed ratios are and respectively. We study the late-time hot and cold -process evolutions in the context of a monotonically decreasing temperature with density parameterized as:
| (3) |
where controls the type of late-time -process evolution (the time when rare earth peak formation occurs). For hot -process evolutions we set and for cold -process evolutions we set . A decaying density of is characteristic of wind models 2002PhRvL..89w1101M ; panov&janka2009 at late times while represents a faster decline.
We use three different mass models in our nucleosynthesis calculations: Finite Range Droplet Model (FRDM) Moller1995 , Extended Thomas-Fermi with Strutinsky Integral and Quenching (ETFSI-Q) 1996PhLB..387..455P and version 17 of the Hartree Fock Bogoliubov masses (HFB-17) 2009PhRvL.102o2503G . The FRDM and ETFSI-Q neutron capture rates are from 2000ADNDT..75….1R and were computed with the statistical model code NON-SMOKER 1998sese.conf..519R . The HFB-17 neutron capture rates are from the publicly available Brusslib online-database 333http://www.astro.ulb.ac.be/ and were computed with the statistical model code TALYS 2008A&A…487..767G , which is also publicly available. The HFB mass model is under constant development and is therefore updated with the latest experimental data and theoretical techniques 444http://www.astro.ulb.ac.be/. The -decay rates used in our -process network come from 2003PhRvC..67e5802M .
III Peak Formation in Hot Environments
The mechanism for rare earth peak formation in hot environments was first described in Surman:1997 . We review the basic physical arguments in this section.
Under hot conditions the -process path (time ordered set of most abundant isotopes) traverses the NZ-plane between the line of stability and the neutron drip line. The path is initially constrained by equilibrium and is thus found to lie on a line of constant separation energy via the Saha equation. As the free neutrons are consumed, the path moves back toward stability and equilibrium begins to break down. During this freeze-out from equilibrium, rare earth peak formation can potentially occur.
The necessary and sufficient conditions for peak formation are as follows: (1) a deformation maximum or other nuclear structure effect must produce a kink in the lines of constant neutron separation energy around , and (2) the -process path must traverse this kink region during freeze-out, before -decay takes over in the region. The latter allows for the interplay of neutron capture, photo-dissociation and -decay as the -process path crosses the region which contains the separation energy kink.
During peak formation, the -process path moves toward stability at a rate approximately equal to the average -decay rate along the path. The separation energy kink causes a corresponding kink in the -process path as material moves through this important region. This provides a mismatch between the -decay rates of material below and above the kink. Due to the kink in the path, nuclei below the peak ( to ) are farther from stability and so -decay faster than the average nuclei along the path. Since the nuclei below the peak decay faster than the path moves, these nuclei then proceed to capture neutrons in an attempt to return the -process path back to equilibrium. Conversely, due to the kink in the path, nuclei above the peak ( to ) are closer to stability and so -decay slower than average along the path. The path therefore moves before these nuclei have a chance to decay and so they photo-dissociate to shift the -process path back to equilibrium. In the peak region ( to ) some nuclei are still in equilibrium which limits the amount of material flowing out of the peak region in either direction. The net result causes material to funnel into the peak region, creating the local maximum.
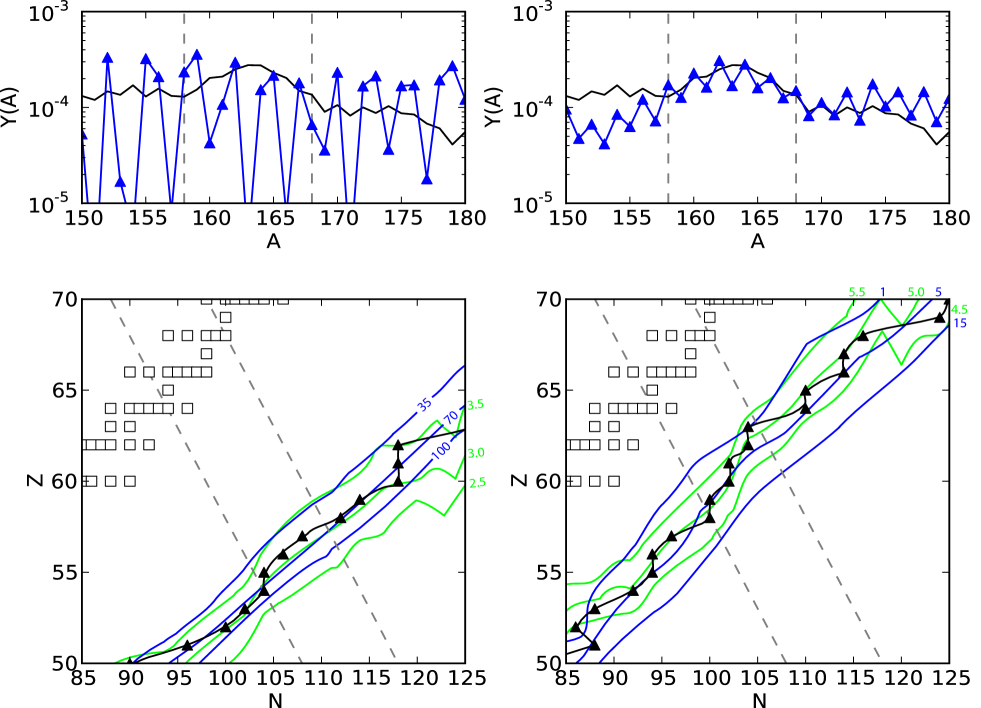
The essence of this effect is shown in Figure 2. At neutron exhaustion, (left panel), the -process is just beginning to break from equilibrium. Here the path lies along a line of constant separation energy ( MeV) and the abundances show an odd-even effect due to the population of primarily even-N nuclei in equilibrium. No peak exists at this time.
Later in the simulation (right panel), peak formation occurs as the path encounters the region with the separation energy kink. The separation energy kink causes the kink in the -process path. Nuclei along the path in the peak region have -decay rates which range from 1 (above the kink) to 10 (below the kink). The resultant photo-dissociation above the kink and -decay followed by neutron capture below the kink causes material to funnel into the peak region.
IV Peak Formation in Cold Environments
In the previous section we analyzed rare earth peak formation in hot evolutions and found that photo-dissociation was crucial in peak formation. However, we also find well formed solar-like rare earth peaks in simulations of cold environments where photo-dissociation plays no role in the dynamics after .
After , the cold -process path is controlled on average by the competition between neutron captures and -decays . Locally, over the rare earth region, the exact position of the path is more complicated due to the variation among individual rates.
As the material decays back to stability peak formation will ensue if the path encounters a peak region where neutron capture rates are slow relative to the above and below regions. The essence of the effect is that slow neutron capture rates in the peak region cause a bow (inwards towards stability) in the lines of constant neutron capture rates relative to the lines of constant -decay rates thus causing material to become trapped in the peak region.
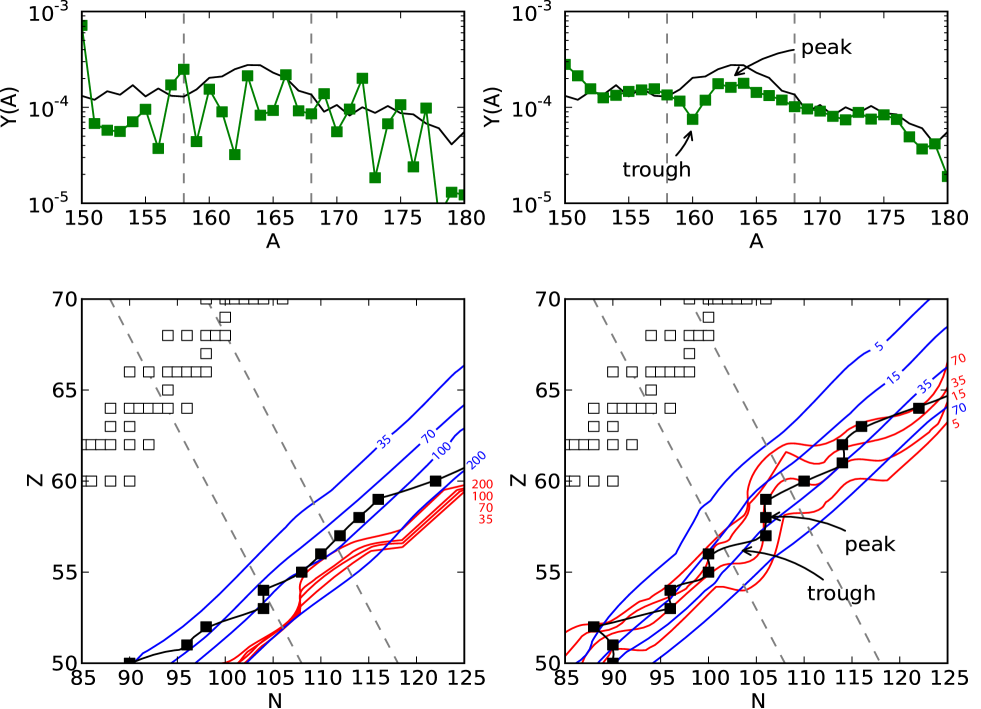
The cold formation mechanism is shown in Figure 3. The left panel shows a snapshot of the abundance pattern and rates at neutron exhaustion, . At this point in time the -process path is still influenced by residual photo-dissociation flows. This is reflected in an odd-even effect in the abundances and flat -process path (similar to hot evolutions). However, the photo-dissociation rates are decreasing so rapidly they play no further role in the dynamics after this point. Shortly, the neutron capture rates will become comparable to the -decay rates and large odd-even behavior of the abundances will be washed-out 1999ApJ…516..381F . In fact, this has already begun to happen as can be seen with the slight bowing of the neutron capture rate lines in the peak region ( to ).
At a slightly later time in the simulation (right panel of Figure 3) the system has moved closer to stability and the -process path now encounters the slower capture rates in the peak region. Below the peak ( to ) neutron captures occur much faster than -decay rates along the -process path, so the net result is material shifting towards the peak region. In the peak region the path encounters the slow capture rates (note the bowing of the neutron capture rate lines) so that any material being shifted into the peak region becomes hung up. Above the peak ( to ) the flow of material is again dominated by the relatively faster neutron capture rates. The net result is trapping of material into the peak region.
Another interesting feature in the right panel of Figure 3 is the trough to the left of the peak. A trough can occur if a gap in the -process path proceeds for long periods of time as matter decays back to stability. Along a gap in the -process path the neutron capture rates are relatively fast resulting in movement of material to more neutron-rich isotopes and a depletion of material in the gap region.
In our figures, the lines of constant neutron capture rates have been averaged over even-N nuclei. Even-N neutron capture rates are more important to rare earth peak formation because at a given temperature, odd-N nuclei have faster neutron capture rates which causes material to pass through the odd-N nuclei quickly. Thus material builds up (or stays) in even-N nuclei which sets the -process path. The importance of individual neutron capture rates in the rare earth peak was highlighted in Mumpower2010ncr .
V Influence of Mass Model on Rare Earth Peak Formation
From the previous two sections it is clear that the details of the late-time thermodynamic evolution are critical in setting the relevant nuclear physics and thus determine the mechanism for peak formation.
Despite the differences in peak formation mechanisms, we find that the final abundances among simulations with the same mass model yet differing late-time thermodynamic behavior can be remarkably similar. This is in contrast to the differences found in the final abundance pattern when comparing between mass models with similar thermodynamic conditions. In this section we focus on the influence of different separation energies and neutron capture rates on rare earth peak formation.
A successful peak formation is imprinted on the final abundances in a cold evolution when the -process path encounters structure in the neutron capture rates and this structure lasts until the point at which -decays take over neutron captures in the region ().
A successful peak formation occurs in a hot evolution when the -process path encounters a local deformation maximum leading to a well-defined kink structure in the separation energies in the rare earth region.
For a given mass model, the structure of neutron capture rates and the structure of the separation energies may not align in the NZ-plane. This in turn can affect the timing and location of peak formation and hence the nuclei which are relevant.
Odd-even effects in the abundances can accumulate or persist through the decay back to stability resulting in visible features in the final abundances. Smoothing of the abundances typically occurs in between neutron capture freeze-out () and the time in which -decays fully take over neutron captures in the region ().
We now discuss three different mass models in this context. Since separation energies vary among mass models we instead (for consistency) use , the abundance weighted average neutrons from stability, to measure the -process path’s progression.
Compared to the other mass models studied here, we find that simulations which use the FRDM mass model best match the solar data in the rare earth peak region in both hot and cold evolutions. In fact we find (in agreement with previous studies Surman:1997 ; 2011PhRvC..83d5809A ) that the FRDM mass model is the only model to show a well-formed rare earth peak consistently in the final abundance pattern.
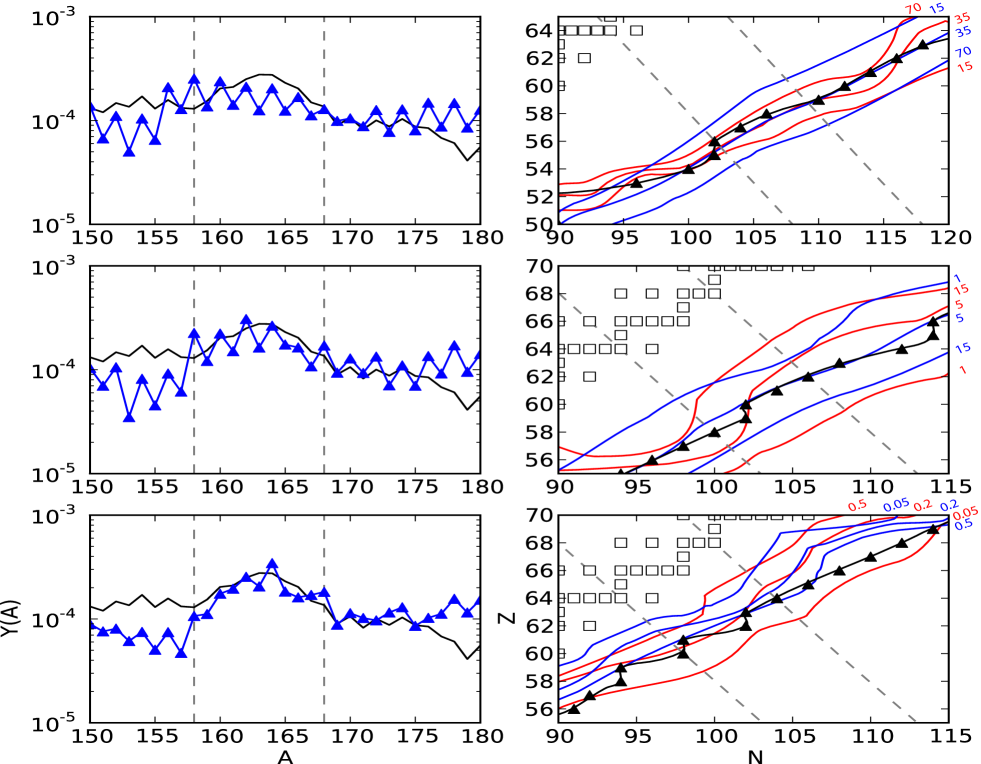
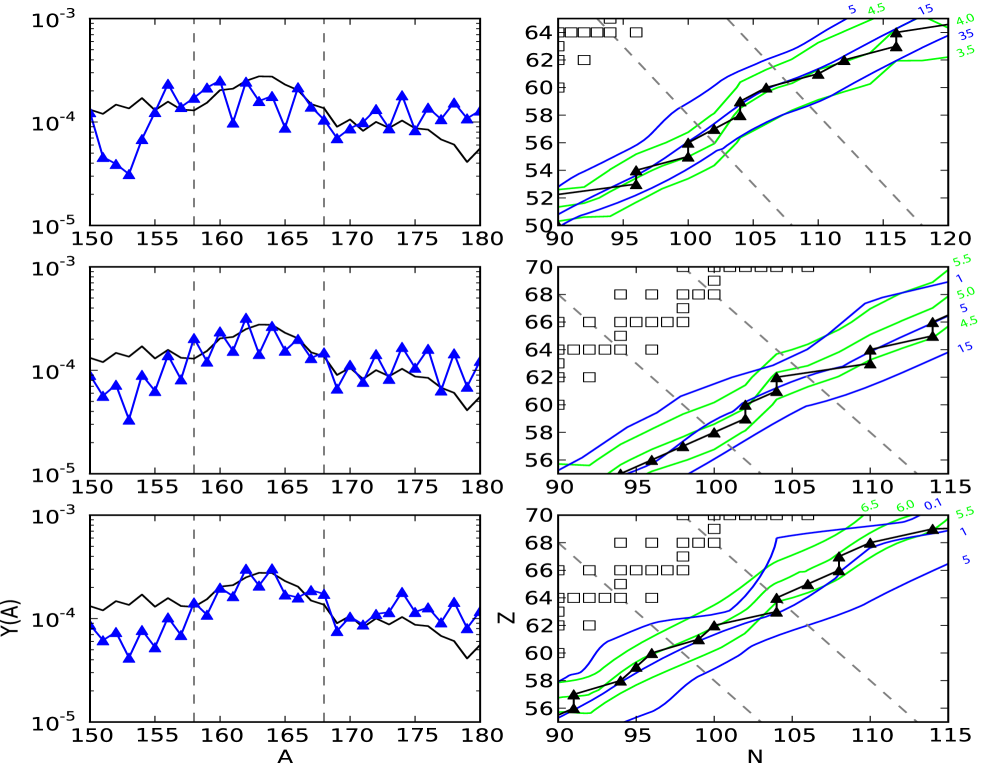
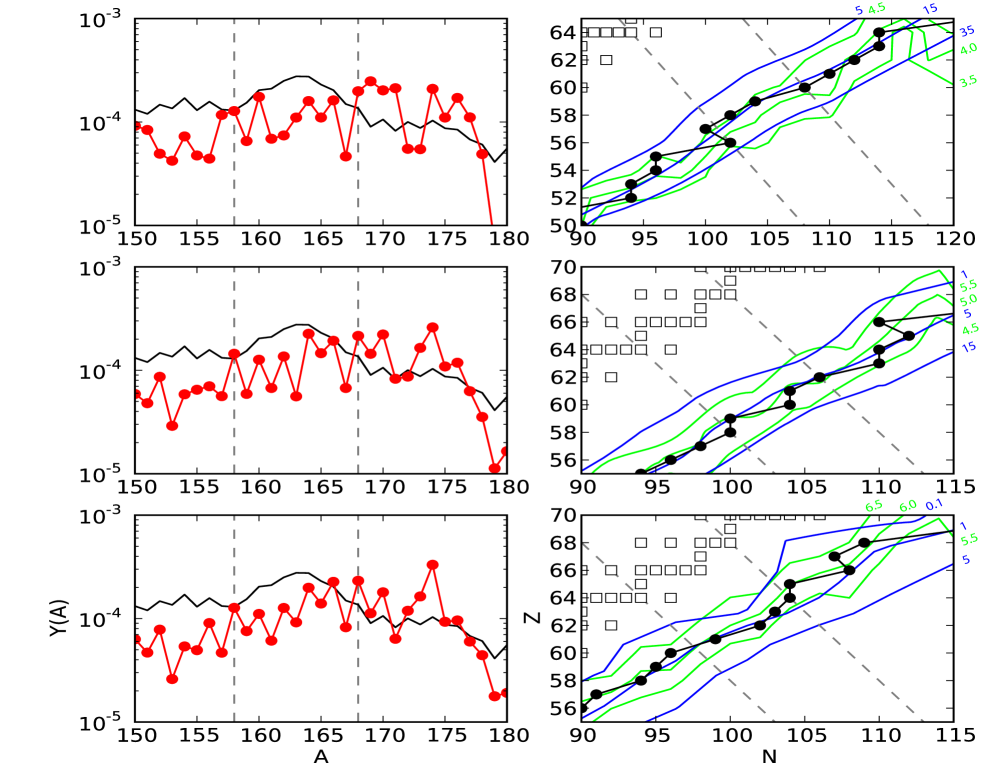
Simulations with the FRDM mass model do not consistently form rare earth peaks far from stability (). Instead, peak formation ensues when the path is much closer; on average in between 15 and 20 neutrons away from stability. We can see the evolution of the peak region for a cold FRDM evolution in Figure 4. At (top panel) the structure in the capture rates has yet to manifest itself resulting in relatively flat abundances. As the path moves back to stability, (middle panel), it encounters nuclei in the peak region with relatively slower neutron capture rates than the surrounding regions (note the bending in the red lines). These conditions persist all the way back to stability resulting in a well-formed rare earth peak. A similar scenario occurs in hot evolutions; see Figure 5.
FRDM shows a slight overlap between neutron capture structure and separation energy structure. The structure in the separation energies occurring between and the structure in the capture rates occurring between . This delays peak formation in cold scenarios until around 15 neutrons from stability, while hot evolutions typically begin peak formation approximately 20 neutrons from stability.
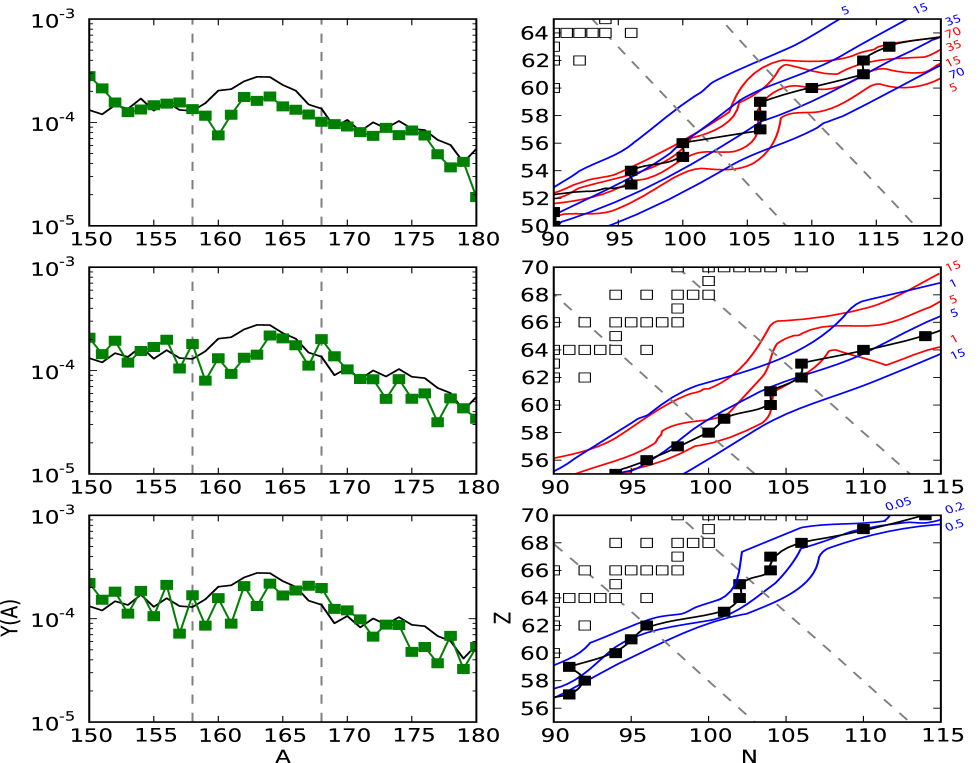
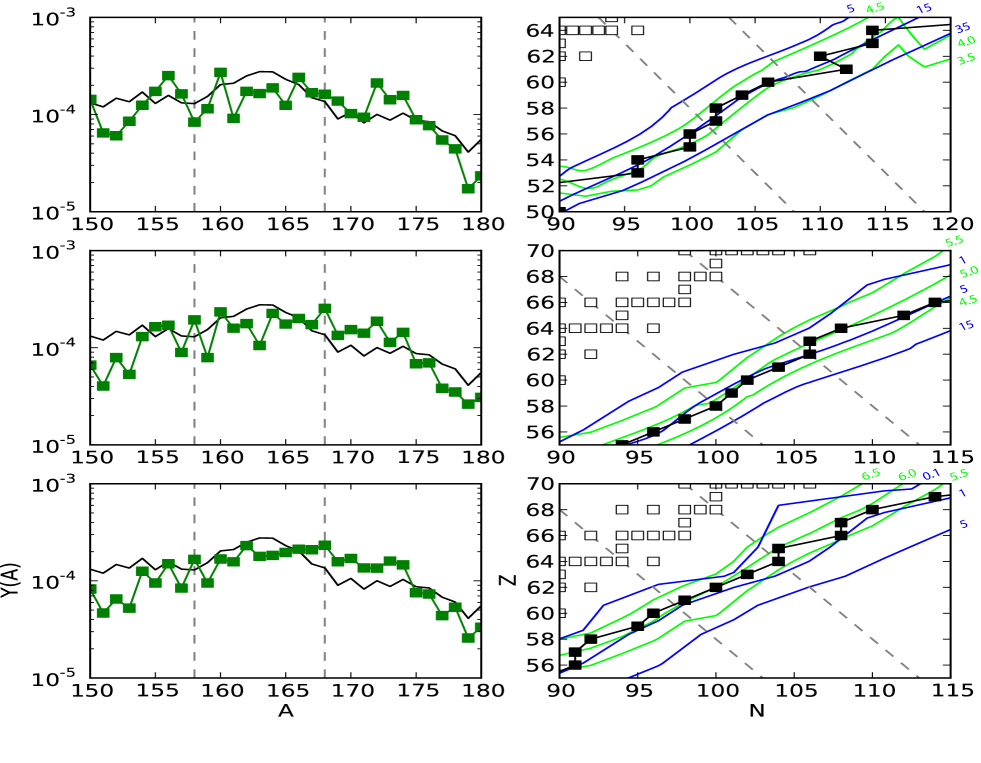
Simulations with the ETFSI mass model consistently form a solar-like rare earth peak far from the stable nuclei (). This is most apparent in colder simulations (see right panel of Figure 3). However, this is not the end of the story as the material must decay back to stability. Figure 6 highlights this transition at an abundance weighted average of (top panel), 15 (middle panel) and 10 (bottom panel) neutrons from stability. As the decay back to stability proceeds the -process path encounters nuclei whose neutron capture rates become homogeneous around the peak region. This slowly dissolves the structure, flattening the lines of constant neutron capture rates (compare top and middle panels). By the time the path is on average 15 neutrons away from stability (middle panel) the cold trapping mechanism can not continue because neutron capture rates in the peak region are no longer slower than the surrounding regions. These conditions persist back to stability resulting in a final abundance pattern with a more modest rare earth peak. Note that a small odd-even effect reappears since in this model -delayed neutron emission is still relevant as neutron capture freezes out in the rare earth region ().
Solar-like rare earth peaks form far from the stable nuclei in ETFSI models under hot evolutions as well. Far from stability, the structure (kink) in the separation energies results in the hot peak formation mechanism. Like the FRDM case, the separation energy kink in ETFSI disappears as one moves closer to stability. However, the kink disappears while neutron captures are still dominant () far from stability () resulting in a flattened final abundance distribution; see Figure 7.
In this mass model the structure in the separation energies occurs farther from stability () than the structure seen in the neutron capture rates () influencing peak formation in a similar fashion to the FRDM case. The gross separation energy structure occurs very early on “before” the top panel of Figure 7 and has already dissolved by .
Version 17 of the HFB mass model is optimized to over 2000 measured masses from 2003NuPhA.729….3A corresponding to a root mean square error of MeV. This data set features detailed structure in the separation energies but little overall structure in the neutron capture rates for the nuclei relevant to rare earth peak formation. These features are reflected in our -process abundances.
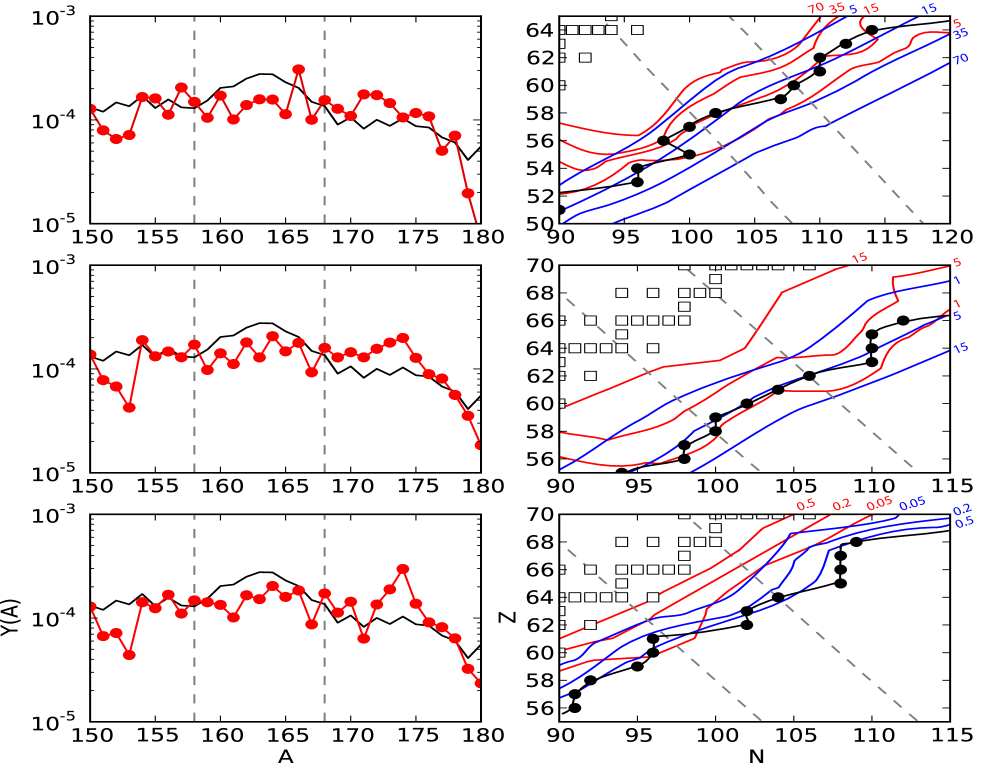
Figure 8 shows the decay back to stability of a cold -process using HFB-17. At every snapshot, highlighting the -process path’s decay back to stability, we do not find the structure in the neutron capture rates as is found in the other two mass models. It is this relative homogeneity in the neutron capture rates throughout the rare earth region which prevents the trapping mechanism from occurring in cold evolutions.
In hot -process evolutions the situation is more intricate than for the corresponding cases of the other two mass models. The detailed structure in the separation energies results in a complex separation energy kink structure in the rare earth region. However, due to the lack of gross structure as the separation energy increases (i.e. during the decay back to stability) the funneling mechanism cannot operate. This can be seen in Figure 9 and illustrates the subtleties involved in forming the rare earth peak.
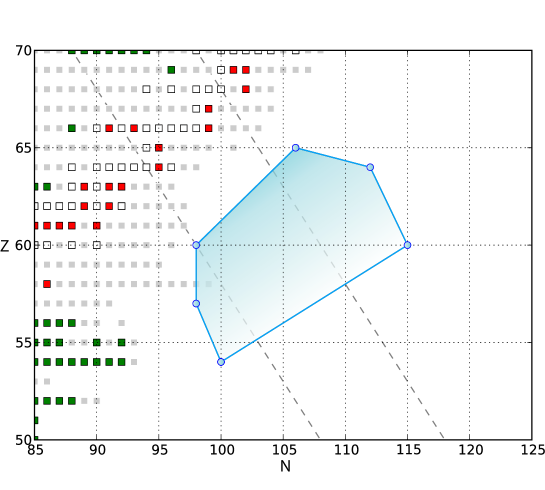
The discussion in this section showcases the need for nuclear structure measurements far from stability. As we have seen, the nuclei that are important for rare earth peak formation lie in between 10 and 20 neutrons away from stability. Furthermore, it is the nuclei which are the closest to stability, those in between 10 and 15 neutrons from stability, which are most influential to peak formation as they set or potentially dissolve the peak structure all together. In Figure 10 we highlight these influential nuclei together with recent experimental mass measurements (555http://isoltrap.web.cern.ch 666https://www.jyu.fi/fysiikka/en/research/accelerator/igisol/trap green and 2003NuPhA.729….3A gray) and known neutron capture rates (777http://www.nndc.bnl.gov/exfor red).
VI Summary and Conclusions
We have studied the formation and evolution of the rare earth peak at late-times during the -process. To take into account uncertainties with nuclear physics in the region our calculations employed three mass models (FRDM, ETFSI, and HFB-17).
Two late-time evolutions were considered: A hot -process with temperatures high enough to support equilibrium and a cold -process with lower temperatures where there are no photo-dissociation flows, only competition between neutron captures and -decays after . Both of these evolutions are similar at early times so that the changes in abundances are not due to to the physics that sets the neutron-to-seed ratio, but instead due to the changes in the nuclear physics input or changes in the late-time behavior of the evolution. The differences in late-time evolution (hot vs cold) determine which nuclear physics input is important (separation energies vs neutron capture rates respectively) during the final stages of the -process.
In hot evolutions the combination of photo-dissociation, neutron capture and beta-decay results in a mechanism which funnels material into the peak region. A successful peak formation in hot evolutions is imprinted on the abundance pattern when the structure in the separation energies, the ‘kink’, is well defined and the -process path crosses the kink region during the freeze-out.
We contrast this with the peak formation mechanism which occurs in cold -process environments. Here the important nuclear physics for peak formation lies in the local structure of the neutron capture rates. When the neutron capture rates are slow in the peak region relative to the surrounding regions (creating the characteristic ‘bow’ in the lines of constant neutron capture rates) material can become trapped in the peak region, thus forming the peak. A successful peak formation in cold evolutions is imprinted on the abundance pattern when the structure in the neutron capture rates lasts until the point at which -decays take over neutron captures in the region ().
The rare earth peak is extremely sensitive to the subtleties of nuclear physics input. Neutron capture is particularly important in both hot and cold evolutions. For instance, we find that neutron capture can play two competing roles in peak formation: it can be responsible for creating the peak, but also for potentially dissolving the peak (wash-out). Neutron capture rate structure and separation energy structure in the same mass model may not overlap in the NZ-plane. This in turn can affect the timing and location of peak formation in different thermodynamic conditions.
We have shown that the rare earth peak in principle offers unique insight into the late-time behavior of the -process because it forms away from the closed shells during freeze-out while material decays back to stability. Rare earth peak formation is sensitive to the structure of separation energies and / or neutron capture rates about 10 to 15 neutrons away from the stable rare earth peak. Future measurements at radioactive ion beam facilities should reach this important region and will be critical in placing constraints on nuclear models. This in turn will lead to improved -process predictions; allowing the rare earth peak to evolve into a powerful tool for understanding the -process.
VII Acknowledgements
We thank A. Arcones and T. Rauscher for valuable discussions. We thank North Carolina State University for providing the high performance computational resources necessary for this project. This work was supported in part by U.S. DOE Grant No. DE-FG02-02ER41216, DE-SC0004786, and DE-FG02-05ER41398.
References
- [1] M. Arnould, S. Goriely, and K. Takahashi. The r-process of stellar nucleosynthesis: Astrophysics and nuclear physics achievements and mysteries. Physics Reports, 450(4-6):97 – 213, 2007.
- [2] Y.-Z. Qian and G.J. Wasserburg. Where, oh where has the r-process gone? Physics Reports, 442(1-6):237 – 268, 2007. The Hans Bethe Centennial Volume 1906-2006.
- [3] D. Argast, M. Samland, F.-K. Thielemann, and Y.-Z. Qian. Neutron star mergers versus core-collapse supernovae as dominant r-process sites in the early Galaxy. Astronomy and Astrophysics, 416:997–1011, March 2004.
- [4] B. S. Meyer, G. J. Mathews, W. M. Howard, S. E. Woosley, and R. D. Hoffman. R-process nucleosynthesis in the high-entropy supernova bubble. Astrophys. J. , 399:656–664, November 1992.
- [5] Y.-Z. Qian and S. E. Woosley. Nucleosynthesis in Neutrino-driven Winds. I. The Physical Conditions. Astrophys. J. , 471:331–+, November 1996.
- [6] K. Sumiyoshi, H. Suzuki, K. Otsuki, M. Terasawa, and S. Yamada. Hydrodynamical Study of Neutrino-Driven Wind as an r-Process Site. ”Publ. of the Astronomical Society of Japan”, 52:601–611, August 2000.
- [7] K. Otsuki, H. Tagoshi, T. Kajino, and S.-y. Wanajo. General Relativistic Effects on Neutrino-driven Winds from Young, Hot Neutron Stars and r-Process Nucleosynthesis. Astrophys. J. , 533:424–439, April 2000.
- [8] T. A. Thompson, A. Burrows, and B. S. Meyer. The Physics of Proto-Neutron Star Winds: Implications for r-Process Nucleosynthesis. Astrophys. J. , 562:887–908, December 2001.
- [9] Y.-Z. Qian. Nuclear physics and astrophysics of the r-process. Nuclear Physics A, 752:550–559, April 2005.
- [10] F.-K. Thielemann, A. Arcones, R. Käppeli, M. Liebendörfer, T. Rauscher, C. Winteler, C. Fröhlich, I. Dillmann, T. Fischer, G. Martinez-Pinedo, K. Langanke, K. Farouqi, K.-L. Kratz, I. Panov, and I. K. Korneev. What are the astrophysical sites for the r-process and the production of heavy elements? Progress in Particle and Nuclear Physics, 66:346–353, April 2011.
- [11] A. Arcones, H.-T. Janka, and L. Scheck. Nucleosynthesis-relevant conditions in neutrino-driven supernova outflows. I. Spherically symmetric hydrodynamic simulations. Astronomy and Astrophysics, 467:1227–1248, June 2007.
- [12] T. Fischer, S. C. Whitehouse, A. Mezzacappa, F.-K. Thielemann, and M. Liebendörfer. Protoneutron star evolution and the neutrino-driven wind in general relativistic neutrino radiation hydrodynamics simulations. Astronomy and Astrophysics, 517:A80+, July 2010.
- [13] L. Hüdepohl, B. Müller, H.-T. Janka, A. Marek, and G. G. Raffelt. Neutrino Signal of Electron-Capture Supernovae from Core Collapse to Cooling. Physical Review Letters, 104(25):251101–+, June 2010.
- [14] J. M. Lattimer, F. Mackie, D. G. Ravenhall, and D. N. Schramm. The decompression of cold neutron star matter. Astrophys. J. , 213:225–233, April 1977.
- [15] C. Freiburghaus, S. Rosswog, and F.-K. Thielemann. R-Process in Neutron Star Mergers. Astrophys. J. , 525:L121–L124, November 1999.
- [16] S. Goriely, P. Demetriou, H.-T. Janka, J. M. Pearson, and M. Samyn. The r-process nucleosynthesis: a continued challenge for nuclear physics and astrophysics. Nuclear Physics A, 758:587–594, July 2005.
- [17] R. Surman, G. C. McLaughlin, M. Ruffert, H.-T. Janka, and W. R. Hix. r-Process Nucleosynthesis in Hot Accretion Disk Flows from Black Hole-Neutron Star Mergers. Astrophys. J. , 679:L117–L120, June 2008.
- [18] B. D. Metzger, G. Martínez-Pinedo, S. Darbha, E. Quataert, A. Arcones, D. Kasen, R. Thomas, P. Nugent, I. V. Panov, and N. T. Zinner. Electromagnetic counterparts of compact object mergers powered by the radioactive decay of r-process nuclei. Monthly Notices of the Royal Astronomical Society, 406:2650–2662, August 2010.
- [19] S. Goriely, A. Bauswein, and H.-T. Janka. r-process Nucleosynthesis in Dynamically Ejected Matter of Neutron Star Mergers. The Astrophysical Journal Letters, 738:L32+, September 2011.
- [20] S. Wanajo and H.-T. Janka. The r-process in the neutrino-driven wind from a black-hole torus. ArXiv e-prints, June 2011.
- [21] O. L Caballero, G. C. McLaughlin, and R. Surman. Neutrino Spectra from Accretion Disks: Neutrino General Relativistic Effects and the Consequences for Nucleosynthesis. ArXiv e-prints, May 2011.
- [22] R. Surman and G. C. McLaughlin. Neutrinos and Nucleosynthesis in Gamma-Ray Burst Accretion Disks. Astrophys. J. , 603:611–623, March 2004.
- [23] G. C. McLaughlin and R. Surman. Prospects for obtaining an r process from Gamma Ray Burst Disk Winds. Nuclear Physics A, 758:189–196, July 2005.
- [24] R. Surman, G. C. McLaughlin, and W. R. Hix. Nucleosynthesis in the Outflow from Gamma-Ray Burst Accretion Disks. Astrophys. J. , 643:1057–1064, June 2006.
- [25] Projjwal Banerjee, W. C. Haxton, and Yong-Zhong Qian. Long, cold, early process? neutrino-induced nucleosynthesis in he shells revisited. Phys. Rev. Lett., 106(20):201104, May 2011.
- [26] P. Banerjee, W. C. Haxton, and Y.-Z. Qian. Long, Cold, Early r Process? Neutrino-Induced Nucleosynthesis in He Shells Revisited. Physical Review Letters, 106(20):201104–+, May 2011.
- [27] C. L. Fryer, F. Herwig, A. Hungerford, and F. X. Timmes. Supernova Fallback: A Possible Site for the r-Process. Astrophys. J. , 646:L131–L134, August 2006.
- [28] J. C. Wheeler, J. J. Cowan, and W. Hillebrandt. The r-Process in Collapsing O/Ne/Mg Cores. Astrophys. J. , 493:L101+, February 1998.
- [29] S. Wanajo, M. Tamamura, N. Itoh, K. Nomoto, Y. Ishimaru, T. C. Beers, and S. Nozawa. The r-Process in Supernova Explosions from the Collapse of O-Ne-Mg Cores. Astrophys. J. , 593:968–979, August 2003.
- [30] H. Ning, Y.-Z. Qian, and B. S. Meyer. r-Process Nucleosynthesis in Shocked Surface Layers of O-Ne-Mg Cores. Astrophys. J. , 667:L159–L162, October 2007.
- [31] P. T. Hosmer, H. Schatz, A. Aprahamian, O. Arndt, R. R. C. Clement, A. Estrade, K.-L. Kratz, S. N. Liddick, P. F. Mantica, W. F. Mueller, F. Montes, A. C. Morton, M. Ouellette, E. Pellegrini, B. Pfeiffer, P. Reeder, P. Santi, M. Steiner, A. Stolz, B. E. Tomlin, W. B. Walters, and A. Wöhr. Half-life of the doubly magic -process nucleus . Phys. Rev. Lett., 94:112501, Mar 2005.
- [32] K. J. Jones, S. D. Pain, R. L. Kozub, A. S. Adekola, D. W. Bardayan, J. C. Blackmon, W. N. Catford, K. Y. Chae, K. Chipps, J. A. Cizewski, L. Erikson, A. L. Gaddis, U. Greife, R. Grzywacz, C. Harlin, R. Hatarik, J. A. Howard, J. James, R. Kapler, W. Królas, J. F. Liang, Z. Ma, C. Matei, B. H. Moazen, C. D. Nesaraja, P. D. O’Malley, N. P. Patterson, S. V. Paulauskas, D. Shapira, J. F. Shriner, M. Sikora, D. J. Sissom, M. S. Smith, T. P. Swan, J. S. Thomas, and G. L. Wilson. Studies of nuclei close to 132Sn using single-neutron transfer reactions. In K. Ernst Rehm, B. B. Back, H. Esbensen, & C. J. (. Lister, editor, American Institute of Physics Conference Series, volume 1098 of American Institute of Physics Conference Series, pages 153–160, March 2009.
- [33] P. Möller, J. R. Nix, W. D. Myers, and W. J. Swiatecki. Nuclear Ground-State Masses and Deformations. Atomic Data and Nuclear Data Tables, 59:185–+, 1995.
- [34] J. M. Pearson, R. C. Nayak, and S. Goriely. Nuclear mass formula with Bogolyubov-enhanced shell-quenching: application to r-process. Physics Letters B, 387:455–459, February 1996.
- [35] S. Goriely, N. Chamel, and J. M. Pearson. Skyrme-Hartree-Fock-Bogoliubov Nuclear Mass Formulas: Crossing the 0.6MeV Accuracy Threshold with Microscopically Deduced Pairing. Physical Review Letters, 102(15):152503–+, April 2009.
- [36] E. M. Burbidge, G. R. Burbidge, W. A. Fowler, and F. Hoyle. Synthesis of the Elements in Stars. Reviews of Modern Physics, 29:547–650, 1957.
- [37] Y.-Z. Qian. The origin of the heavy elements: Recent progress in the understanding of the r-process [review article]. Progress in Particle and Nuclear Physics, 50:153–199, 2003.
- [38] John J. Cowan, Friedrich-Karl Thielemann, and James W. Truran. The R-process and nucleochronology. Phys. Rept., 208:267–394, 1991.
- [39] C. Sneden, J. J. Cowan, and R. Gallino. Neutron-Capture Elements in the Early Galaxy. Annual Review of Astronomy and Astrophysics, 46:241–288, September 2008.
- [40] Rebecca Surman, Jonathan Engel, Jonathan R. Bennett, and Bradley S. Meyer. Source of the Rare-Earth Element Peak in r-Process Nucleosynthesis. Phys. Rev. Lett., 79:1809–1812, 1997.
- [41] M. Mumpower, G. C. McLaughlin, and R. Surman. The Influence of Neutron Capture Rates on the Rare Earth Peak. In Nuclei in the Cosmos., 2010.
- [42] A. Arcones and G. Martínez-Pinedo. Dynamical r-process studies within the neutrino-driven wind scenario and its sensitivity to the nuclear physics input. Phys. Rev. C, 83(4):045809–+, April 2011.
- [43] A. G. W. Cameron. Nuclear Reactions in Stars and Nucleogenesis. Publications of the Astronomical Society of the Pacific, 69:201–+, June 1957.
- [44] D. N. Schramm and W. A. Fowler. Synthesis of Superheavy Elements in the r-Process. Nature (London), 231:103–106, May 1971.
- [45] K. Marti and H. D. Zeh. History and current understanding of the Suess abundance curve. Meteoritics, 20:311–320, June 1985.
- [46] R. Surman and J. Engel. Changes in r-process abundances at late times. Phys. Rev. C, 64(3):035801–+, September 2001.
- [47] K. Otsuki, G. J. Mathews, and T. Kajino. r-Process abundance universality and actinide cosmochronology. New Astronomy, 8:767–776, November 2003.
- [48] http://www.frib.msu.edu.
- [49] http://www.gsi.de/portrait/fair.html.
- [50] S. Wanajo. Cold r-Process in Neutrino-driven Winds. Astrophys. J. , 666:L77–L80, September 2007.
- [51] K. Farouqi, K.-L. Kratz, B. Pfeiffer, T. Rauscher, F.-K. Thielemann, and J. W. Truran. Charged-particle and Neutron-capture Processes in the High-entropy Wind of Core-collapse Supernovae. Astrophys. J. , 712:1359–1377, April 2010.
- [52] J. Beun et al. Neutron capture on 130Sn during r-process freeze-out. J. Phys., G36:025201, 2009.
- [53] R. Surman, J. Beun, G. C. McLaughlin, and W. R. Hix. Neutron Capture Rates near A=130 which Effect a Global Change to the r-Process Abundance Distribution. 2008.
- [54] W. R. Hix and F. K. Thielemann. Computational Methods for Nucleosynthesis and Nuclear Energy Generation. 1999.
- [55] Olaf Schenk and Klaus Gärtner. Solving unsymmetric sparse systems of linear equations with pardiso. Future Gener. Comput. Syst., 20:475–487, April 2004.
- [56] B. S. Meyer. r-Process Nucleosynthesis without Excess Neutrons. Physical Review Letters, 89(23):231101–+, November 2002.
- [57] I. V. Panov and H.-T. Janka. On the dynamics of proto-neutron star winds and r-process nucleosynthesis. Astronomy and Astrophysics, 494:829–844, February 2009.
- [58] T. Rauscher and F.-K. Thielemann. Astrophysical Reaction Rates From Statistical Model Calculations. Atomic Data and Nuclear Data Tables, 75:1–351, May 2000.
- [59] T. Rauscher and F.-K. Thielemann. Global statistical model calculations and the role of isospin. In A. Mezzacappa, editor, Stellar Evolution, Stellar Explosions and Galactic Chemical Evolution, pages 519–+, 1998.
- [60] http://www.astro.ulb.ac.be/.
- [61] S. Goriely, S. Hilaire, and A. J. Koning. Improved predictions of nuclear reaction rates with the TALYS reaction code for astrophysical applications. Astronomy and Astrophysics, 487:767–774, August 2008.
- [62] http://www.astro.ulb.ac.be/.
- [63] P. Möller, B. Pfeiffer, and K.-L. Kratz. New calculations of gross -decay properties for astrophysical applications: Speeding-up the classical r process. Phys. Rev. C, 67(5):055802–+, May 2003.
- [64] C. Freiburghaus, J.-F. Rembges, T. Rauscher, E. Kolbe, F.-K. Thielemann, K.-L. Kratz, B. Pfeiffer, and J. J. Cowan. The Astrophysical r-Process: A Comparison of Calculations following Adiabatic Expansion with Classical Calculations Based on Neutron Densities and Temperatures. Astrophys. J. , 516:381–398, May 1999.
- [65] G. Audi, O. Bersillon, J. Blachot, and A. H. Wapstra. The Nubase evaluation of nuclear and decay properties. Nuclear Physics A, 729:3–128, December 2003.
- [66] http://isoltrap.web.cern.ch.
- [67] https://www.jyu.fi/fysiikka/en/research/accelerator/igisol/trap.
- [68] http://www.nndc.bnl.gov/exfor.
- [69] F. Kappeler, H. Beer, and K. Wisshak. s-process nucleosynthesis-nuclear physics and the classical model. Reports on Progress in Physics, 52:945–1013, August 1989.