On the Force-Freeness of the Photospheric Sunspot Magnetic Fields as Observed from Hinode (SOT/SP)
Abstract
A magnetic field is force-free if there is no interaction between the magnetic field and the plasma in the surrounding atmosphere i.e., electric currents are aligned with the magnetic field, giving rise to zero Lorentz force. The computation of various magnetic parameters such as magnetic energy (using virial theorem), gradient of twist of sunspot magnetic fields (computed from the force-free parameter ) and any kind of extrapolations, heavily hinge on the force-free approximation of the photospheric sunspot magnetic fields. Thus it is of vital importance to inspect the force-free behaviour of the sunspot magnetic fields. The force-freeness of the sunspot magnetic fields has been examined earlier by some researchers ending with incoherent results. The accurate photospheric vector field measurements with high spatial resolution are required to inspect the force-free nature of sunspots. For this purpose we use several vector magnetograms of high spatial resolution obtained from the Solar Optical Telescope/Spectro-Polarimeter (SOT/SP) aboard the Hinode. Both the necessary and the sufficient conditions for force-freeness are examined by checking global as well as local nature of equilibrium magnetic forces over sunspots. We find that the sunspot magnetic fields are not much away from the force-free configuration, although they are not completely force-free on the photosphere. The umbral and inner penumbral fields are more force-free than the middle and the outer penumbral fields. During their evolution, sunspot magnetic fields are found to maintain their proximity to force-free field behaviour. Although a dependence of net Lorentz force components is seen on the evolutionary stages of the sunspots, we do not find a systematic relationship between the nature of sunspot magnetic fields and the associated flare activity. Further, we examine whether the fields at the photosphere follow linear or non-linear force free conditions. After examining this in various complex and simple sunspots, we conclude that, in either case, the photospheric sunspot magnetic fields are closer to satisfy the non linear force-free field approximation.
1 Introduction
The concept of force-free magnetic fields first came into existence when Lüst & Schlüter (1954) pointed out that the cosmic magnetic fields often follow a condition given as,
| (1) |
Equation 1 represents zero Lorentz force and the field following this equation is known as force-free magnetic field (Chandrasekhar & Kendall, 1957; Chandrasekhar, 1961; Parker, 1979; Low, 1982). Chandrasekhar (1956a, b) explained many characteristics of the force-free field equation including its solutions in axisymmetric as well as in non-axially symmetric cases for = constant. Many of the characteristics of force-free behaviour in the solar atmosphere were discussed by Woltjer (1958); Molodenskii (1969); Molodensky (1974); Low (1973, 1974, 1977, 1978, 1980); Low & Nakagawa (1975); Low & Flyer (2007); Parker (1989, 1990) etc.
We can rewrite Equation 1 as,
| (2) |
which denotes that the electric current density J () is proportional to the magnetic field B. Here is a constant and some function of position. If we take divergence of the Equation 2, as a result of Maxwell’s equation
| (3) |
we get the following
| (4) |
Equation 4 shows that the force-free parameter remains constant along any field line. However, the can vary across the field lines. The z component of Equation 2 allows us to compute the distribution of on the photosphere (z=0):
| (5) |
Three cases may arise: (i) everywhere, i.e., there is no electric current in the atmosphere resulting in a potential field (for details please see, Schmidt (1964); Semel (1967); Sakurai (1982, 1989); Régnier & Priest (2007)) (ii) everywhere, i.e., linear force-free field state (see e.g., Nakagawa & Raadu, 1972; Gary, 1989; Sakurai, 1989; van Ballegooijen & Cranmer, 2010, etc) which is not always valid and (iii) varies spatially, i.e., nonlinear force-free magnetic field (see e.g., Sakurai, 1979; Low, 1982; Amari et al., 1997; Amari et al., 1999, 2006; Wiegelmann, 2004; Régnier & Priest, 2007; Schrijver et al., 2006, 2008; De Rosa et al., 2009; Metcalf et al., 2008; Mackay & van Ballegooijen, 2006b, a, 2009; Wheatland & Régnier, 2009, etc). This is the most common state expected (Low, 1985). However, the vector magnetograms with high spatial resolution are required to confirm the non-linear force-free state of sunspot magnetic fields.
The potential field approximation of sunspot fields does not appear valid due to the presence of local vertical current distributed over the sunspots (see, e.g. Su et al., 2009; Tiwari et al., 2009b, and references therein). The linear force-free field approximation has been found closely valid in a sunspot NOAA AR 5747 studied by Moon et al. (2002) using relatively lesser resolution data. In earlier works, perhaps the insufficient resolution of the data obscured the conclusions about the validity of linear/non-linear force-free field approximations. In the present work, we also inspect the validity of linear or nonlinear assumptions after examining the force-free nature of sunspot magnetic fields by using high spatial resolution photospheric vector magnetograms obtained from Solar Optical Telescope/Spectro-Polarimeter onboard the Hinode.
The general belief is that the photospheric field is not force-free due to high plasma (ratio of plasma pressure to magnetic pressure) and is force-free in the corona due to low plasma (see e.g., Gary, 2001). However this has become possible to verify on the photosphere with the advent of the vector magnetograms with high spatial resolution. Observations of vector magnetograms in the chromosphere will also make it feasible. However, such data are yet to obtain. Spatial variations of plasma and magnetic pressures over a sunspot observed in infrared lines have been studied by Solanki et al. (1993) and Mathew et al. (2004). The fields of the umbra were found more force-free than that of the penumbra. Here, we make an attempt to find the proximity of the photospheric field to force-free nature by using the high resolution vector magnetograms obtained from Hinode (SOT/SP). Metcalf et al. (1995) and Moon et al. (2002) have already performed some analysis in this regard using ground based observations. By using the observations of Stokes parameters at six wavelengths within the spectral line of Na I , Metcalf et al. (1995) concluded that the magnetic field for an active region (AR) NOAA 7216 is not force-free in the photosphere whereas it becomes force-free approximately 400 km above the photosphere in the chromosphere. Whereas Moon et al. (2002), by examining the observations of Fe I doublet and for 12 vector magnetograms of three active regions, found that the photospheric magnetic fields are not so far from the force-free nature as conventionally regarded. Another rigorous study in this regard was performed by Georgoulis & LaBonte (2004). With some limitations of their techniques and quality of data, Georgoulis & LaBonte (2004) concluded that the photospheric active region magnetic fields are not force-free.
All the above results are not well in agreement. One of the reasons may be the inadequate resolution of their data sets. The accurate photospheric vector magnetic field measurements with high spatial resolution are needed to fully examine (both necessary and sufficient conditions) the force-free nature of sunspots. We have used 19 high resolution vector magnetograms obtained from the Solar Optical Telescope/Spectro-Polarimeter (SOT/SP) aboard the Hinode to inspect the force-free behaviour of the photospheric sunspot magnetic fields. The effect of polarimetric noise present in the data obtained from SOT/SP does not affect much in derivation of the magnetic field parameters (Tiwari et al., 2009a; Gosain et al., 2010).
We have further analyzed total 60 vector magnetograms of four active regions: two complex and flare-productive, namely NOAA ARs 10930 and 10960, and two simple and relatively quiet, namely NOAA ARs 10933 and 10961. Total of 18 vector magnetograms for the AR 10930, 12 for the AR 10933, 15 for the ARs 10960 and 10961 each, have been analyzed to look at the variations in the force-free behavior during their temporal evolution on the one hand and to find any relationship with the flare activity on the other hand. We also investigate whether linear or non-linear force-free field approximation is closer to validity in the sunspot magnetic fields as observed from the SOT/SP.
The paper has been organized in the following way. The methods to test the local and global force-freeness of the photospheric sunspot magnetic fields has been illustrated in the following section (Section 2). In Section 3, we describe the data sets used and methods of its analysis. Section 4 portrays the details of the results obtained. Finally in Section 5, we present our conclusions with appropriate discussion.
2 Conditions for the Force-freeness of the Magnetic Fields
Before considering the parameters which depend on the force-free parameter and perform the modeling that are based on the force-free assumption, as discussed earlier, it is of vital importance to examine whether the photospheric magnetic fields are really force-free, and such approximations are realistic. For this purpose we need to examine both global and local nature of Lorentz forces, i.e., both the necessary and the sufficient conditions.
2.1 Necessary condition
We use the following well known property of the Lorentz force (Molodenskii, 1969; Molodensky, 1974; Parker, 1979; Low, 1985) that the Lorentz force can be written as the divergence of the Maxwell stress tensor:
| (6) |
We can convert the total force over a volume into the total Maxwell stress exerted upon the boundary surface (e.g., Parker, 1979; Low, 1985). Under the assumption that the magnetic field above the plane z=0 (photosphere) falls off enough as z goes to infinity, the net Lorentz force in the half-space z0 is just the Maxwell stress integrated over the plane z=0 (Aly, 1984; Low, 1985). Thus the components of the net Lorentz force at the plane z=0 can be expressed by the surface integrals as follows:
| (7) | |||||
| (8) | |||||
| (9) |
where , and are the components of the net Lorentz force. According to Low (1985) the necessary conditions for any magnetic field to be force-free are that
| (10) |
Where is the force due to the distribution of the magnetic pressure on z=0, as given by,
| (11) |
Thus the inequalities given by Equation 10 provide a test for whether a force-free field exists at the boundary plane z = 0 (photosphere). The criterion for the fields to be force-free is that the Equations 7, 8 and 9 normalized with respect to should each be much less than unity (Low, 1985). It was discussed by Metcalf et al. (1995) that the magnetic field is completely force-free if the aforementioned ratios are less or equal to 0.1.
It is to be noted, however, that the inequalities given by Equation 10 are only necessary condition for the fields to be force-free. The reason for this is that some information is lost in the surface integration in Equations 7, 8 and 9.
2.2 Sufficient condition
We can infer the sufficient condition for the force-freeness of sunspot magnetic fields from the distributions of vertical tension force over sunspots (Venkatakrishnan & Tiwari, 2010). In a force-free case the tension force will balance the gradient of magnetic pressure demanding for zero Lorentz force. The usefulness of the tension force has not found much attention earlier in the literature but for few studies (Venkatakrishnan, 1990a, b; Venkatakrishnan et al., 1993; Venkatakrishnan & Tiwari, 2010; Tiwari, 2010). Recently Venkatakrishnan & Tiwari (2010) pointed out the utility of tension force as a diagnostic of dynamical equilibrium of sunspots.
Let us begin with the equation of magneto-hydrostatic equilibrium
| (12) |
where first term is the Lorentz force, second term is the gradient of gas pressure and the last term is the gravitational force onto the plasma. Lorentz force (let us call it as F) can be split into two terms as,
| (13) |
The first term in the right hand side in the above equation is the tension force (let us call it as T). The second term represents the gradient of the magnetic pressure i.e., the force due to magnetic pressure. We can expand the vertical component of the tension force in terms of the derivatives of the transverse components of the magnetic fields as follows:
| (14) |
where, the last component in the right hand side has been drawn from the Equation 3.
In a force-free condition (Chandrasekhar, 1961; Parker, 1979), the tension force balances the magnetic pressure gradient. In that condition, the Equation of magneto-hydrostatic equilibrium reduces to hydrostatic equilibrium
| (15) |
which represents a state of lowest order pressure and density. In the cases when B is strong, the departures from the lowest order hydrostatic pressure and density will be large. Thus a small variations in B can lead to large variations in plasma parameters, and could be one explanation for existence of the variety of fine structures (Su et al., 2009; Tiwari et al., 2009b; Tiwari, 2009) in the strong magnetic field system of sunspots as observed from the high resolution data of SOT/SP.
In the Equation 15, the plasma pressure scale height will be independent of the scale height of the magnetic field. Whereas, in a tension-free field, the z-component of the magneto-hydrostatic equilibrium requires,
| (16) |
The field in this condition cannot be force-free. In the case when tension is zero, the scale height of the magnetic field becomes very large, and becomes vulnerable to magnetic reconnection with the over-lying pre-existing field system. This can lead to flare initiation (Venkatakrishnan, 1990a, b; Venkatakrishnan et al., 1993).
We have computed tension force using Equation 14 and expressed it in the units of dynes/cm3. It was found in the analysis of two active regions namely NOAA ARs 10933 and 10930 by Venkatakrishnan & Tiwari (2010) that the magnitude of vertical tension force attains values comparable to the force of gravity at several places over the sunspots. This must mean that the non-magnetic forces will not be able to balance this tension force. Only gradient of the magnetic pressure can match this force. These sunspot features where the magnetic tension balances the magnetic pressure gradient result into the force-free configurations. This serves as sufficient condition for verifying the force-freeness of the sunspot magnetic fields. We have evaluated the vertical tension force over all the sunspots that we have studied as listed in Table 1.
3 Data Sets Used and Its Analysis
We have used the high spatial resolution vector magnetograms of 19 active regions (ARs) obtained from the Solar Optical Telescope/Spectro-polarimeter (SOT/SP: Tsuneta et al. (2008); Suematsu et al. (2008); Ichimoto et al. (2008); Shimizu et al. (2008)) onboard the Hinode (Kosugi et al., 2007). A series of vector magnetograms of active regions (ARs) NOAA 10930, 10933, 10960 and 10961 have also been used to investigate the temporal changes in the force-free nature of the sunspot magnetic fields and also to find any relationship with the associated flare activities.
The calibration of the Hinode (SOT/SP) data have been done by using the standard “SP_PREP” routine developed by B. Lites which is available in the Solar Software package. The “SP_PREP” routine first computes the thermal shifts in the spectral and slit dimensions, and then applies the drift corrections for calibrating the data from level0 to level1. The prepared polarization spectra have then been inverted to obtain vector magnetic field components using an Unno-Rachkowsky (Unno, 1956; Rachkowsky, 1967) inversion under the assumption of Milne-Eddington (ME) atmosphere (Landolfi & Landi Degl’Innocenti, 1982; Skumanich & Lites, 1987). The ME code used for inversion is the ”STOKESFIT”, which have been developed by T. R. Metcalf and has been kindly made available in the Solar-Software package. We have used the latest version of the inversion code which returns the true field strengths along with the filling factor. Some of the data sets are also used from the Community Spectro-polarimetric Analysis Center (CSAC; http://www.csac.hao.ucar.edu/).
Due to insensitivity of Zeeman effect to orientation of the transverse fields, an inherent 180∘ ambiguity in the azimuth determination will be present. Numerous techniques have been developed and applied to resolve this problem, but still complete resolution is not possible. The chromospheric and coronal structures are also proposed to complement the other methods. In the data sets which we have studied, the 180∘ azimuthal ambiguity have been removed by using acute angle method (Harvey, 1969; Sakurai et al., 1985; Cuperman et al., 1992). Most of the data sets used, have high spatial sampling with arcsec/pixel. A few samples are also observed in ”Normal mode” of SOT with a spatial sampling of arcsec/pixel. To minimize the projection effects, the vector fields are transformed to disk center (Venkatakrishnan & Gary, 1989) whenever they are much away from disk center, as is indicated in Tables 1 & 2.
We minimize the noise present in the data sets in the following way: the pixels with transverse and longitudinal magnetic field values greater than a certain level are only analysed. A quiet Sun region is selected for each sunspot to decide this critical threshold. Then 1 deviation in the three vector field components , and are evaluated separately. The resultant deviation in and is taken as 1 noise level for transverse field components. Those pixels with longitudinal and transverse fields simultaneously greater than twice the above mentioned noise levels are only analysed. This method to minimize the noise level has been successfully practiced (see, e.g. Tiwari et al., 2009b; Tiwari, 2009; Tiwari et al., 2010; Venkatakrishnan & Tiwari, 2009, 2010; Gosain et al., 2009, 2010, etc.).
In most of the active regions studied, the flux is balanced with less than or equal to 10% uncertainties. But some sunspots are single polarities with much larger imbalance of flux. Inclusion of such sunspots are justified as follows: we compare the values of , and by taking whole active region and each polarity separately for those cases when both polarities are available. It is found that when the flux is balanced i.e., both polarities are taken together, the values of , and are smaller than the values computed by taking the positive and negative polarities separately. Thus, in the cases when flux is highly imbalanced, we consider that the lower limits of the components of the net Lorentz forces are obtained. It means they are more force-free than they appear from the calculated values. Further, the flux balance is not a concern for sufficient condition as we compute the vertical tension force locally.
4 Results
We have studied the characteristics of Lorentz forces in the photospheric magnetic fields of 19 sunspots obtained from the high spatial resolution spectro-polarimetric observations by the instrument SOT/SP aboard the Hinode satellite. The values of Lorentz force components normalized with the respective magnetic pressure forces are given in Table 1. It can be noticed that the values of , and in most of the cases are approximately equal to 0.1 or, sometimes even smaller. In some cases when they are greater than 0.1, they are always lesser than 0.6. If the ratios , and are less than unity then the field is considered to be force-free (Low, 1985; Metcalf et al., 1995; Moon et al., 2002). Thus, we can conclude that the sunspot magnetic fields are not far from the force-free nature as has been suspected for long time. In contrast they show much closeness to the approximation of the force-free atmosphere in the photosphere. Our results are consistent with that of Moon et al. (2002), however, the quality of the data used in our analysis is far better.
We can notice that is negative for all the sunspots, except for one. The reason for negative can be understood in the following way: The plasma pressure is weaker in magnetic field concentrations such as in the sunspots as compared to the quiet Sun. Thus the gravity alone cannot cope with the upward pressure gradient force over sunspots. Therefore, to maintain the magnetohydrostatic equilibrium, downward Lorentz force is needed to balance excessive upward pressure gradient force. However can be positive or zero if the flux tubes lie very low in the atmosphere. There is yet another plausible explanation for the negative . The sunspot magnetic field is confined by strong exterior photospheric pressure. Since the sunspot field expands outward with the height, the Wilson effect would be equivalent to the expanded field pushing the photospheric plasma downward around the edge of the sunspot. If this effect dominates, then will be negative in the layer of the atmosphere where the polarimetric signals originate. On the other hand, if the field is loaded with the mass in the penumbral region, its weight can push the field downward giving rise to a positive to support that weight. If this depressed part of the field is within the layer of polarimetric measurement, we observe positive (B. C. Low 2011, private communication).
As discussed earlier, the above results are drawn merely from the necessary conditions as these reflect only global property of the sunspot magnetic fields. However, as sufficient condition for the force-freeness, we need to look at the distribution of Lorentz forces in the fine structures of sunspots. We computed the vertical component of the magnetic tension force, a component of the Lorentz force, by using Equation 14. For example, the vertical tension force distribution for two sunspots, one quiet and one complex, are shown in the Figures 1 and 2 respectively. The associated histograms are plotted in Figures 1(c) and 2(c) respectively. We distinguish between the nature of the vertical tension forces within the umbra and the penumbra, and this has been described later in Section 4.1.
| NOAA AR | Date: Time(UT) | Position | comment | |||||
|---|---|---|---|---|---|---|---|---|
| Number | of Observation | |||||||
| 10972 | 07 Oct 2007: 0200 | S05W10 | -0.137 | 0.203 | -0.500 | quiet,diffused | ||
| 10971 | 29 Sep 2007: 1011 | N03W04 | 0.006 | 0.102 | -0.508 | quiet,diffused | ||
| 10970 | 05 Sep 2007: 0203 | S07W46(t) | -0.155 | 0.213 | -0.148 | quiet,diffused | ||
| 10969 | 29 Aug 2007: 0001 | S05W33(t) | 0.384 | 0.131 | -0.253 | quiet | ||
| 10966 | 07 Aug 2007: 0500 | S06E20(t) | -0.028 | 0.196 | -0.345 | complex, weak | ||
| 10963 | 12 Jul 2007: 0001 | S06E20(t) | -0.003 | 0.119 | -0.206 | active | ||
| 10961 | 01 Jul 2007: 0304 | S13E05(t) | 0.024 | 0.172 | -0.271 | quiet | ||
| 10960 | 07 Jun 2007: 0304 | S07E07 | 0.137 | 0.093 | -0.482 | complex, active | ||
| 10956 | 18 May 2007: 0809 | N03W01 | 0.248 | -0.037 | -0.237 | complex, rotating | ||
| 10955 | 13 May 2007: 1100 | S09W28(t) | 0.254 | -0.035 | -0.349 | quiet | ||
| 10953 | 29 Apr 2007: 0001 | S10E22(t) | 0.046 | 0.067 | -0.089 | quiet, strong | ||
| 10944 | 03 Mar 2007: 0001 | S05W30(t) | 0.078 | -0.032 | -0.133 | quiet, strong | ||
| 10940 | 01 Feb 2007: 0708 | S04W05 | 0.055 | -0.033 | -0.279 | complex | ||
| 10939 | 22 Jan 2007: 1314 | S04W45(t) | 0.148 | -0.034 | -0.085 | complex | ||
| 10933 | 05 Jan 2007: 1213 | S04E03 | 0.045 | 0.002 | -0.108 | quiet | ||
| 10930 | 11 Dec 2006: 1314 | S05W07 | 0.039 | 0.038 | -0.062 | complex, rotating | ||
| 10926 | 03 Dec 2006: 0607 | S09W26(t) | 0.139 | 0.114 | -0.183 | complex | ||
| 10923 | 10 Nov 2006: 1617 | S06E40(t) | 0.152 | 0.007 | 0.037 | complex, strong | ||
| 10921 | 06 Nov 2006: 1415 | S08W35(t) | 0.195 | 0.121 | -0.222 | complex | ||
| (t) : transformed |
4.1 Nature of magnetic field in umbra and penumbra
It can be noticed that the magnitude of vertical tension at many places (almost everywhere in umbra and inner penumbra) reaches up to dyn/cm3. This value of the tension force is comparable with the gravitational forces experienced over sunspots which ranges from dyn/cm3 to dyn/cm3 for quiet sun density to sunspot umbral densities. Such high values of tension force can not be balanced only by non-magnetic forces i.e., gas pressure force and gravitational force. For example, when one component of the lorentz force (say tension force) becomes comparable to gravity, and other component (magnetic pressure force) is not matching, then the gas pressure force needs to become double to balance both gravity and magnetic tension. This being unlikely, we must only rely on magnetic pressure gradient to balance it. For an estimation of magnetic pressure gradient, let us make use of typical field strength values of G and G for spines and intraspines respectively in penumbra (e.g. Borrero et al., 2008). Considering a vertical scale height of km for magnetic field variation, we can estimate the magnetic pressure gradient () which comes out to be dyn/cm3. The magnetic tension force achieved in our study is comparable to this value at most of the places over sunspots. Thus, at those places where tension force is high, it is balanced by gradient of magnetic pressure leading to a force-free configuration. However, one should remember that the magnetic fields do not show a force-free behaviour over whole sunspot.
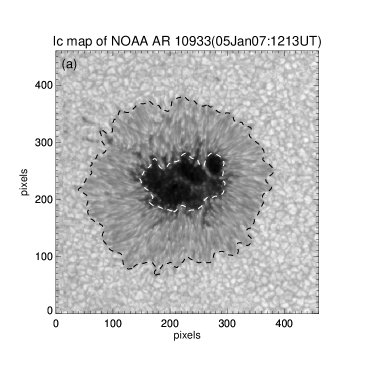
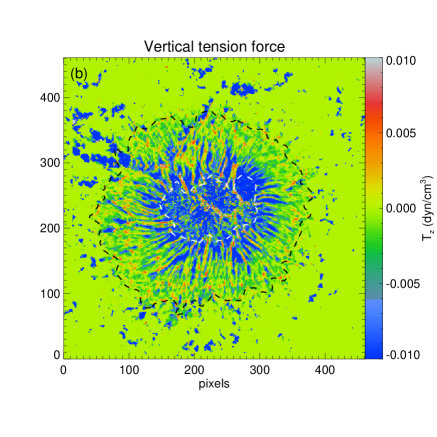

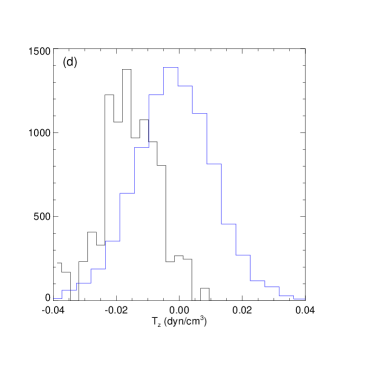
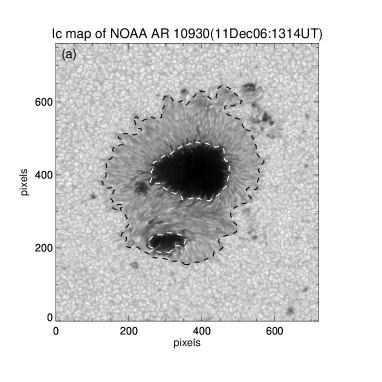
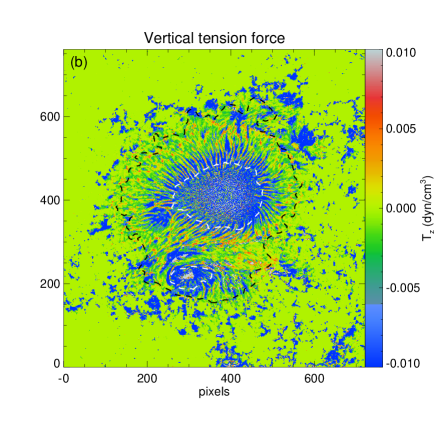

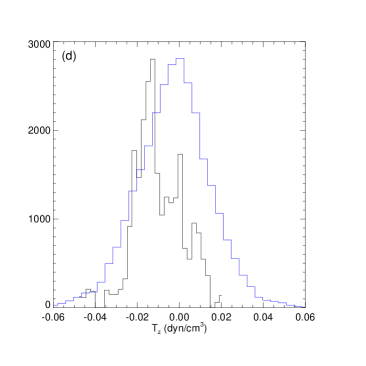
The contours shown in Figures 1(a), 1(b), 2(a) and 2(b) distinguish between the umbra and the penumbra of these two sunspots. The histograms of values in the umbra and penumbra are plotted separately in the panels ‘d’ of each figure. The blue and black coloured histograms are for values in the penumbra and umbra respectively. It is clearly evident from the peaks of both the histograms that the magnitudes of are higher in the umbra in comparison to the penumbra, thus indicating that the umbral fields are more force-free than the penumbral fields. From images, we can further note that the inner penumbra also shows high magnitudes of , thus indicating its force-free nature. The result that the umbral and inner penumbral fields are more force-free in comparison to the middle and the outer penumbral fields is in agreement with some earlier observations (see, e.g. Solanki et al., 1993; Mathew et al., 2004). The overall penumbral field seems to bear a mixed nature of magnetic fields depending upon nature of its fine structures (penumbral fibrils). Stronger tension forces are found in stronger and more vertical fields (Venkatakrishnan & Tiwari, 2010). Therefore, we can also conclude that, in the penumbra, the fields are more force-free in the spines which are more vertical and stronger fields.
We have examined the behaviour of the tension force in all the active regions listed in Table 1. Similar behaviour is found in all the sunspots. The active regions at most of the places (mainly in the umbra and in the inner penumbra) show force-free behaviour. This serves as sufficient condition for the validity of force-freeness of the sunspot magnetic fields. Thus the approximation of sunspot fields as force-free magnetic fields for several purposes, should give reliable results.
The mean and standard errors of are given in the Tables 1 and 2. The standard error is computed as:
| (17) |
where is the standard deviation of vertical tension force distribution and n is the total number of pixels used in the computation. We can note that the average of Tz is always negative. This is in agreement with the magnetic flux rope models for sunspots (see, e.g. Chitre, 1963; Meyer et al., 1977) which mainly dealt with the problem of global equilibrium of sunspots.
4.2 Non-linear behaviour of the force-free fields
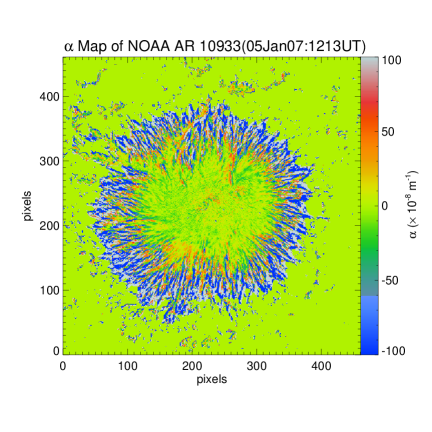
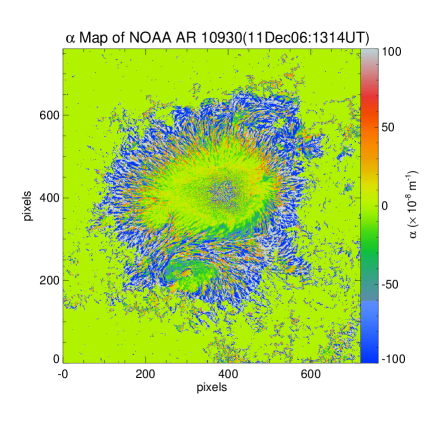
Once known that the sunspot magnetic fields are nearly force-free, we proceed to check whether the linear or non-linear force-free field approximation will be closer to validity. For this purpose, we examined the distribution of the force-free parameter over all the active regions that are listed in Table 1. Two examples of distribution over active regions are shown in the left panels of Figure 3. The NOAA AR 10933 is a flare quiet and 10930 is a flare productive sunspot. Right panels show the corresponding histograms of local distribution over these active regions. We find, unsurprisingly, that the sunspots with very complex structures such as NOAA AR 10930 show non-linear force-free field behaviour. Surprisingly, in the similar way, simple and quiet sunspots like NOAA AR 10933 also show non-linear force-free field behaviour. However the standard deviations are smaller in such simple active regions as compared to the complex active regions. This can be noticed, as an example, from the histograms in upper and lower right panels of Figure 3. We can observe that the range of standard deviations in both the cases are different, however, the distributions show similar pattern. This leads us to believe on the validity of non-linear force-free field approximation for both the simple and the complex sunspots.
There are several methods proposed for computation of global alpha values (see, e.g. Pevtsov et al., 1995; Leka & Skumanich, 1999; Hagino & Sakurai, 2004; Tiwari et al., 2009a; Tiwari, 2009, etc.). Most of these methods weigh on magnetic field strength with the aim to predict the flare activity by computing global twist of sunspots (Tiwari et al., 2009a). However in the present analysis, we are merely interested in the nature of linear or non-linear distribution of . Thus we compute locally over an active region and take its simple mean as a global value of for that AR. The mean and standard errors of for all the vector magnetograms are given in both the Tables. The standard error in computation of has been derived from:
| (18) |
where is the standard deviation of distribution and n is the total number of pixels used in the computation. More detailed statistical investigations of distribution of can be found elsewhere (see, e.g. Pevtsov et al., 1994; Leka & Skumanich, 1999; Bleybel et al., 2002; Hagino & Sakurai, 2004, etc.).


4.3 Temporal evolution of sunspot fields
Further, we studied temporal variation of the force-free nature of the sunspot magnetic fields. For this purpose, we have selected 4 sunspots for which total of 60 vector magnetograms are taken from SOT/SP. Table 2 gives details of the active regions analysed for this purpose. The components of the net Lorentz force are plotted in Figure 4. The results show that there are variations in the three components with time but they are always less than unity. Most of the time, the ratios , and are close to 0.1 and less than 0.4. However in a few cases the magnitudes go beyond at certain stages of their temporal evolution. In those cases also the magnitudes of , and are always less than 0.6. Thus, the fields never obtain a magnetic field configuration that is much away from the force-free approximation. The distribution of vertical tension force also shows consistency and doesn’t vary drastically with time.
From Figure 4, we note that , and are mostly close to zero in the cases of NOAA ARs 10930, 10933 and 10961 and never go beyond the value of 0.4. However, it is noticeable that , and goes up to around 0.5 at certain stages during their temporal evolution for NOAA AR 10960. This might be indicative of some relationship between the flare activity and the force-free field nature of sunspots. At this stage, however, we are unable to decide on this with the limited number of the flare-productive sunspots and in want of their time series vector magnetograms.
| NOAA AR | Date: Time(UT) | Position | comment | |||||
|---|---|---|---|---|---|---|---|---|
| Number | of Observation | |||||||
| 10930 | 10 Dec 2006: 0102 | S04E14(t) | 0.078 | -0.003 | -0.069 | complex, rotating | ||
| 10930 | 10 Dec 2006: 2122 | S04E03 | 0.115 | 0.022 | -0.051 | complex, rotating | ||
| 10930 | 11 Dec 2006: 0304 | S04W01 | 0.079 | 0.029 | -0.076 | complex, rotating | ||
| 10930 | 11 Dec 2006: 0809 | S04W04 | 0.059 | 0.033 | -0.089 | complex, rotating | ||
| 10930 | 11 Dec 2006: 1112 | S04W06 | 0.047 | 0.034 | -0.086 | complex, rotating | ||
| 10930 | 11 Dec 2006: 1314 | S05W07 | 0.039 | 0.038 | -0.062 | complex, rotating | ||
| 10930 | 11 Dec 2006: 1718 | S05W08 | 0.016 | 0.044 | -0.077 | complex, rotating | ||
| 10930 | 11 Dec 2006: 2021 | S05W10 | -0.001 | 0.047 | -0.088 | complex, rotating | ||
| 10930 | 11 Dec 2006: 2324 | S05W12 | -0.013 | 0.045 | -0.063 | complex, rotating | ||
| 10930 | 12 Dec 2006: 0304 | S06W14(t) | 0.099 | 0.039 | -0.029 | complex, rotating | ||
| 10930 | 12 Dec 2006: 1011 | S06W18(t) | 0.102 | 0.052 | -0.024 | complex, rotating | ||
| 10930 | 12 Dec 2006: 1516 | S06W21(t) | 0.119 | -0.060 | -0.042 | complex, rotating | ||
| 10930 | 12 Dec 2006: 1718 | S06W22(t) | 0.118 | -0.063 | -0.044 | complex, rotating | ||
| 10930 | 12 Dec 2006: 2021 | S06W24(t) | 0.127 | 0.065 | -0.047 | complex, rotating | ||
| 10930 | 13 Dec 2006: 0405 | S06W29(t) | 0.137 | 0.078 | -0.025 | complex, rotating | ||
| 10930 | 13 Dec 2006: 0708 | S06W31(t) | 0.136 | 0.079 | -0.002 | complex, rotating | ||
| 10930 | 13 Dec 2006: 1314 | S06W34(t) | 0.125 | 0.083 | -0.007 | complex, rotating | ||
| 10930 | 13 Dec 2006: 1617 | S06W35(t) | 0.126 | 0.084 | -0.006 | complex, rotating | ||
| 10933 | 04 Jan 2007: 1112 | S04E19(t) | 0.202 | 0.029 | -0.102 | quiet | ||
| 10933 | 04 Jan 2007: 1819 | S04E15(t) | -0.049 | 0.018 | -0.174 | quiet | ||
| 10933 | 05 Jan 2007: 0001 | S04E11 | 0.125 | 0.017 | -0.146 | quiet | ||
| 10933 | 05 Jan 2007: 0708 | S04E06 | 0.085 | 0.003 | -0.113 | quiet | ||
| 10933 | 05 Jan 2007: 1213 | S04E03 | 0.045 | 0.002 | -0.108 | quiet | ||
| 10933 | 06 Jan 2007: 0001 | S03W03 | -0.032 | -0.017 | -0.134 | quiet | ||
| 10933 | 06 Jan 2007: 0405 | S03W06 | -0.065 | -0.018 | -0.128 | quiet | ||
| 10933 | 06 Jan 2007: 1000 | S03W09 | -0.106 | 0.001 | -0.112 | quiet | ||
| 10933 | 06 Jan 2007: 1213 | S03W10 | -0.133 | 0.002 | -0.095 | quiet | ||
| 10933 | 07 Jan 2007: 0001 | S04W17(t) | 0.135 | -0.005 | -0.158 | quiet | ||
| 10933 | 07 Jan 2007: 1213 | S04W20(t) | 0.103 | -0.003 | -0.131 | quiet | ||
| 10933 | 07 Jan 2007: 1819 | S04W25(t) | 0.151 | -0.018 | -0.072 | quiet | ||
| 10960 | 05 Jun 2007: 0607 | S08E29(t) | 0.079 | 0.065 | -0.144 | complex, active | ||
| 10960 | 05 Jun 2007: 1112 | S08E26(t) | 0.087 | 0.079 | -0.222 | complex, active | ||
| 10960 | 06 Jun 2007: 0203 | S07E19(t) | 0.119 | 0.074 | -0.335 | complex, active | ||
| 10960 | 06 Jun 2007: 0708 | S07E17(t) | 0.126 | 0.076 | -0.375 | complex, active | ||
| 10960 | 06 Jun 2007: 1213 | S07E14(t) | 0.111 | 0.089 | -0.441 | complex, active | ||
| 10960 | 06 Jun 2007: 1920 | S07E10 | 0.192 | 0.086 | -0.464 | complex, active | ||
| 10960 | 06 Jun 2007: 2223 | S07E09 | 0.198 | 0.092 | -0.451 | complex, active | ||
| 10960 | 07 Jun 2007: 0304 | S07E07 | 0.137 | 0.093 | -0.482 | complex, active | ||
| 10960 | 07 Jun 2007: 1920 | S07W03 | 0.008 | 0.109 | -0.535 | complex, active | ||
| 10960 | 08 Jun 2007: 0708 | S07W09 | -0.178 | 0.100 | -0.514 | complex, active | ||
| 10960 | 08 Jun 2007: 0809 | S07W10 | -0.204 | 0.103 | -0.505 | complex, active | ||
| 10960 | 08 Jun 2007: 1314 | S07W12(t) | -0.223 | 0.129 | -0.553 | complex, active | ||
| 10960 | 08 Jun 2007: 1516 | S07W14(t) | 0.225 | 0.085 | -0.559 | complex, active | ||
| 10960 | 08 Jun 2007: 1819 | S07W16(t) | -0.238 | 0.079 | -0.533 | complex, active | ||
| 10960 | 08 Jun 2007: 2021 | S07W17(t) | -0.208 | 0.073 | -0.519 | complex, active | ||
| 10961 | 29 Jun 2007: 0100 | S11E32(t) | -0.053 | 0.147 | -0.092 | quiet | ||
| 10961 | 29 Jun 2007: 0700 | S11E28(t) | -0.057 | 0.147 | -0.126 | quiet | ||
| 10961 | 29 Jun 2007: 1819 | S11E21(t) | -0.026 | 0.144 | -0.176 | quiet | ||
| 10961 | 30 Jun 2007: 0000 | S12E19(t) | -0.032 | 0.137 | -0.182 | quiet | ||
| 10961 | 30 Jun 2007: 0405 | S12E17(t) | -0.044 | 0.149 | -0.217 | quiet | ||
| 10961 | 30 Jun 2007: 0910 | S12E14(t) | -0.025 | 0.157 | -0.249 | quiet | ||
| 10961 | 30 Jun 2007: 1100 | S13E13(t) | -0.002 | 0.167 | -0.307 | quiet | ||
| 10961 | 30 Jun 2007: 2223 | S13E08(t) | -0.010 | 0.128 | -0.174 | quiet | ||
| 10961 | 01 Jul 2007: 0304 | S13E05(t) | 0.024 | 0.172 | -0.271 | quiet | ||
| 10961 | 01 Jul 2007: 0809 | S13E02(t) | -0.047 | 0.183 | -0.257 | quiet | ||
| 10961 | 01 Jul 2007: 1314 | S13W01(t) | -0.054 | 0.186 | -0.269 | quiet | ||
| 10961 | 01 Jul 2007: 2000 | S12W05(t) | 0.075 | 0.180 | -0.279 | quiet | ||
| 10961 | 02 Jul 2007: 0708 | S10W12(t) | 0.125 | 0.169 | -0.298 | quiet | ||
| 10961 | 02 Jul 2007: 1200 | S10W14(t) | 0.169 | 0.163 | -0.278 | quiet | ||
| 10961 | 02 Jul 2007: 1900 | S10W18(t) | 0.160 | 0.088 | -0.190 | quiet | ||
| (t) : transformed |

The vertical lines in the plots of Figure 4 represent the timings of the associated flares. The dashed line represents the timing of X-class flare (only one on 13 Dec 2006), dashed-dotted lines represent timings of the C-class flares and dotted lines represent timings of the B-class flares. As can be noted from the plots that, even if , and depend on the evolutionary stages of the sunspot magnetic fields, we do not find any systematic relationship between the force-freeness of the sunspot fields and the associated flare activity.
The computation of field gradients might be influenced by the optical depth corrugation effects. An estimation however shows that the relative variation in the field strength and thus in the tension force will be 10%, which is much smaller than the observed spatial variation of vertical tension force (Venkatakrishnan & Tiwari, 2010). Acute angle method for azimuthal ambiguity resolution works well whenever transverse magnetic field vector makes an angle of less than 90 degrees with potential transverse field. Most of the active regions studied are simple sunspots with no complex polarity inversion lines except in the NOAA AR 10930. Thus, ambiguity is resolved properly in most of the active regions. We are interested in the magnitude of vertical tension force in the present study and not in the sign of it, thus we can ignore the influence of ambiguity disambiguation at neutral lines whenever present. Another possibility of error is because of the large scanning time of Hinode (SOT/SP). If the evolution of magnetic field is faster than the scan time of SP then this might cause an error in the results. This is unlikely because of larger evolution time of sunspot magnetic fields, unless the sunspot is involved in an ongoing flare. For an example if we consider 60 arcsec size of an active region and Alfvn speed of about 10 km/sec on the photosphere, then the Alfvn travel time across the active region will be of the order of 1 hour which is not smaller than the scan time of SP for such field of view.
5 Discussion and Conclusions
Using high spatial resolution spectro-polarimetric data obtained from SOT/SP aboard the Hinode, we find that the photospheric sunspot magnetic fields can be approximated to the force-free field configurations. The necessary and the sufficient, both conditions dealing with global and local nature of sunspot magnetic fields respectively, indicate that the sunspot magnetic fields are nearly force-free. This result is consistent with the results obtained by Moon et al. (2002). However, Moon et al. (2002) verified the force-free approximation by using only necessary conditions given by inequalities in Equation 10. We have also investigated the spatial distribution of vertical tension force which serves as sufficient condition. After examining the distribution of the magnitude of vertical tension force over all the sunspots listed in Table 1, we conclude that the magnetic fields in sunspot fine structures over most of the sunspot area are nearly force-free. We, further, distinguish between the nature of the umbral and the penumbral magnetic fields. We find that the umbral fields are more force-free than the penumbral fields. We also find that over penumbra, inner penumbra are more force free than the middle and outer penumbra. From the distribution of vertical tension force (), it is found that the stronger and more vertical fields (spines) exhibit higher magnitudes of (cf. Figure 2 of Venkatakrishnan & Tiwari (2010)). Thus, we can also conclude that the spines are more force-free in the penumbra.
Firstly, a study with similar purpose was performed by Metcalf et al. (1995) using observations of the Stokes parameters at six wavelengths within the spectral lines of Na I 5858 Å using derivative method. They inspected the nature of Lorentz forces by using the necessary conditions. Their results that the magnetic field is not force-free in the photosphere and becomes force-free above certain heights in the lower chromosphere has been subjected to an underestimation of transverse field due to their weak-field approximation (Moon et al., 2002).
The calculations of vertical current density and alpha parameter over sunspots observed from SOT/SP has been performed recently by Su et al. (2009); Tiwari et al. (2009b); Tiwari (2009). The distribution of is found to be non-uniform over sunspots. After verifying that the sunspot fields are almost force-free, we have examined the range of the distribution of alpha over several sunspots, including simple and complex active regions, to inspect the imminence of linear or non-linear force-free field approximation. Our results show that the non-linear force-free field approximation is applicable not only in complex active regions such as NOAA AR 10930 but also in the simple active regions such as NOAA AR 10933 (see Figure 3). This result is not in accordance with that of Moon et al. (2002). The reason could be the difference in the quality of data used. The resolution of data used by Moon et al. (2002) might have not been sufficient to obtain the non-linear behaviour of alpha over sunspots they studied. Thus, the investigations using high resolution data lead us to believe that the sunspot magnetic fields are nearly force-free in nature and they imitate non-linear force-free behaviour.
A study of temporal evolution of Lorentz force components in 60 vector magnetograms of four active regions (see Table 2 and Figure 4) shows variations in the Lorentz force components normalized by Fp i.e., , and . They are always lesser than unity, mostly closer to 0.1 and never show higher values greater than 0.6, thus remaining under the validity of the force-free field approximation. These sunspots, in every phase of their evolution, show immediacy with the force-free approximation of their magnetic fields. From Figure 4, we further tried to find any relationship between the temporal evolution of the force-free field nature of sunspots and the associated flare-activity. Although , and depend on the evolutionary stages of active regions, they don’t show a systematic relationship with the occurrence of flares associated with those active regions.
We depend on the extrapolations of photospheric magnetic fields to obtain the coronal vector magnetic fields owing to inadequacy of coronal field measurements. As it is well known and also discussed in the introduction, that all the extrapolation techniques have to rely on the photospheric vector field measurements and also on the force-free approximation of these magnetic fields. The effect of several possible inaccuracies in the vector field measurement on the non-linear force-free field modelings has recently been studied by De Rosa et al. (2009); Wiegelmann et al. (2010). Coronal magnetic field reconstruction by extrapolations of photospheric magnetic fields under non-linear modelings have shown satisfactory results by nearly matching with the coronal observations (McClymont & Mikic, 1994; Bleybel et al., 2002; Wiegelmann et al., 2005; Schrijver et al., 2006; Metcalf et al., 2008). These results then also support our conclusion that the sunspot magnetic fields are close to satisfy the non-linear force-free field approximation.
A preprocessing procedure has been developed by Wiegelmann et al. (2006) to make the observed data completely force-free as a suitable boundary conditions for force-free extrapolations. This has led more reliable better extrapolations of the fields. The method used by Wiegelmann et al. (2006) however uses only necessary condition to make the fields force-free. Also, most of the time observed field of view suffers from the flux imbalance leading to an inaccuracy in the preprocessing. The preprocessing might be improved by using the sufficient condition (as described in Section 2.2) in preparing the boundary data for the force-free field extrapolations.
There is, however, good enough scope of improvement of the present study. At present our investigation is limited to computation of vertical component of the magnetic tension force. Whereas in a recent study by Puschmann et al. (2010), it has been found that the horizontal component of Lorentz force is greater than the vertical component. Detailed analysis of full sunspot magnetic fields within certain optical heights are required to understand full scenario of force-free nature of the sunspot magnetic fields. In a forthcoming work, we plan to look into all the three components of the equilibrium forces in the height dependent inversions of a complete sunspot.
I thank the referee for very constructive comments which improved the manuscript significantly. I am indebted to Professors P. Venkatakrishnan and B. C. Low for their valuable suggestions and comments for improvement of the manuscript, and Professor E. N. Parker for reading an early version of the manuscript. I thank Professor S. K. Solanki for useful discussions on magnetic and thermal energies. I would also like to thank to all the members of Solar Lower Atmosphere and Magnetism (SLAM) group at MPS for their useful comments during a SLAM group meeting. Some of the Hinode SOT/SP Inversions were conducted at NCAR under the framework of the Community Spectro-polarimetric Analysis Center (CSAC; http://www.csac.hao.ucar.edu/). The help provided by Professor Bruce Lites in handling CSAC data is sincerely acknowledged. Hinode is a Japanese mission developed and launched by ISAS/JAXA, collaborating with NAOJ as a domestic partner, NASA and STFC (UK) as international partners. Scientific operation of the Hinode mission is conducted by the Hinode science team organized at ISAS/JAXA. This team mainly consists of scientists from institutes in the partner countries. Support for the post-launch operation is provided by JAXA and NAOJ (Japan), STFC (U.K.), NASA (U.S.A.), ESA, and NSC (Norway).
References
- Aly (1984) Aly, J. J. 1984, ApJ, 283, 349
- Amari et al. (1997) Amari, T., Aly, J. J., Luciani, J. F., Boulmezaoud, T. Z., & Mikic, Z. 1997, Sol. Phys., 174, 129
- Amari et al. (2006) Amari, T., Boulmezaoud, T. Z., & Aly, J. J. 2006, A&A, 446, 691
- Amari et al. (1999) Amari, T., Boulmezaoud, T. Z., & Mikic, Z. 1999, A&A, 350, 1051
- Bleybel et al. (2002) Bleybel, A., Amari, T., van Driel-Gesztelyi, L., & Leka, K. D. 2002, A&A, 395, 685
- Borrero et al. (2008) Borrero, J. M., Lites, B. W., & Solanki, S. K. 2008, A&A, 481, L13
- Chandrasekhar (1956a) Chandrasekhar, S. 1956a, ApJ, 124, 232
- Chandrasekhar (1956b) Chandrasekhar, S. 1956b, Proceedings of the National Academy of Science, 42, 1
- Chandrasekhar (1961) Chandrasekhar, S. 1961, Chapter-2 : Hydrodynamic and hydromagnetic stability (International Series of Monographs on Physics, Oxford: Clarendon, 1961)
- Chandrasekhar & Kendall (1957) Chandrasekhar, S., & Kendall, P. C. 1957, ApJ, 126, 457
- Chitre (1963) Chitre, S. M. 1963, MNRAS, 126, 431
- Cuperman et al. (1992) Cuperman, S., Li, J., & Semel, M. 1992, A&A, 265, 296
- De Rosa et al. (2009) De Rosa, M. L., Schrijver, C. J., Barnes, G., et al. 2009, ApJ, 696, 1780
- Gary (1989) Gary, G. A. 1989, ApJS, 69, 323
- Gary (2001) Gary, G. A. 2001, Sol. Phys., 203, 71
- Georgoulis & LaBonte (2004) Georgoulis, M. K., & LaBonte, B. J. 2004, ApJ, 615, 1029
- Gosain et al. (2010) Gosain, S., Tiwari, S. K., & Venkatakrishnan, P. 2010, ApJ, 720, 1281
- Gosain et al. (2009) Gosain, S., Venkatakrishnan, P., & Tiwari, S. K. 2009, ApJ, 706, L240
- Hagino & Sakurai (2004) Hagino, M., & Sakurai, T. 2004, PASJ, 56, 831
- Harvey (1969) Harvey, J. W. 1969, Ph.D. thesis, University of Colorado, Boulder
- Ichimoto et al. (2008) Ichimoto, K., Lites, B., Elmore, D., et al. 2008, Sol. Phys., 249, 233
- Kosugi et al. (2007) Kosugi, T., Matsuzaki, K., Sakao, T., et al. 2007, Sol. Phys., 243, 3
- Landolfi & Landi Degl’Innocenti (1982) Landolfi, M., & Landi Degl’Innocenti, E. 1982, Sol. Phys., 78, 355
- Leka & Skumanich (1999) Leka, K. D., & Skumanich, A. 1999, Sol. Phys., 188, 3
- Low (1973) Low, B. C. 1973, ApJ, 184, 917
- Low (1974) Low, B. C. 1974, ApJ, 193, 243
- Low (1977) Low, B. C. 1977, ApJ, 217, 988
- Low (1978) Low, B. C. 1978, ApJ, 224, 668
- Low (1980) Low, B. C. 1980, ApJ, 239, 377
- Low (1982) Low, B. C. 1982, RvGSP, 20, 145
- Low (1985) Low, B. C. 1985, In NASA. Marshall Space Flight Center Meas. of Solar Vector Magnetic Fields, 2374, 49
- Low & Flyer (2007) Low, B. C., & Flyer, N. 2007, ApJ, 668, 557
- Low & Nakagawa (1975) Low, B. C., & Nakagawa, Y. 1975, in BAAS, Vol. 7, 347
- Lüst & Schlüter (1954) Lüst, R., & Schlüter, A. 1954, ZA, 34, 263
- Mackay & van Ballegooijen (2006a) Mackay, D. H., & van Ballegooijen, A. A. 2006a, ApJ, 641, 577
- Mackay & van Ballegooijen (2006b) Mackay, D. H., & van Ballegooijen, A. A. 2006b, ApJ, 642, 1193
- Mackay & van Ballegooijen (2009) Mackay, D. H., & van Ballegooijen, A. A. 2009, Sol. Phys., 260, 321
- Mathew et al. (2004) Mathew, S. K., Solanki, S. K., Lagg, A., et al. 2004, A&A, 422, 693
- McClymont & Mikic (1994) McClymont, A. N., & Mikic, Z. 1994, ApJ, 422, 899
- Metcalf et al. (2008) Metcalf, T. R., De Rosa, M. L., Schrijver, C. J., et al. 2008, Sol. Phys., 247, 269
- Metcalf et al. (1995) Metcalf, T. R., Jiao, L., McClymont, A. N., Canfield, R. C., & Uitenbroek, H. 1995, ApJ, 439, 474
- Meyer et al. (1977) Meyer, F., Schmidt, H. U., & Weiss, N. O. 1977, MNRAS, 179, 741
- Molodenskii (1969) Molodenskii, M. M. 1969, SovAe, 12, 585
- Molodensky (1974) Molodensky, M. M. 1974, Sol. Phys., 39, 393
- Moon et al. (2002) Moon, Y., Choe, G. S., Yun, H. S., Park, Y. D., & Mickey, D. L. 2002, ApJ, 568, 422
- Nakagawa & Raadu (1972) Nakagawa, Y., & Raadu, M. A. 1972, Sol. Phys., 25, 127
- Parker (1979) Parker, E. N. 1979, Cosmical magnetic fields: Their origin and their activity (Oxford, Clarendon Press; New York, Oxford University Press, 1979)
- Parker (1989) Parker, E. N. 1989, GApFD, 45, 159
- Parker (1990) Parker, E. N. 1990, GApFD, 52, 183
- Pevtsov et al. (1994) Pevtsov, A. A., Canfield, R. C., & Metcalf, T. R. 1994, ApJ, 425, L117
- Pevtsov et al. (1995) Pevtsov, A. A., Canfield, R. C., & Metcalf, T. R. 1995, ApJ, 440, L109
- Puschmann et al. (2010) Puschmann, K. G., Ruiz Cobo, B., & Martínez Pillet, V. 2010, ApJ, 721, L58
- Rachkowsky (1967) Rachkowsky, D. N. 1967, Izv. Krymsk. Astrofiz. Obs., 37, 56
- Régnier & Priest (2007) Régnier, S., & Priest, E. R. 2007, A&A, 468, 701
- Sakurai (1979) Sakurai, T. 1979, PASJ, 31, 209
- Sakurai (1982) Sakurai, T. 1982, Sol. Phys., 76, 301
- Sakurai (1989) Sakurai, T. 1989, SSRv, 51, 11
- Sakurai et al. (1985) Sakurai, T., Makita, M., & Shibasaki, K. 1985, MPA Rep., No. 212, p. 312 - 315
- Schmidt (1964) Schmidt, H. U. 1964, NASA Special Publication, 50, 107
- Schrijver et al. (2008) Schrijver, C. J., De Rosa, M. L., Metcalf, T. R., et al. 2008, ApJ, 675, 1637
- Schrijver et al. (2006) Schrijver, C. J., De Rosa, M. L., Metcalf, T. R., et al. 2006, Sol. Phys., 235, 161
- Semel (1967) Semel, M. 1967, AnAp., 30, 513
- Shimizu et al. (2008) Shimizu, T., Nagata, S., Tsuneta, S., et al. 2008, Sol. Phys., 249, 221
- Skumanich & Lites (1987) Skumanich, A., & Lites, B. W. 1987, ApJ, 322, 473
- Solanki et al. (1993) Solanki, S. K., Walther, U., & Livingston, W. 1993, A&A, 277, 639
- Su et al. (2009) Su, J. T., Sakurai, T., Suematsu, Y., Hagino, M., & Liu, Y. 2009, ApJ, 697, L103
- Suematsu et al. (2008) Suematsu, Y., Tsuneta, S., Ichimoto, K., et al. 2008, Sol. Phys., 249, 197
- Tiwari (2009) Tiwari, S. K. 2009, Ph.D. thesis, Udaipur Solar Observatory/Physical Research Laboratory, Mohanlal Sukhadia University, Udaipur
- Tiwari (2010) Tiwari, S. K. 2010, ArXiv:1009.5164
- Tiwari et al. (2010) Tiwari, S. K., Venkatakrishnan, P., & Gosain, S. 2010, ApJ, 721, 622
- Tiwari et al. (2009a) Tiwari, S. K., Venkatakrishnan, P., Gosain, S., & Joshi, J. 2009a, ApJ, 700, 199
- Tiwari et al. (2009b) Tiwari, S. K., Venkatakrishnan, P., & Sankarasubramanian, K. 2009b, ApJ, 702, L133
- Tsuneta et al. (2008) Tsuneta, S., Ichimoto, K., Katsukawa, Y., et al. 2008, Sol. Phys., 249, 167
- Unno (1956) Unno, W. 1956, PASJ, 8, 108
- van Ballegooijen & Cranmer (2010) van Ballegooijen, A. A., & Cranmer, S. R. 2010, ApJ, 711, 164
- Venkatakrishnan (1990a) Venkatakrishnan, P. 1990a, in IAU Symposium, Vol. 142, Basic Plasma Processes on the Sun, ed. E. R. Priest & V. Krishan, 323
- Venkatakrishnan (1990b) Venkatakrishnan, P. 1990b, Sol. Phys., 128, 371
- Venkatakrishnan & Gary (1989) Venkatakrishnan, P., & Gary, G. A. 1989, Sol. Phys., 120, 235
- Venkatakrishnan et al. (1993) Venkatakrishnan, P., Narayanan, R. S., & Prasad, N. D. N. 1993, Sol. Phys., 144, 315
- Venkatakrishnan & Tiwari (2009) Venkatakrishnan, P., & Tiwari, S. K. 2009, ApJ, 706, L114
- Venkatakrishnan & Tiwari (2010) Venkatakrishnan, P., & Tiwari, S. K. 2010, A&A, 516, L5
- Wheatland & Régnier (2009) Wheatland, M. S., & Régnier, S. 2009, ApJ, 700, L88
- Wiegelmann (2004) Wiegelmann, T. 2004, Sol. Phys., 219, 87
- Wiegelmann et al. (2006) Wiegelmann, T., Inhester, B., & Sakurai, T. 2006, Sol. Phys., 233, 215
- Wiegelmann et al. (2005) Wiegelmann, T., Lagg, A., Solanki, S. K., Inhester, B., & Woch, J. 2005, A&A, 433, 701
- Wiegelmann et al. (2010) Wiegelmann, T., Yelles Chaouche, L., Solanki, S. K., & Lagg, A. 2010, A&A, 511, A4
- Woltjer (1958) Woltjer, L. 1958, ApJ, 128, 384