Millimeter multiplicity in DR21(OH): outflows, molecular cores and envelopes
Abstract
We present sensitive high angular resolution ( 1) millimeter continuum and line observations from the massive star forming region DR21(OH) located in the Cygnus X molecular cloud. Within the well-known dusty MM1-2 molecular cores, we report the detection of a new cluster of about ten compact continuum millimeter sources with masses between 5 and 24 M⊙, and sizes of a few thousands of astronomical units. These objects are likely to be large dusty envelopes surrounding massive protostars, some of them most probably driving several of the outflows that emanate from this region. Additionally, we report the detection of strong millimeter emission of formaldehyde (H2CO) and methanol (CH3OH) near 218 GHz as well as compact emission from the typical outflow tracers carbon monoxide and silicon monoxide (CO and SiO) toward this massive star-forming region. The H2CO and CH3OH emission is luminous ( 10-4 L⊙), well resolved, and found along the collimated methanol maser outflow first identified at centimeter wavelengths and in the sources SMA6 and SMA7. Our observations suggest that this maser outflow might be energized by a millimeter source called SMA4 located in the MM2 dusty core. The CO and SiO emission traces some other collimated outflows that emanate from MM1-2 cores, and are not related with the low velocity maser outflow.
Subject headings:
stars: formation – ISM: individual(DR21(OH), W75S) – techniques: imaging spectroscopy1. Introduction
DR21(OH) (also known as W75S) is a well-known high-mass star-forming region due to its richness of centimeter and millimeter maser emission from numerous transitions e.g. OH, H2O and CH3OH (Araya et al., 2009; Fish et al., 2005; Kurtz et al., 2004; Kogan & Slysh, 1998; Mangum et al., 1992; Plambeck & Menten, 1990; Fish et al., 2011). DR21(OH) is located at a distance of about 2 – 3 kpc (Odenwald & Schwartz, 1993), and about 3′ (assuming a distance of 2 kpc, this is equivalent to a physical -projected- size of around 2 pc) north of the famous HII region DR 21 in the Cygnus X molecular cloud. In this work, we assume a distance of 2 kpc to DR21(OH). However, the exactly value of the distance is uncertain.
Its total luminosity is estimated to be of about 5 104 L⊙ (Harvey et al., 1977). The region contains two main dusty condensations (MM1 and MM2) that are warm ( 50 K and 30 K; Mangum et al. 1992), and very massive (350 and 570 M⊙; Mangum et al. 1992, 1993). DR21(OH) and its surroundings have been studied in numerous molecular transitions of NH3, CS, 12CO, and C18O (Padin et al., 1989; Mangum et al., 1991, 1992; Richardson et al., 1994; Lai et al., 2003).
Multiple molecular outflows have been reported to emanate from the MM1 and MM2 dusty condensations. A well collimated east-west bipolar flow driven from within the MM2 condensation has been reported and discussed by Plambeck & Menten (1990), Kogan & Slysh (1998), and Kurtz et al. (2004). The LSR radial velocity of that flow is nearly ambient (10 to km s-1). The LSR radial velocity of DR21(OH) is about 3.0 km s-1, this value was found by Araya et al. (2009) using the 44 GHz methanol maser line. The detailed distributions of 36 and 44 GHz methanol maser emission toward that flow have been established by Fish et al. (2011) and Araya et al. (2009), respectively. Additionally, Lai et al. (2003) reported high-velocity 12CO(2-1) outflows with v 25 km s-1 relative to the systemic velocity powered by MM1-2. A CO bipolar outflow expels material to the northwest (blueshifted) and southeast (redshifted) and is originating from MM 2. A second bipolar outflow emanates from MM1-2 with its blueshifted lobe towards the southwest while its redshifted one is to the northeast. Lai et al. (2003) also suggested the possibility of having a single EW bipolar outflow with a conelike morphology, with the CO lobes tracing the limb-brightened region of the outflow and emanating from MM1-2. Richardson et al. (1994) reported high velocity wings in CS(J=5-4) towards DR 21(OH), extending over 80 km s-1, probably produced by a young and compact outflow.
In this paper, we present high angular resolution ( 1′′ or 2000 AU) millimeter and submillimeter continuum and line observations of the region DR21(OH) made with the Submillimeter Array. In Section 2, we discuss the observations undertook in this study. In Section 3, we present and discuss the data, and in Section 4 we give the main conclusions of this study.
2. Observations
The millimeter ( 217 – 230 GHz or 1.4 – 1.3 mm) observations of DR21(OH) were obtained with the Submillimeter Array111The Submillimeter Array (SMA) is a joint project between the Smithsonian Astrophysical Observatory and the Academia Sinica Institute of Astronomy and Astrophysics, and is funded by the Smithsonian Institution and the Academia Sinica. (SMA) in 2006 May 23 and 2007 August 26. The SMA at those epochs time was in its extended configuration, which included 28 independent baselines ranging in projected length from 18 to 162 k. The phase reference center was = 20h39m00.0s, = 42∘22′48.0′′. The central frequency of the Lower Sideband (LSB) was 217.1049 GHz, while the Upper Sideband (USB) central frequency was 227.1049 GHz for the night in May 2006. The frequency was centered for the night of 2007 August at 230.570 GHz in the LSB, while the USB was centered at 220.570 GHz.
The full bandwidth of the SMA correlator was 4 GHz (2 GHz in each band). For the night in May 2006, the SMA digital correlator was configured in 24 spectral windows (“chunks”) of 104 MHz each, with 128 channels distributed over each spectral window, providing a resolution of 0.813 MHz ( 1 km s-1) per channel. For the night of 2007 August 256 channels distributed over each spectral window were used, providing a resolution of 0.41 MHz ( 0.5 km s-1) per channel. In both observation the linear polarization receivers were used. The primary beam at 230 GHz has a FWHM diameter of about 50′′. The greatest angular size source that can be imaged on these observations is approximately 15′′. The astrometric errors of these observations are less than 1′′.
The zenith opacity (), measured with the NRAO tipping radiometer located at the Caltech Submillimeter Observatory, was between 0.09 and 0.25, indicating good weather conditions during the observations. Observations of Callisto and Uranus provided the absolute scale for the flux density calibration. In the night of 2007 August, we observed Uranus, while for the night of May 2006 Callisto was used.
The gain calibrators were the quasars 2015+371 and BL Lac (with flux densities of 1.5 and 2.5 Jy, respectively). The uncertainty in the flux scale is estimated to be 15 – 20, based on the SMA monitoring of quasars. For the May 2006 observations, we integrated on-source for a total of approximately 2 hr and for the night of 2007 August about of 3 hrs. Further technical descriptions of the SMA and its calibration schemes can be found in Ho et al. (2004).
The data were calibrated using the IDL superset MIR, originally developed for the Owens Valley Radio Observatory (Scoville et al., 1993) and adapted for the SMA.222The MIR-IDL cookbook by C. Qi can be found at http://cfa-www.harvard.edu/cqi/mircook.html The calibrated data were imaged and analyzed in the standard manner using the MIRIAD and AIPS packages.
To obtain the continuum map, we only use the data from the night of May 2006 due to the phase stability was slightly better. The resulting image rms noise of line and continuum images were around 20 mJy beam-1 for each velocity channel and 5 mJy beam-1 for a 2 GHz total bandwidth, respectively, at an angular resolution of with a P.A. = . The resulting continuum map was self-calibrated in phase. We use the LSB of the 2006 run to reconstruct the line-free continuum image since the USB is more affected by line emission from different molecular species.
| Positiona | |||||
| Source | (J2000) | (J2000) | Flux Density | Deconvolved Angular Sizeb | Mass |
| 20 39 | 42 22 | [mJy] | [M⊙] | ||
| SMA 1 | 00.400 | 46.60 | 12224 | 8 | |
| SMA 2 | 00.406 | 46.78 | 18520 | 12 | |
| SMA 3 | 00.453 | 44.86 | 809 | 6 | |
| SMA 4 | 00.598 | 44.94 | 499 | 5 | |
| SMA 5 | 01.010 | 48.72 | 448 | 5 | |
| SMA 6 | 01.002 | 48.93 | 34612 | 23 | |
| SMA 7 | 01.079 | 49.06 | 35713 | 24 | |
| SMA 8 | 01.192 | 51.26 | 20113 | 14 | |
| SMA 9 | 01.231 | 51.43 | 21714 | 14 | |
3. Results and discussion
3.1. Continuum emission
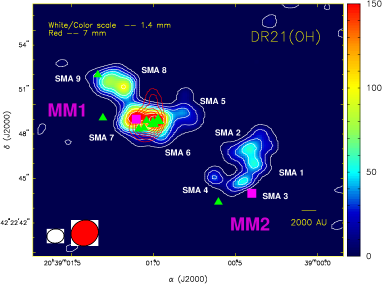
In Figure 1, we show a color and contour map of the 1.4 mm continuum emission detected by the SMA and the VLA towards DR21(OH). We resolved the strong 2.7 millimeter sources MM1 and MM2 reported by Mangum et al. (1991, 1992) into a cluster of nine compact sources. Here, the term “compact sources” is with respect to the size of the extended sources reported by Mangum et al. (1991, 1992). Five of these sources are associated with MM1 (SMA5-9) and four with MM2 (SMA1-4). We give their positions and total flux densities in Table 1. Additionally, in Figure 1, we have overlaid a 7 mm contour continuum map obtained from Zapata et al. (2009) and the positions of the centimeter compact sources reported by Araya et al. (2009). The 7 mm continuum emission peaks at the position of the centimeter sources (NW+SE+R2+R3+R4) reported by Araya et al. (2009) and is not coincident with any SMA 1.4 mm continuum sources. Only SMA6 has a clear counterpart at centimeter wavelengths (MM1-NW and MM1-SE). The 1.4 mm sources are well resolved at these wavelengths and show sizes of a few thousands of Astronomical Units at an assumed distance of 2 kpc.
Assuming a very steep spectral index of =3.5 (Sν ) for all the millimeter sources, which is consistent with optically thin dust emission from dusty envelopes or disks, we can estimate the masses of the 1.4 mm sources. These steep spectral indices have been observed in many star forming regions and are associated with very young stellar objects (see for example Hunter et al., 2006; Rodríguez et al., 2007; Galván-Madrid et al., 2010).
Following Beckwith et al. (1990), we adopt a value for the dust mass opacity of = 0.1 (/1000 GHz)β cm2 g-1, where is the frequency and here = -2 = 1.5. Thus, at this wavelength, we obtain = 0.01 cm2 g-1. Assuming optically thin, isothermal dust emission and a gas-to-dust ratio of 100, the total mass of the 1.4 mm sources is given by
where Sν is the flux density, T is the dust temperature and D is the distance to the source. Assuming a temperature of T = 20 K for all the millimeter sources, we derive masses on the range of 5 – 24 solar masses for the sources (see Table 1). The gas-to-dust ratio of 100 might not be the most adequate to use for protostellar sources since dust settling to the midplane of the disk and erosion of the circumstellar envelope by photodissociation may decrease the gas-to-dust ratio (Throop & Bally, 2005). The sources SMA6 and SMA7 seem to show hot core activity and their temperatures could be higher, so the estimation of the mass for these sources might be overestimated. For the rest of the sources a temperature of 20 K seems to be more adequate because they do not show hot core activity.
Since SMA6 is associated with free-free emission (Araya et al., 2009), the emission at 1.4 mm may be is contaminated with this type of emission. However, this contamination seems to be almost negligible at these wavelengths due to the relatively flat spectral index ( = 0.6) obtained at centimeter wavelengths for this source (Araya et al., 2009).
The values of the masses obtained here (Table 1) have uncertainties of at least 2 or larger due to the error in the determination of the distance to DR21(OH), the estimation of temperatures of the millimeter sources, and the error in the dust mass opacity coefficient at this wavelength.
Similar dust mass values have been recently found for the gas structures associated with the massive protostars in the young clusters W33A and NGC6334N(I) (Galván-Madrid et al., 2010; Hunter et al., 2006).
| Rest frequencya | Elower | Range of Velocities | Linewidthb | LSR Velocityb | Intensity Peak | |
|---|---|---|---|---|---|---|
| Lines | [GHz] | [K] | [km s-1] | [km s-1] | [km s-1] | [mJy Beam-1] |
| H2CO[3(0,3)-2(0,2)] | 218.22219 | 10.4 | 10,10 | 14 | 3 | 80 |
| H2CO[3(2,2)-2(2,1)] | 218.47563 | 57.6 | 10,11 | 13 | 3 | 60 |
| CH3OH[4(2,2)-3(1,2)-E] | 218.44005 | 35.0 | 11,10 | 13 | 3 | 78 |
| SiO(5-4) | 217.10490 | 20.8 | 11,7 | 10 | 3 | 26 |
| 12CO() | 230.53801 | 05.3 | 40,30 | 40 | 5 | 170 |
3.2. Millimeter line emission
Five strong spectral lines were detected in the LSB (2006 May) and in the USB (2007 August) of the observations, corresponding to the H2CO[3(0,3)-2(0,2)], H2CO[3(2,2)-2(2,1)], CH3OH[4(2,2)-3(1,2)-E], SiO(5-4), and 12CO(2-1) transitions (see Table 2).
3.2.1 H2CO and CH3OH
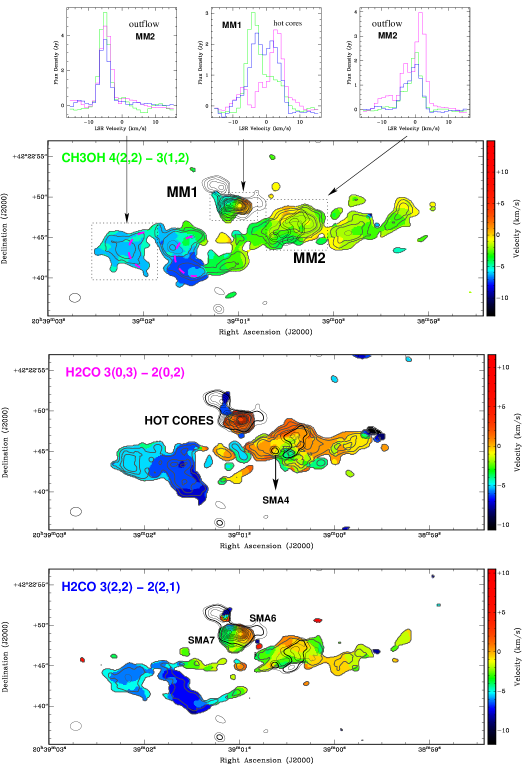
Figure 2 shows maps of the H2CO[3(0,3)-2(0,2)], H2CO[3(2,2)-2(2,1)], and CH3OH[4(2,2)-3(1,2)-E] integrated intensity (moment 0) and intensity-weighted velocity (moment 1), overlaid with the 1.4 mm continuum emission obtained in our SMA observations. These maps reveal strong line millimeter molecular emission arising from the east-west outflow and from the two compact continuum sources SMA6 and SMA7, first reported here (see Section 3.2). The three lines show comparable integrated flux densities. The radial velocities covered by the outflow are from 8 to 5 km s-1, whereas those corresponding to the molecular core sources range from 11 to 11 km s-1.
The emission appears to be concentrated in compact bow-shock structures within the outflow where the line profiles are narrow (a few km s-1) and intense ( 3 - 5 Jy). Overall, the methanol and formaldehyde millimeter emission reported here follow a morphology very similar to that seen in the 44 GHz methanol maser line (Araya et al., 2009). This combination of properties suggest that the formaldehyde and methanol spectral lines reported here might correspond to maser transitions. However, the low brightness temperatures of all lines (TB 280, 200, 70 K for the CH3OH, H2CO[3(2,2)-2(2,1)], and H2CO[3(0,3)-2(0,2)], respectively, and assuming the emission extends over all the beam) suggest thermal emission. These low brightness temperatures, however, are also seen in most of the 44 GHz methanol masers at centimeter wavelengths (Araya et al., 2009). One possibility is that the millimeter line spots detected here are probably much more compact and not resolved with our present angular resolution ( 1′′) resulting thus in true maser emission. More observations are needed to confirm if these millimeter lines are masing. The flux of all three lines integrated over the entire outflow is 80 to 150 Jy km s-1, corresponding to isotropic luminosities of about 10-4 L⊙. This is comparable to the luminosity of other typical maser lines in star-forming regions (Zapata et al., 2009).
This molecular emission, with low radial velocities that suggest motion near the plane of the sky, is reminiscent of water maser emission tracing outflows that are known to be within a few degrees from the plane of the sky (Claussen et al., 1998; Desmurs et al., 2009).
At the center of symmetry of the outflow lies a continuum source (labelled SMA4 on Figure 2, middle panel). The source likely traces the envelope of a high- or intermediate- mass young star (Table 1) and is part of the larger dusty core MM2. The“blue” infrared source proposed by Araya et al. (2009) as a possible candidate for the exciting source of the east-west flow is a bit offset (2′′) from SMA4 and the center of symmetry of the outflow. The symmetry center of the outflow is approximately where the systemic cloud velocity resides, that is, in the middle of the outflow. The blueshifted velocities are found toward the east while the redshifted velocities toward the west. Clearly, more observations will be required to discriminate firmly the true powering source of the outflow, and to examine the relation between SMA4 and the blue infrared source identified by Araya et al. (2009).
In contrast to the narrow spectra found within the outflow, the methanol and formaldehyde line profiles associated with the sources SMA6 and SMA7 are broad ( 15 km s-1) and with the morphology being much more compact. This emission may trace hot molecular core emission associated with these dusty objects. However, a more complete molecular line analysis is required to firmly confirm this hypothesis. Furthermore, both lines (CH3OH and H2CO) show a clear E-W velocity gradient of a few kilometers within the molecular core, probably suggesting that SMA6 and SMA7 are at slightly different systemic velocities or maybe that emission is tracing a molecular compact outflow.
3.2.2 12CO and SiO
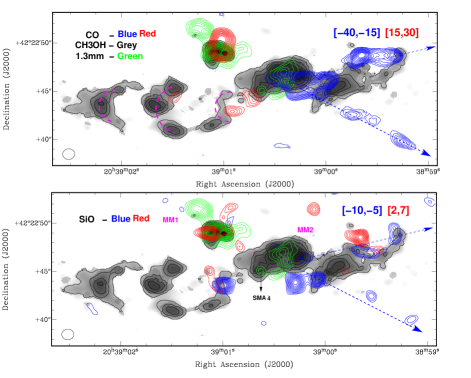
Together with the H2CO and CH3OH observations, we obtained observations of the classical outflow tracers 12CO(2-1) and SiO(5-4) to study in-deep the methanol maser outflow, however, such emission was not detected at all toward the methanol outflow. We instead found some other compact high/low velocity outflows within the region emanating from MM1 or MM2 (see Figure 3). Some of these outflows were already reported with less angular resolution ( 4) by Lai et al. (2003) in 12CO(2-1).
The observations of the 12CO(2-1) revealed two collimated outflows emanating from MM2, one high-velocity bipolar with its redshifted side (30 to 15 km s-1) in the east and with its blueshifted side (65 to 15 km s-1) toward the west, and a second monopolar outflow with its blueshifted emission (40 to 15 km s-1) toward the southwest. None of these outflows are associated with the low-velocity (10 to km s-1) E-W methanol maser bipolar outflow. This might be explained as a result of removing the 12CO emission from velocities close to ambient in order to make the map presented in Figure 3, however, as we will see below, even the SiO, an outflow tracer that is supposedly weak at ambient velocities, is not present at the position of the maser outflow. Furthermore, one would think that the EW carbon monoxide outflow could be the counterpart of EW maser methanol outflow, however, the blueshifted and redshifted sides of both outflows are found in contrary positions, see Figures 2 and 3.
There is one more very compact north-south 12CO(2-1) outflow emanating from the MM1 core with its redshifted side to the north, powered maybe by SMA6 or SMA7. Its blueshifted side is not detected.
Our 12CO(2-1) map does not favor the idea of having a single bipolar east-west outflow with a conelike morphology, with the CO lobes tracing the limb-brightened region of the outflow as suggested by Lai et al. (2003). Our results instead confirm the presence of multiple compact outflows with different orientations emanating within the MM1-2 cores.
The SiO(5-4) on the other hand, shows a more clumpy structure over the whole region. The radial velocities displayed by this molecule are very similar to the ones of the methanol maser bipolar outflow (10 to km s-1), however the SiO emission is not arising from this outflow (see Figure 3). There is instead faint blueshifted emission clearly associated with the east-west and southeast-northwest 12CO(2-1) outflows. Towards the MM1 core, the SiO traces some other different compact outflows than the north-south outflow revealed by the 12CO(2-1) emission. However, their orientations are not clear from the present observations. Some of these molecular outflows could be are powered by the thermal jets (MM1-NW and MM1-SE) reported toward this position by Araya et al. (2009).
4. Summary
We have reported the detection of a new cluster of about ten compact millimeter sources with masses in a range of 5 to 24 M⊙ at the center of DR21(OH). These sources are likely to be large dusty envelopes surrounding high- or intermediate- mass protostars, and some of them most probably drive multiple outflows that emanate from this region.
We also reported for the first time the detection of strong millimeter emission of formaldehyde (H2CO) as well as the methanol (CH3OH) at around 218 GHz towards DR21(OH). The line emission is detected within the east-west flow driven by DR21(OH) and the sources SMA6 and SMA7, and is well coincident with methanol centimeter (36 and 44 GHz) maser emission previously reported.
The SiO and 12CO emission revealed a group of compact outflows emerging from the cluster of young stars present in DR21(OH). We do not find 12CO high velocity emission neither low velocity SiO emission coincident with the methanol maser outflow.
References
- Araya et al. (2009) Araya, E. D., Kurtz, S., Hofner, P., & Linz, H. 2009, ApJ, 698, 1321
- Beckwith et al. (1990) Beckwith, S. V. W., Sargent, A. I., Chini, R. S., & Guesten, R. 1990, AJ, 99, 924
- Cernicharo et al. (1996) Cernicharo, J., Bachiller, R., & Gonzalez-Alfonso, E. 1996, A&A, 305, L5
- Cernicharo et al. (1990) Cernicharo, J., Thum, C., Hein, H., John, D., Garcia, P., & Mattioco, F. 1990, A&A, 231, L15
- Claussen et al. (1998) Claussen, M. J., Marvel, K. B., Wootten, A., & Wilking, B. A. 1998, ApJ, 507, L79
- Cox et al. (1995) Cox, P., Martín-Pintado, J., et al. 1995, A&A, 295, L39
- Desmurs et al. (2009) Desmurs, J.-F., Codella, C., Santiago-García, J., Tafalla, M., & Bachiller, R. 2009, A&A, 498, 753
- Fish et al. (2011) Fish, V. L., et al. 2011, ApJ, 729, 14
- Fish et al. (2005) Fish, V. L., Reid, M. J., Argon, A. L., & Zheng, X.-W. 2005, ApJS, 160, 220
- Galván-Madrid et al. (2010) Galván-Madrid, R., et al. 2010, ApJ, 725, 17
- Harvey et al. (1977) Harvey, P. M., Campbell, M. F., & Hoffmann, W. F. 1977, ApJ, 211, 786
- Ho et al. (2004) Ho, P. T. P., Moran, J. M., & Lo, K. Y. 2004, ApJ, 616, L1
- Humphreys (2007) Humphreys, E. M. L. 2007, IAU Symposium, 242, 471
- Hunter et al. (2006) Hunter, T. R., et al. 2006, ApJ, 649, 888
- Kalenskii et al. (2002) Kalenskii, S. V., Slysh, V. I., & Val’tts, I. E. 2002, Astronomy Reports, 46, 96
- Kogan & Slysh (1998) Kogan, L., & Slysh, V. 1998, ApJ, 497, 800
- Kurtz et al. (2004) Kurtz, S., Hofner, P., & Álvarez, C. V. 2004, ApJS, 155, 149
- Lai et al. (2003) Lai, S.-P., Girart, J. M., & Crutcher, R. M. 2003, ApJ, 598, 392
- Mangum et al. (1992) Mangum, J. G., Wootten, A., & Mundy, L. G. 1992, ApJ, 388, 467
- Mangum et al. (1991) Mangum, J. G., Wootten, A., & Mundy, L. G. 1991, ApJ, 378, 576
- Martín-Pintado et al. (1989) Martin-Pintado, J., Bachiller, R., Thum, C., & Walmsley, M. 1989, A&A, 215, L13
- Melnick et al. (1993) Melnick, G. J., Menten, K. M., Phillips, T. G., & Hunter, T. 1993, ApJ, 416, L37
- Menten et al. (1990a) Menten, K. M., Melnick, G. J., Phillips, T. G., & Neufeld, D. A. 1990a, ApJ, 363, L27
- Menten et al. (1990b) Menten, K. M., Melnick, G. J., & Phillips, T. G. 1990b, ApJ, 350, L41
- Odenwald & Schwartz (1993) Odenwald, S. F., & Schwartz, P. R. 1993, ApJ, 405, 706
- Padin et al. (1989) Padin, S., et al. 1989, ApJ, 337, L45
- Patel et al. (2007) Patel, N. A., et al. 2007, ApJ, 658, L55
- Plambeck & Menten (1990) Plambeck, R. L., & Menten, K. M. 1990, ApJ, 364, 555
- Richardson et al. (1994) Richardson, K. J., Sandell, G., Cunningham, C. T., & Davies, S. R. 1994, A&A, 286, 555
- Rodríguez et al. (2007) Rodríguez, L. F., Zapata, L. A., & Ho, P. T. P. 2007, ApJ, 654, L143
- Scoville et al. (1993) Scoville, N. Z., et al. 1993, PASP, 105, 1482
- Thum et al. (1994a) Thum, C., et al. 1994a, A&A, 283, 582
- Thum et al. (1994b) Thum, C., et al. 1994b, A&A, 288, L25
- Throop & Bally (2005) Throop, H. B., & Bally, J. 2005, ApJ, 623, L149
- Waters et al. (1980) Waters, J. W., et al. 1980, ApJ, 235, 57
- Zapata et al. (2009) Zapata, L. A., Menten, K., Reid, M., & Beuther, H. 2009, ApJ, 691, 332