1 \sameaddress1 \sameaddress1 \sameaddress1 \sameaddress1 \sameaddress1 \sameaddress1 \sameaddress1 \sameaddress1 \sameaddress2
NEWAGE
Abstract
NEWAGE is a direction-sensitive dark matter search experiment with a gaseous time-projection chamber. We improved the direction-sensitive dark matter limits by our underground measurement. In this paper, R&D activities sinse the first underground measurement are described.
1 Introduction
Direction-sensitive dark mater search with gaseous detector was proposed in late 1980s[G. Masek et al., 1989, G. Gerbier et al., 1990]. Since then several experimental and theoretical works on the possibility of detecting this distinct signal of dark matter have been performed[Ahlen et al., 2010] and the references therin. Among these proposed methods, The DRIFT group has pioneered studies of gaseous detectors for WIMP-wind detection for more than ten years with multi-wire proportional chambers [Burgos et al., 2009].
We started a new project, NEw generation WIMP-search with Advanced Gaseous tracking device Experiment (NEWAGE) in 2003[Tanimori et al., 2004]. We adopted a new technology named Micro-Patterned Gaseous Detector (MPGD) and thus had advantages in the pitch of the detection sensors and a three-dimensional tracking scheme. We performed first direction-sensitive dark matter search experiment in a surface laboratory [Miuchi et al., 2007] and updated the direction-sensitive limits by the measurement in an underground laboratory[Miuchi et al., 2010]. Although we set a WIMP-proton cross section of 5400 pb for 150 GeV WIMPs by a direction-sensitive methods, we need to improve more than three orders of magnitude to set a competitive limits to other direction-insensitive searches. We plan to improve the sensitivity by reducing the internal radioactive background, lowering the energy threshold, discriminating head-tails of nuclear tracks, building large-volume detectors, and developing the pixel readout. In this paper, we report these efforts after our first underground run.
2 NEWAGE detectors
We have three time projection chambers (TPCs) and two Radon Detectors. We list the specifications of our TPCs in Table 1. We have one large TPC in the underground laboratory for dark matter run and background studies. We have one large and one small TPC in the surface laboratory for mainly large volume R&D and advanced tests, respectively. We use -PIC[Ochi et al., 2001, Takada et al., 2007], one of the micro patterned gaseous detector, as a main-multiplier and a readout of the TPC. The pitch of the -PIC is 400 m. We also use gas an electron multiplier (GEM)[Sauli and Sharma, 1999] as a sub-multiplier. For details on our TPC system, please refer to our previous publication[Miuchi et al., 2010] and the references therein. We developed two electrostatic collection radon detectors similar to the system developed by the Super-Kamiokande group[Y. Takeuchi and others, 1999]. Our detectors are smaller in size ( and ) We operate the radon detector with the at 152 Torr to measure the radon emanation into the TPC gas.
| name | -PIC | drift | location | use |
|---|---|---|---|---|
| NEWAGE-0.1a | 10cm | surface | advanced test | |
| NEWAGE-0.3a | 30cm | underground | DM run, BG study | |
| NEWAGE-0.3b | 50cm | surface | large volume |
3 Underground R&D
One of the major background in our detector is radons coming from uranium and thorium contaminations in the detector materials. We attached a mini-chamber containing about 100 gram of charcoal (TSURUMICOAL 2GS) as radon filter and circulated the TPC gas with a Teflon bellows pump (TSURUMICOAL 2GS). With this radon elimination system, radon rate was decreased to less than 1/10.
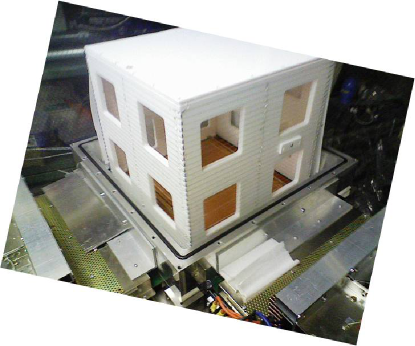
We measured the radon emanation from main components of our detector with our radon detectors. As the absolute detection efficiency of the radon-daughter ion was not measured yet, we relatively compared the contribution of each components. Measured results normalized to the NEWAGE-0.3a detector is shown in Figure 2. We found the glass-reignforced fluoroplastic (TPC cage) had the largest radon emanation. We decided to replace it with PTFE. The picture of our new TPC cage is shown in Fig. fig:PTFE-TPC. The radon background is now expect to be less than 1/3. With these major and minor improvements, we started a dark matter run on August 3rd, 2011.
| material | radon rate per NEWAGE-0.3a (a.u.) |
|---|---|
| glass-reignforced fluoroplastic (TPC cage) | 1 |
| PTFE (TPC cage) | 0.1 |
| glass-reignforced plastic (GEM frame) | 0.7 |
| polyimide+copper (GEM) | 0.1 |
| resistors (TPC) | 0.8 |
| -PIC |
4 Surface R &D (head-tail recognition)
Head-tail recognition of the nuclear track is important to improve the sensitivity of a direction-sensitive dark matter search experiment[Green and Morgan, 2007]. DM-TPC group has shown the possibility of head-tail recognition of high energy nuclear tracks[D. Dujmic et al., 2008] followed by the DRIFT group’s work in the energy range relevant to the dark matter search for one dimension[S. Burgos and others, 2009].
We updated the FPGA firmware of our DAQ system in order to study the two-dimensional head-tail recognition with the NEWAGE-0.1a detector. We used to take X-Y coincidence in the FPGA at the rise of each hit. We modified the firmware so that we do not require X-Y coincidence but record the rising and falling edges of all of the hit-strips(TPC-mode5). We show a typical nuclear recoil event in Fig. 2. The energy is about 130 keV 111We calibrated the detector with alpha particle of about 1.5 MeV, so we use an alpha-equivalent energy in this paper..
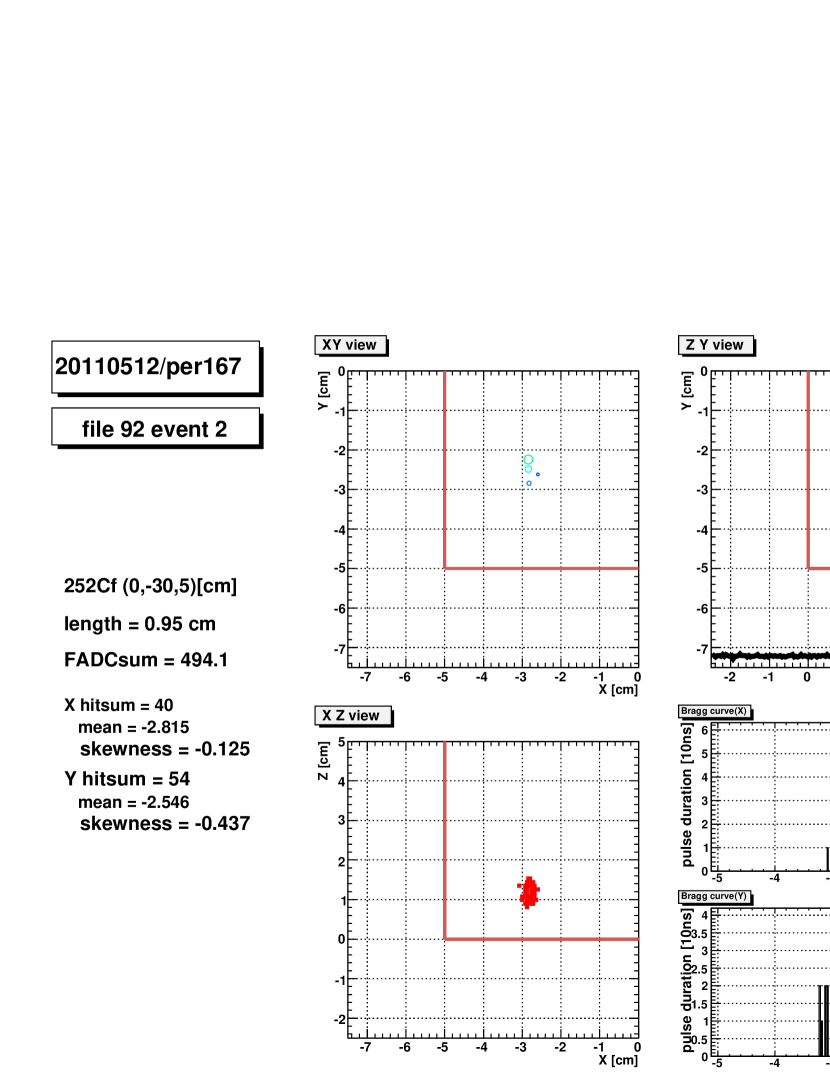
We defined a skewness along axis by equation 1, where is the pulse duration at and is the mean value of with .
| (1) |
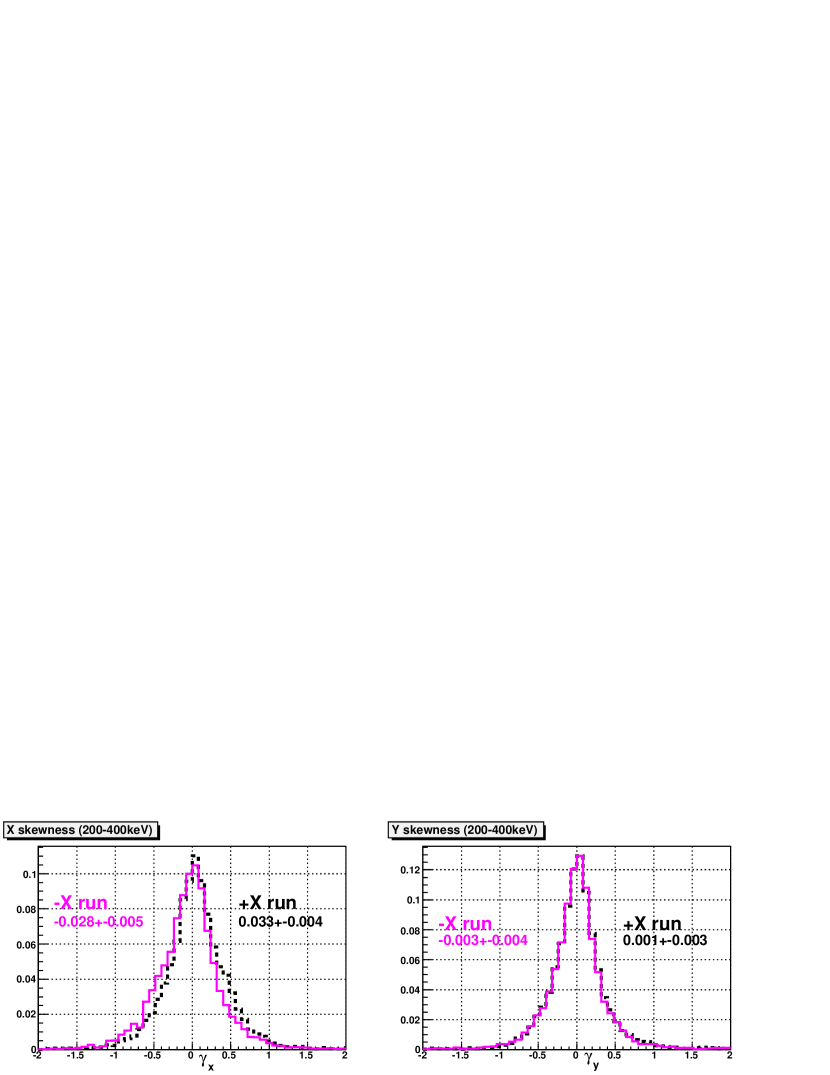
We measured the skewness by placing a neutron source at four positions, (30cm, 0cm,5cm) (+X run), (-30cm, 0cm, 5cm) (-X run), (0cm, 30cm,5cm) (+Y run), and (0cm, -30cm,5cm) (-Y run). (0cm, 0cm, 5cm) is the center of the detection volume and the -PIC readout plane is the X-Y plane. Skewness distributions of +X run and -X run are shown in Fig. 3 We fitted the distributions with a Gaussian function and we indicate the center value and its fitting errors in the figure. The difference between the center values of +X and -X runs are statistically significant, while the center values of +Y run and -Y runs are statistically consistent.
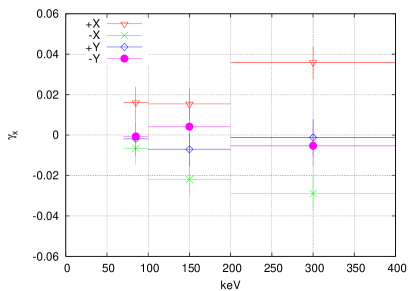
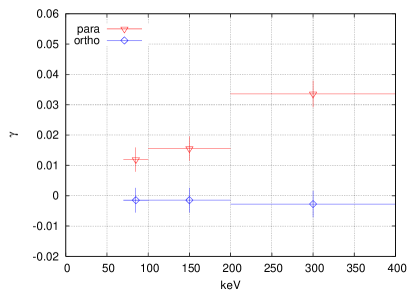
We show the energy dependence of in the left panel Fig. 4. Though the statistics are not enough, positive (negative) skewness were observed in the +X (-X) runs. We then combined these results into parallel( in X runs and in Y ) data and orthogonal( in X runs and in Y ) data. In the parallel runs, absolute values of the skewness are used.. The result is shown in the right panel of Fig. 4. In the parallel runs, statically significant with 3.0, 3.9, and 7.7 are observed for the energy range of 70-100keV, 100-200keV, and 200-400keV, respectively. The were consistent with zero in the orthogonal runs.
Although the skewness definition is not optimized, these results shows that we can recognize head-tail with a sufficient statistics down to 70 keV. These results also indicate much more efforts required for event-by-event recognition.
5 R&D for pixel-readout TPC
TPCs for direction-sensitive dark matter search experiments need to detect short () tracks with a reasonable () angular resolution. Most of these experiments use strip or MWPC readout,mostly because of the technical limitations. We are confronted with tracking difficulties such as double-hit unfolding problems. And thus none of us has achieved a required tracking performance with existing readout systems. A pixel-readout is an ideal solutions to these tracking difficulties and would bring a breakthrough to this field. Pixel-readout TPCs would realize the detection of the three-dimensional distribution of primary electrons, and thus we can in principle reconstruct the nuclear track without losing any information at the readout stage. With these undeteriorated data, a better angular resolution with a good direction uniformity is expected. A better head-tail recognition is also expected. There are several achievements in the world to develop ASICs (application specified integrated circuits) for pixel readout TPCs. TIMEPIX[Llopart et al., 2007], developed in CERN, is a well known PIXEL-readout ASIC which measures the time-of-flight (TOF) and the time-over-threshold (TOT) with a pitch of 55 m. TOT is a good parameter to estimate collected charge as long as the longitudinal diffusion is small. A dark matter detector needs to be as large as possible for a given detection area, and thus we want to have the drift region as long as possible. Then the longitudinal diffusion cannot be ignored and TOT no longer helps. If we can have an ADC function in each pixel, though this is not very easy, this problem should be solved. We can, furthermore use the ADC-TOT correlation to estimate the absolute z position. Absolute z, even if the resolution is several cm, would greatly help to reduce the radioactive background from the drift plane, the GEM, and the -PIC.
We are developing a CMOS ASIC named QPIX which has ADC in addition to TOF and TOT in each pixel[KHOA, 2010]. This development is in a starting phase and we are making efforts to prove the principle of concept and also evaluate the cost and background of the readout system.
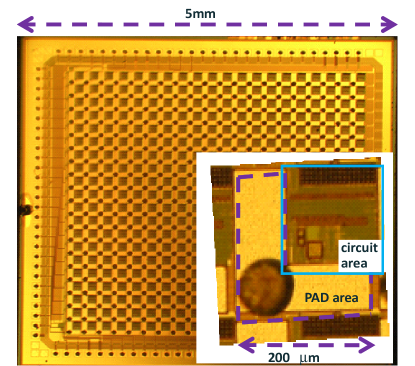
After the R&D with several types of TEGs (test element groups) we developed QPIX-ver1, which is a first version with two-dimensional array. The design values of QPIX-ver1 are shown in Table 3 together with a goal values. QPIX-ver1 has 2020 pixels with a pitch of 200 m. Each pixel has 14-bit TOF, 8-bit TOT, and 10 bit ADC. The chip was made by TSMC 0.18 m process. A microscope photo is shown in Fig. 5. 20 20 pixels are seen. 84 IO pads are placed along three edges of the chip. The inset shows the zoom-up of one pixel. A metal pad area is indicated by dashed line. We can use this pad area for the direct charge collection from the gas volume or for the contact pad of bump bonding. A trace of bump bonding test is seen in the center. The circuit area is 130 130 .
| QPIX-ver1 (design) | QPIX goal | |
|---|---|---|
| dimension | ||
| channels | 20 20ch/chip | |
| TOF | 14 bits | 14bits |
| TOT | 8 bits | 8bits |
| comparator threshold(TOF,TOF) | 10fC | 1fC |
| clock(TOT,TOF) | 100MHz | 100MHz |
| ADC | 1.5pC / 10bits, 10Msps | 100fC / 10bits, 10Msps |
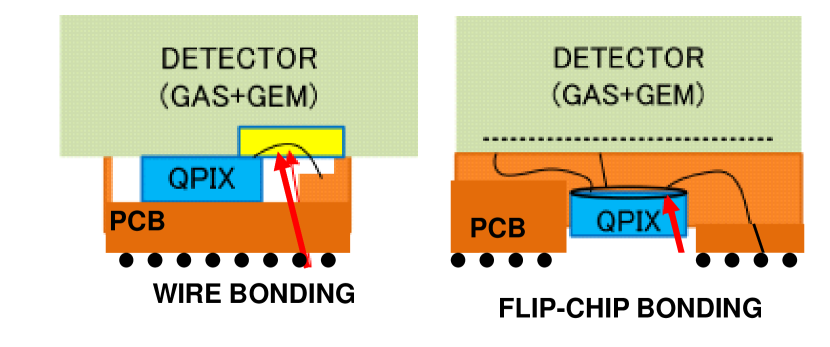
We tried two ways of mountings, namely a wire-bonding mounting and a flip-chip mounting. Both mounting ways are shown in Fig 6. Wire-bonding methods is shown in the left panel. This is a well-studied and very reliable method. We use wire-bondings to connect the IO pads of QPIX-ver1 to the readout PCB. The problem of of the wire-bonding method is dead areas. We have dead areas at least along one edge with wire-bonding mountings.
We tried another method, flip-chip mounting, in order to decrease the dead areas. This method is shown in the right panel of Fig. 6. We mount a charge collection PCB(CCPCB) on QPIX-ver1 by bump bonding. The CCPCB has 20 20 pads on the gas side. These pads are connected to the cavity underneath through the CCPCB. QPIX-ver1 is mounted in this cavity by bump-bonding. IO pad are also connected by bump-bonding and are connected to the mother broad PCB(MBPCB) through CCPCB. The CCPCB is larger than QPIX-ver1 and can be mounted on a MBPCB without dead areas. We mounted four CCPCBs on a MBPCB. A mechanical mounting was confirmed, though electrical connection was not achieved. This was because the surface of the CCPCB cavity was not flat enough for the bump bonding. We are trying to produce a better CCPCB to establish the flip-chip mounting. We measured some performance of QPIX-ver1 mounted with the wire-bondings.
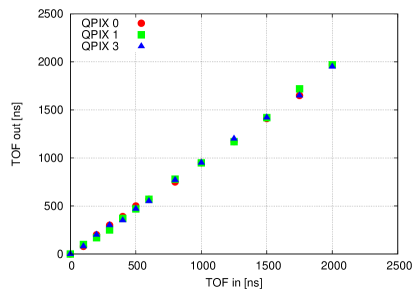
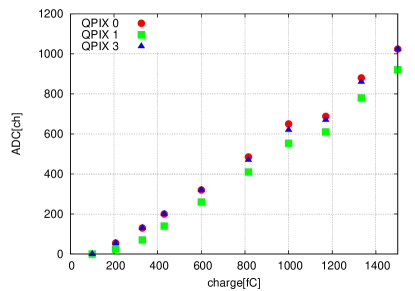
Measured performance of QPIX-ver1 is shown in Fig. 7. Four QPIX chips are mounted. Three chips worked, the rest had some trouble either in the ASIC development process or mounting process. TOF shows good linearity up to 2s. ADC shows fair linearity up to 1.5pC though the threshold was about ten times higher than the designed value. We are designing next TEG to improve the threshold.
6 Conclusions
Intensive studies to improve the sensitivities of NEWAGE dark matter detectors are under way. We replaced the TPC cage with radio-pure PTFE. We expect at least five times less count rate due to the radioactive background from the detector components. We also studied the head-tail recognition in the surface laboratory using two-dimensional track data. Although the skewness definition is not optimized, these results shows that we can recognize head-tail with a sufficient statistics down to 70 keV. These results also indicate much more efforts required for event-by-event recognition. For the future large volume detector, we are developing a pixel ASIC named QPIX. We made a first version of arrayed pixels and tried two ways of mountings methods. We started a new dark matter run in August 2010 expecting a better limits.
Acknowledgments
This work was partially supported by KAKENHI (19684005, 23684014, 21340063, and 23654084).
References
- Ahlen et al., 2010 Ahlen, S. et al.: 2010, Int. J. Mod. Phys. A 25, 1
- Burgos et al., 2009 Burgos, H. et al.: 2009, Nucl. Instrm. Methods Phys. Res. Sect. A 600, 417
- D. Dujmic et al., 2008 D. Dujmic et al.: 2008, Nucl. Instrm. Methods Phys. Res. Sect. A 584, 327
- G. Gerbier et al., 1990 G. Gerbier et al.: 1990, Nuclear Phys. B Proc. Sup. 13, 207
- G. Masek et al., 1989 G. Masek et al.: 1989, Proceedings of the Workshop on Particle Astrophysics p. 43
- Green and Morgan, 2007 Green, A. M. and Morgan, B.: 2007, Astropart. Phys. 27, 142
- KHOA, 2010 KHOA, V. M.: Feburary 2010, Master Thesis Tokyo Institue of Technology
- Llopart et al., 2007 Llopart, X., Ballabriga, R., Campbell, M., Tlustos, L., and Wong, W.: 2007, Nucl. Instrm. Methods Phys. Res. Sect. A 581, 485
- Miuchi et al., 2007 Miuchi, K. et al.: 2007, Phys. Lett. B 654, 58
- Miuchi et al., 2010 Miuchi, K. et al.: 2010, Phys. Lett. B 686, 11
- Ochi et al., 2001 Ochi, A. et al.: 2001, Nucl. Instrm. Methods Phys. Res. Sect. A 471, 264
- S. Burgos and others, 2009 S. Burgos and others: 2009, Astropart. Phys. 261, 266
- Sauli and Sharma, 1999 Sauli, F. and Sharma, A.: 1999, Annu. Rev. Nucl. Part. Sci 49, 341
- Takada et al., 2007 Takada, A. et al.: 2007, Nucl. Instrm. Methods Phys. Res. Sect. A 573, 195
- Tanimori et al., 2004 Tanimori, T. et al.: 2004, Phys. Lett. B 578, 241
- Y. Takeuchi and others, 1999 Y. Takeuchi and others: 1999, Phy. Lett. B 452, 418