Distance and Kinematics of the Red Hypergiant VY CMa: VLBA and VLA Astrometry
Abstract
We report astrometric results of phase-referencing VLBI observations of 43 GHz SiO maser emission toward the red hypergiant VY Canis Majoris (VY CMa) using the Very Long Baseline Array (VLBA). We measured a trigonometric parallax of 0.83 0.08 mas, corresponding to a distance of 1.20 kpc. Compared to previous studies, the spatial distribution of SiO masers has changed dramatically, while its total extent remains similar. The internal motions of the maser spots are up to 1.4 mas yr-1, corresponding to 8 km s-1, and show a tendency for expansion. After modeling the expansion of maser spots, we derived an absolute proper motion for the central star of = and = mas yr-1 eastward and northward, respectively. Based on the maser distribution from the VLBA observations, and the relative position between the radio photosphere and the SiO maser emission at 43 GHz from the complementary Very Large Array (VLA) observations, we estimate the absolute position of VY CMa at mean epoch 2006.53 to be = 07h22m583259 00007, = 25°46′03063 0010. The position and proper motion of VY CMa from the VLBA observations differ significantly with values measured by the Hipparcos satellite. These discrepancies are most likely associated with inhomogeneities and dust scattering the optical light in the circumstellar envelope. The absolute proper motion measured with VLBA suggests that VY CMa may be drifting out of the giant molecular cloud to the east of it.
1 INTRODUCTION
VY Canis Majoris (VY CMa) is one of most massive and luminous red hypergiant stars in our Galaxy. At its “traditional” estimated distance of 1.5 kpc, based on the angular proximity to the cluster NGC 2362 (Lada & Reid, 1978), VY CMa would be near the empirical upper luminosity boundary in the Hertzsprung-Russel (H-R) diagram (Schuster et al., 2006), associated with high mass-loss and ejection phenomena. Because the red hypergiant phase represents a very short-lived evolutionary stage, with a timescale of only years, the physical properties and evolutional state of this object have been investigated extensively from optical and infrared to radio wavelengths.
VY CMa displays OH, H2O and SiO maser emission in its circumstellar envelope (CSE). Very Long Baseline Interferometry (VLBI) observations of SiO masers from oxygen-rich asymptotic giant branch stars (e.g., Mira variables) have shown that the masers are situated only a few radii from the stellar surface, giving us insight into the properties of the inner CSE, which is important for the study of the evolution of late type stars (Boboltz, 2005). Investigations of the distributions of the SiO masers show that the masers typically form ring-like structures (Diamond et al., 1994; Greenhill et al., 1995; Cotton et al., 2004), possibly with a rotational component (Boboltz & Diamond, 2000; Boboltz & Marvel, 2000; Hollis et al., 2001; Sánchez Contreras et al., 2002).
VLBI observations of SiO maser emission from VY CMa in the , and transitions showed them to be approximately spatially coincident, with extents of approximately 80 mas on the sky and the strongest spots concentrated toward the east (Miyoshi et al., 1994, 2003). VLBI maps of the , maser emission extend over about 100 80 mas in right ascension and declination, respectively, estimated at about 24 stellar radii (Shibata et al., 2004).
Knowledge of distance is very important to determine the physical properties of a star. Inferred stellar radii depend directly on distance and luminosities scale as the square of distance; moreover, distances indirectly affect modeled stellar properties, such as effective temperature and surface gravity. Recently, Choi et al. (2008a) measured a trigonometric parallax for VY CMa of mas, corresponding to a distance of kpc, based on observations of H2O masers with the Japanese VLBI Exploration of Radio Astrometry (VERA) array. At this distance, VY CMa more comfortably falls below the theoretical maximum luminosity on the HR diagram. Our parallax measurements presented here are made with a different telescope, the Very Long Baseline Array (VLBA), observing a different maser species (SiO) and thus give an independent measurement of the distance and proper motion of VY CMa.
While stellar positions for red giant stars have been measured with the Hipparcos satellite, these are generally far less accurate than for dwarf stars, since red giant stars are large, variable, often surrounded by copious dust and far away. Another way to locate a red giant star is to observe circumstellar masers with radio interferometry (Baudry et al., 1984). Because masers usually surround the red giant star, the radio position of the central star can be estimated from the observed distribution and kinematics of the SiO masers, which can be linked to the positions of extragalactic quasars by VLBI phase-referencing (Colomer, 1993). More directly, however, radio continuum emission from the stellar photosphere can be imaged by, for example, the Very Large Array (VLA) using H2O or SiO masers as a phase-reference (Reid & Menten, 1990, 1997, 2007), which provides a direct and accurate measurement of the maser distribution relative to the star.
In this paper, we present the results from our multi-epoch radio interferometer observations of the SiO maser emission and radio continuum toward VY CMa. In §2, we describe the VLBA phase-referencing observations of SiO masers and the VLA observations of weak radio photospheric continuum and maser emission at 43 GHz made on the day after the second epoch of our VLBA observations. In §3, we compare the spatial distribution of SiO masers at different epochs and estimate their internal motions. In §4, we use the time variation of the positions of maser spots relative to a background source to determine a trigonometric parallax and absolute proper motion. In §5, we describe the procedures to determine the absolute position of the central star based on the quasi-ring-like structure of maser distributions from the VLBA observations and the VLA observations of radio photospheric emission using strong maser emission as phase-reference. In §6, after modeling the kinematics of masers, we derive an absolute proper motion of the star. In §7, we compare the positions and proper motions with values measured by the Hipparcos satellite and VERA, and discuss the reasons for the difference and the origin of VY CMa.
2 OBSERVATIONS
2.1 VLBA Observations
Our VLBI observations were conducted with the VLBA operated by the National Radio Astronomy Observatory (NRAO)111The National Radio Astronomy Observatory is a facility of the National Science Foundation operated under cooperative agreement by Associated Universities, Inc. under program BR106. We observed the , SiO maser transition at a rest frequency of 43.12208 GHz toward VY CMa with 8-hour tracks on 2005 October 20, 2006 April 16 and September 29, and 2007 April 14. This time sampling provides nearly maximum sensitivity for parallax detection and ensures that we can separate the secular proper motion from the sinusoidal parallax effect. We scheduled the observations so as to maximize the right ascension (and not declination) parallax offsets for two reasons. First, for VY CMa the amplitude of the parallax signature in right ascension is greater than in declination. Second, since VY CMa is observed at low elevation angles, the uncertainty of declination measurements would be expected to be considerably larger than for right ascension (Honma et al., 2008).
We observed several extragalactic radio sources as potential background references for parallax solutions. The observing sequence was VY CMa, J07312341, VY CMa, J07202628, VY CMa, J07242515, VY CMa, J07252640 for the first epoch. From the first epoch observations, we found J07202628 and J07242515 too weak to be detected, and we dropped these sources from the remaining observations. We switched between the maser target and background sources every 40 s, typically achieving 30 s of on-source data. We used an SiO maser spot as the phase-reference source because it is considerable stronger than the background source and could be detected on individual baselines in the available on-source time. Table 1 lists the positions, intensities, source separations, LSR velocity of the reference maser feature and synthesized beam sizes.
| Source | R.A. (J2000) | Dec. (J2000) | P.A. | Beam | |||
|---|---|---|---|---|---|---|---|
| (h m s) | (° ′ ″) | (Jy/beam) | (°) | (°) | (km s-1) | (mas mas °) | |
| VY CMa……. | 07 22 58.3283 | 25 46 03.075 | 18 27 | … | … | 33.3 | 0.5 0.2 @ 12 |
| J07252640… | 07 25 24.4130 | 26 40 32.680 | 0.03 | 1.1 | 34 | … | 2.7 0.6 @ 11 |
| J07312341… | 07 31 06.6680 | 23 41 47.869 | 0.06 | 2.8 | 136 | … | 0.8 0.3 @ 6 |
Note. — The fourth and seventh columns give the peak brightnesses () and of reference feature. The fifth and sixth columns give the separations ( and position angles (P.A.) east of north between maser and background sources. The last column gives the FWHM size and P.A. of the Gaussian restoring beam. Calibrator J07252640 is from the VLA program AR569, and its position is corrected using information from the VLBA Calibrator Survey (VCS) by Kovalev et al. (2007), the information for J07312341 is from VCS by Petrov et al. (2005).
We placed observations of two strong sources (J07301141 and J05301131) near the beginning, middle, and end of the observations in order to monitor delay and electronic phase differences among the intermediate-frequency bands. The rapid-switching observations employed two adjacent bands of 8 MHz bandwidth and recorded both right and left circularly polarized signals. The two (dual-polarized) bands were centered at Local Standard of Rest velocities () of and km s-1 for VY CMa. The SiO masers were contained in the second band.
In order to do atmospheric delay calibration, we placed “geodetic” blocks before and after our phase-reference observations (Reid et al., 2009). These data were taken in left circular polarization with eight 8 MHz bands that spanned 480 MHz of bandwidth between 42.9 and 43.4 GHz; the bands were spaced in a “minimum redundancy configuration” to uniformly sample, as best as possible, all frequency differences.
The data were correlated in two passes with the VLBA correlator in Socorro, NM. One pass generated 16 spectral channels for all the data and a second pass generated 256 spectral channels, but only for the single (dual-polarized) frequency band containing the maser signals, giving a velocity resolution of 0.21 km s-1. The data calibration was performed with the NRAO AIPS package as described by Reid et al. (2009).
2.2 VLA Observations
Observation of the radio photosphere and maser emission toward VY CMa at 43 GHz were made with VLA in its largest (A) configuration under program AR595 on 2006 April 17. We used a dual intermediate frequency band setup with a narrow (6.25 MHz) band covering an LSR velocity range of to km s-1 for the SiO maser line (rest frequency of 43122.08 MHz) and a broad (50 MHz) IF band centered MHz above the masers on a line-free portion of the spectrum. We also observed the SiO maser emission at high spectral resolution with several scans in spectral-line mode interspersed among the dual-band continuum observations. These covered the SiO line emission with a bandwidth of 6.25 MHz centered at 22 km s-1 using 128 spectral channels, which provided a channel spacing of 0.34 km s-1.
A typical observing unit for our continuum observations consisted of a minute VY CMa scan, followed by a 1.5 minute scan of, alternately, the quasar J0730–1141 and J0648–3044. For a spectral-line observation, we observed a calibrator J07301141 for about 1.5 minutes and VY CMa for 6.5 minutes. Absolute flux density calibration was established by an observation of 3C 286 (J1331+3030), assuming a flux density of 1.46 Jy at 43 GHz. Data calibration procedures are described in detail in Reid & Menten (1997, 2007).
3 SPATIAL DISTRIBUTION AND INTERNAL MOTION OF MASER SPOTS
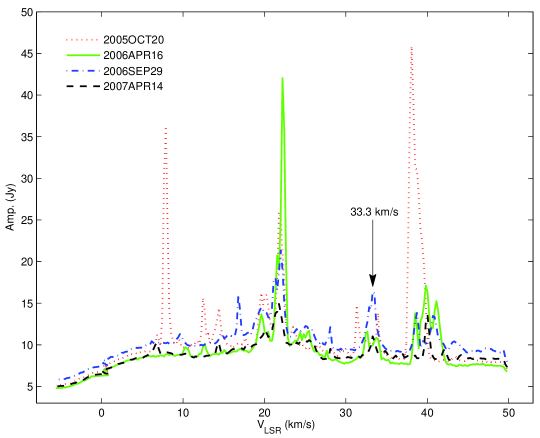
Fig. 1 shows interferometer spectra of SiO maser emission observed with a long VLBA baseline at all four epochs. The SiO maser emission spans a range of about 6 to 42 km s-1. One can see that the flux densities of some maser features varied considerably over 1.5 yr. We selected a compact and relative stable strong maser spot at of 33.3 km s-1 to serve as the phase-reference. The point-source response function (dirty beam) typically had a FWHM of 0.5 by 0.2 mas at a position angle of ∘ east of north using uniform weighting.
(A color version of this figure is available in the online journal.)
(A color version of this figure is available in the online journal.)
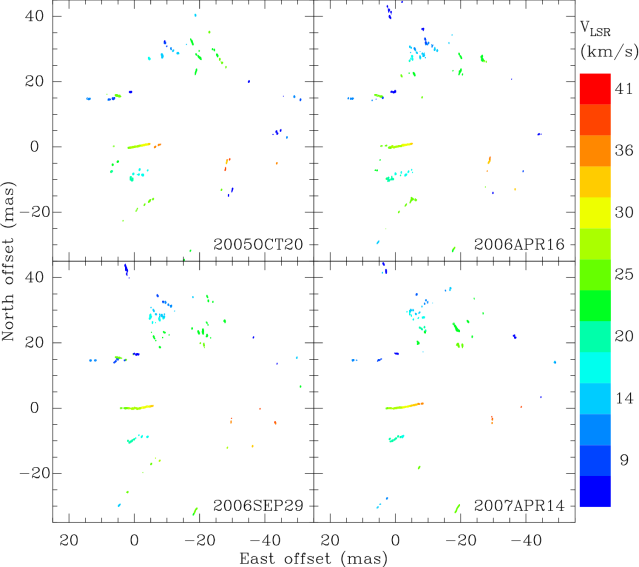
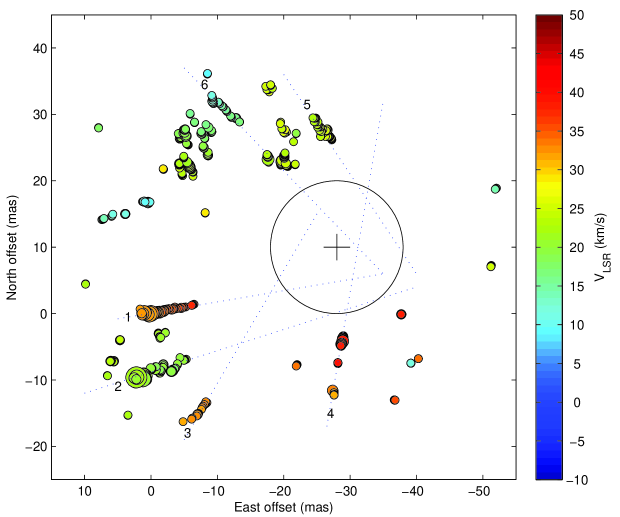
Figure 2 shows the spatial distribution of SiO maser emission towards VY CMa relative to the reference maser spot at = 33.3 km s-1. The total extent of the SiO maser spot distribution is about 80 mas, which is consistent with previous studies (Miyoshi et al., 1994, 2003), while the spatial distribution changes in detail. We considered maser spots at different epochs as being from the same feature if their positions in the same spectral channel were coincident within 5 mas at different epochs, corresponding to a motion of less than 20 km s-1. Selecting only the brightest maser spot in each channel, we found nine features including at least two maser spots in adjacent channels that were detected at all four epochs (see Fig. 3).
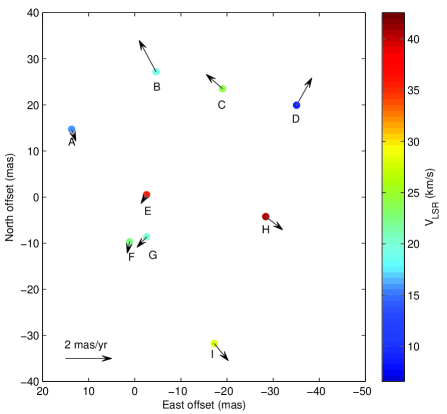
The relative motions of features were calculated by performing a weighted least-squares fit for linear motion with respective to the reference feature. After removing the average relative motion of all maser features, the remaining (internal) motion vectors, indicated with arrows in Fig. 3, exhibit an expanding structure. These internal motions are also listed in Table 2; the maximal motion is measured for feature B. It is about 1.4 mas yr-1, corresponding to 8 km s-1 at a distance of 1.2 kpc.
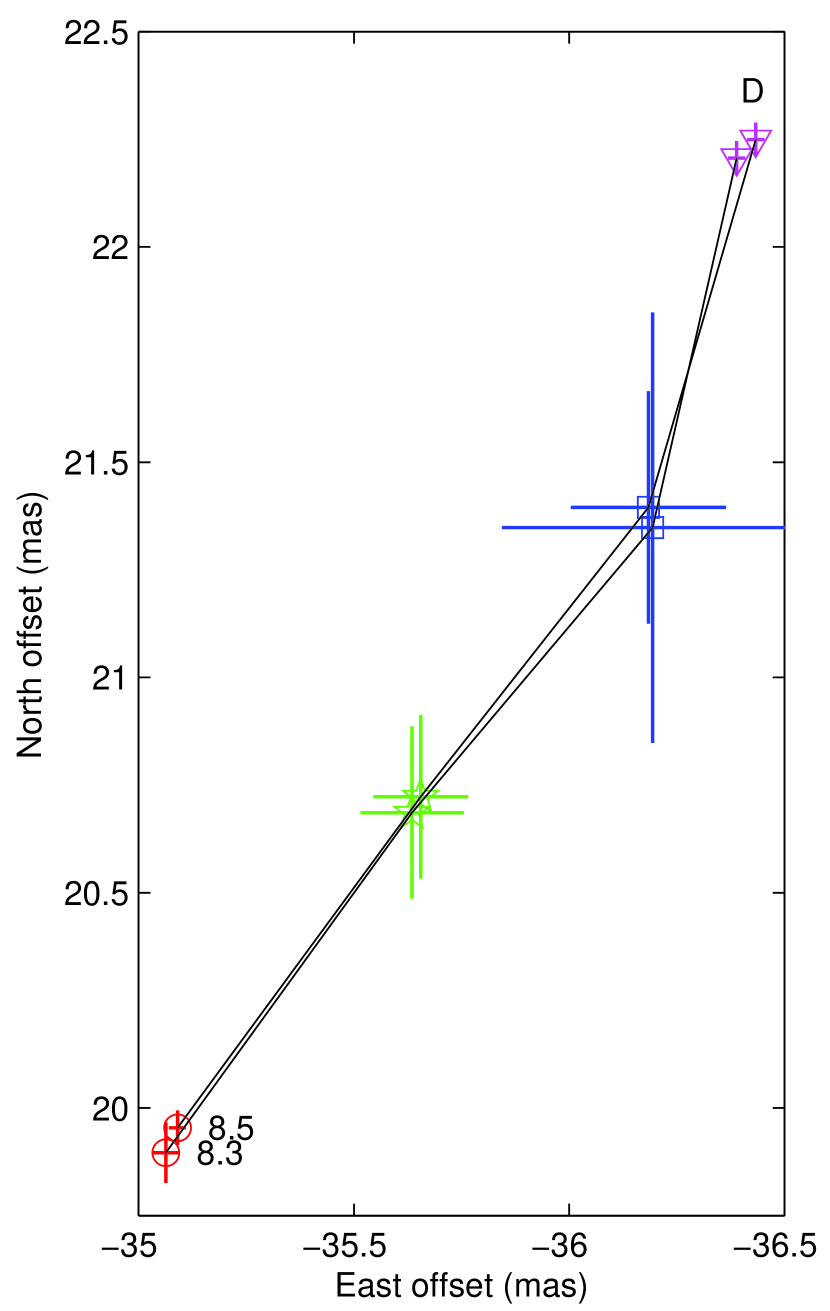
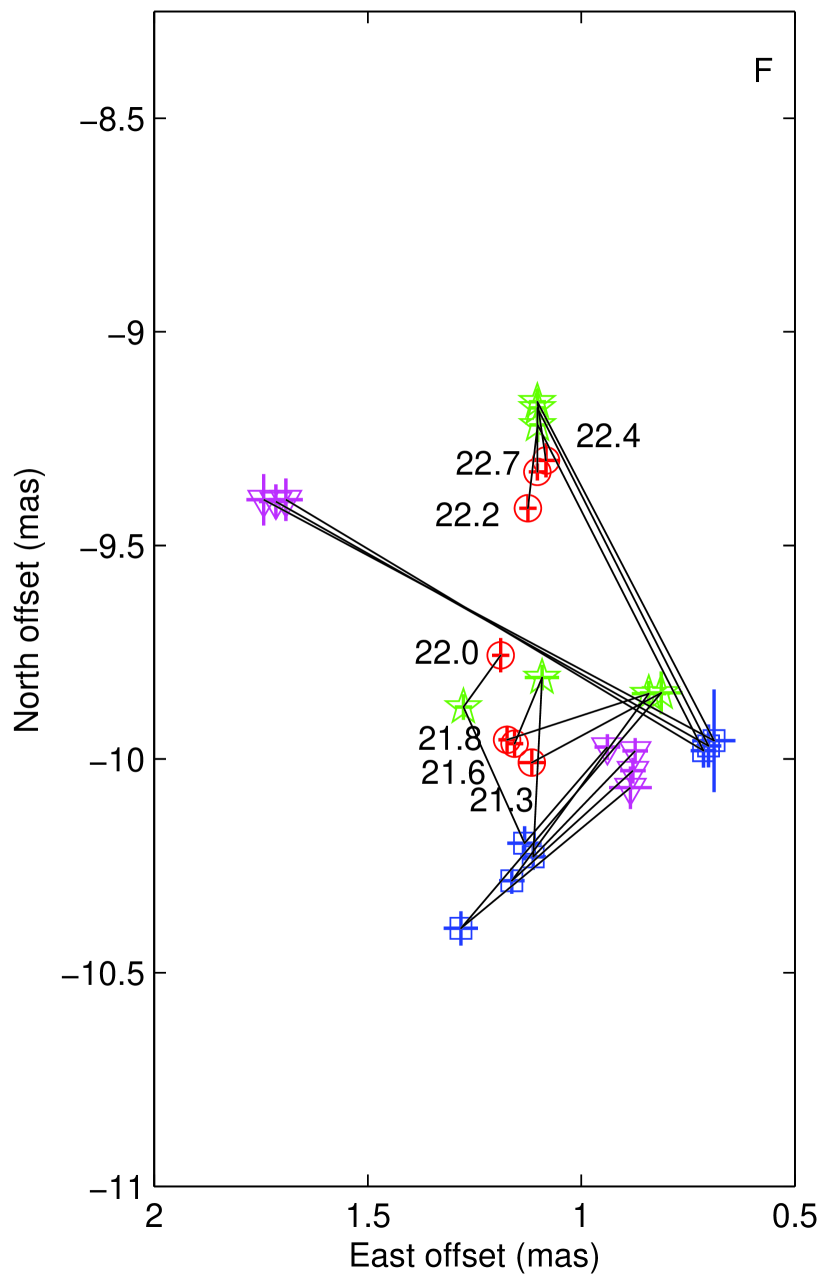
Fig. 4 shows the time variations of the positions of some maser spots relative to the reference spot. The masers in feature D exhibit approximate linear motions, while those in feature F show less regular motions. Indeed, in feature F, it is difficult to avoid possible misidentification of the same maser spots from one epoch to another, which introduces uncertainty in the kinematic parameters of those maser spots. Thus, for parallax measurements, only those with linear motions were used.
(A color version of this figure is available in the online journal.)
| Region | |||
|---|---|---|---|
| (km s-1) | (mas yr-1) | (mas yr-1) | |
| A | 15.0 | -0.187 0.029 | -0.511 0.003 |
| B | 18.5 | 0.732 0.087 | 1.359 0.007 |
| C | 23.7 | 0.705 0.202 | 0.621 0.055 |
| D | 8.5 | -0.664 0.007 | 1.182 0.003 |
| E | 35.5 | 0.240 0.013 | -0.377 0.011 |
| F | 22.0 | 0.100 0.035 | -0.501 0.011 |
| G | 19.8 | 0.418 0.007 | -0.455 0.012 |
| H | 39.8 | -0.735 0.070 | -0.573 0.057 |
| I | 27.6 | -0.610 0.114 | -0.745 0.143 |
Note. — Motions and are listed with the unweighted average motion removed.
(A color version of this figure is available in the online journal.)
4 PARALLAX AND PROPER MOTION
We fitted elliptical Gaussian brightness distributions to the images of strong maser spots and the extragalactic radio sources for all four epochs. The change in position of each maser spot relative to each background radio source was modeled by the parallax sinusoid in both coordinates (determined by a single parameter, the star’s parallax) and a linear proper motion in each coordinate.
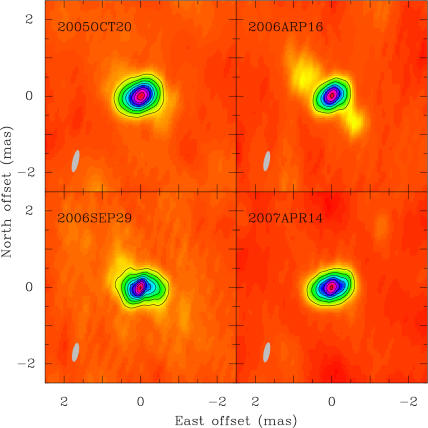
Fig. 5 shows the maser reference channel images at all four epochs. One can see that the emission appears dominated by a single compact component, and there is no dramatic variation over the 1.5 year time span of our observations. The extragalactic source J07312341 was relatively far (2.8∘) from VY CMa, and it was only used to determine the absolute position of the maser reference spot. We only used J07252640, separated by 1.1∘ from VY CMa, to determine the parallax.
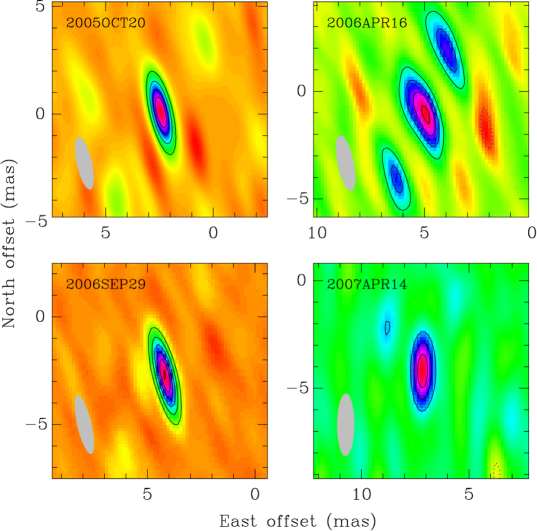
Fig. 6 provides images of background radio source J07252640 using only the inner 5 VLBA antennas at all epochs. This source is dominated by a single component with peak brightnesses of 0.13, 0.04, 0.15 and 0.02 mJy beam-1 at our four epochs. The variation of the brightnesses is probably caused in part by significant flux loss owing to poor phase coherence in the two April observations, which were in evening hours when coherence is often poor.
(A color version of this figure is available in the online journal.)
(A color version of this figure is available in the online journal.)
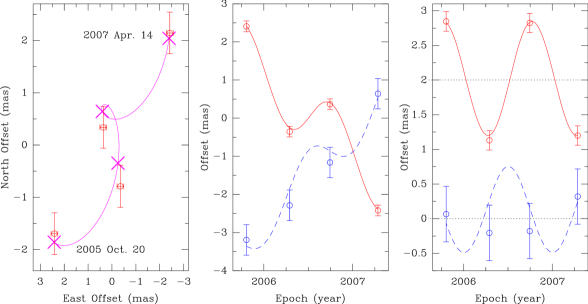
As mentioned in §3, the apparent motions of the maser spots can be complicated by a combination of spectral blending and changes in intensity. Thus, for parallax fitting, one needs to find stable, unblended spots and/or use many maser spots. Thus, we first fitted a parallax and proper motion to the position offsets for each maser spot separately (with respect to the background radio source J07252640). In Fig. 7, we plot the position of the reference maser spot relative to the background radio source as an example, with superposed curves representing the model maser tracks across the sky. This is one of the most compact and unblended spots that was detectable at all four epochs.
(A color version of this figure is available in the online journal.)
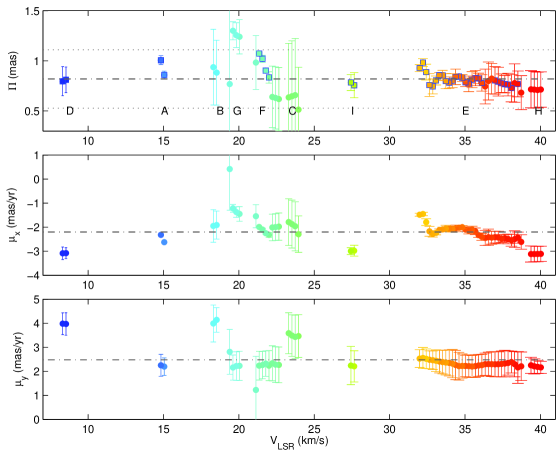
Fig. 8 shows the estimated parallaxes and proper motions for all measured maser spots. While the parallaxes should be identical (within measurement uncertainties), the proper motions are expected to vary among the spots owing to internal motions of km s-1 ( mas yr-1 at a distance of 1.2 kpc). While most of the maser spot parallaxes show good internal consistency, the dispersion of parallax estimates over the entire ensemble is considerably larger than the formal errors would suggest. This is caused by residual systematic errors affecting the fits, which originate in the complexity and evolution of blended spectral and spatial structure for some of the masers.
We discarded all parallax solutions that had formal uncertainties large than 150 as, corresponding to relative uncertainties of (for a parallax of 0.83 mas). Some parallaxes from region G appear to be outliers, and we discarded the results from this region. The remaining fits generally yield internally consistent parallaxes. Most of the parallax results are distributed in a range defined by , where and are the average and standard deviation of parallaxes, respectively. Table 3 lists the results of the parallax and proper motion fits for all remaining maser spots.
Since one expects the same parallax for all maser spots, we did a combined solution (fitting with a single parallax parameter for all maser spots, but allowing for different proper motions for each maser spot) using all the remaining maser spots (indicated with squares in the top panel of Fig. 8). The combined parallax estimate is mas, corresponding to a distance of kpc, which is consistent with the VERA result for the H2O masers in VY CMa (Choi et al., 2008a). The quoted uncertainty is the formal error multiplied by (where is the number of maser spots used in the final parallax fit) to allow for the possibility of correlated position variations for all the maser spots. This could result from small variations in the background source or from unmodeled atmospheric delays, both of which would affect the maser spots nearly identically (Reid et al., 2009). The average proper motion of all selected maser spots is mas yr-1 eastward and mas yr-1 northward, which is reasonably compatible with the VERA results ( mas yr-1 eastward and mas yr-1 northward).
(A color version of this figure is available in the online journal.)
| Region | Ch. | Parallax | |||
|---|---|---|---|---|---|
| (km s-1) | (mas) | (mas yr-1) | (mas yr-1) | ||
| A | 161 | 15.0 | 0.859 0.038 | -2.625 0.068 | 2.196 0.365 |
| 162 | 14.8 | 1.007 0.044 | -2.323 0.078 | 2.252 0.457 | |
| D | 191 | 8.5 | 0.811 0.127 | -3.081 0.228 | 3.972 0.466 |
| 192 | 8.3 | 0.796 0.145 | -3.088 0.260 | 3.982 0.454 | |
| E | 53 | 38.5 | 0.770 0.129 | -2.437 0.231 | 2.164 0.660 |
| 55 | 38.1 | 0.728 0.137 | -2.544 0.245 | 2.385 0.455 | |
| 56 | 37.9 | 0.763 0.113 | -2.492 0.202 | 2.346 0.506 | |
| 57 | 37.6 | 0.768 0.087 | -2.460 0.155 | 2.325 0.553 | |
| 58 | 37.4 | 0.777 0.093 | -2.475 0.166 | 2.310 0.538 | |
| 59 | 37.2 | 0.793 0.143 | -2.431 0.257 | 2.296 0.517 | |
| 60 | 37.0 | 0.805 0.137 | -2.417 0.246 | 2.296 0.526 | |
| 64 | 36.1 | 0.779 0.082 | -2.406 0.146 | 2.260 0.453 | |
| 65 | 35.9 | 0.824 0.053 | -2.334 0.094 | 2.242 0.459 | |
| 66 | 35.7 | 0.827 0.076 | -2.173 0.136 | 2.217 0.470 | |
| 67 | 35.5 | 0.812 0.080 | -2.107 0.143 | 2.201 0.456 | |
| 68 | 35.3 | 0.770 0.079 | -2.142 0.141 | 2.218 0.463 | |
| 69 | 35.0 | 0.786 0.042 | -2.100 0.075 | 2.225 0.448 | |
| 70 | 34.8 | 0.829 0.036 | -2.001 0.064 | 2.222 0.503 | |
| 71 | 34.6 | 0.844 0.012 | -2.025 0.022 | 2.216 0.576 | |
| 72 | 34.4 | 0.840 0.078 | -2.051 0.139 | 2.262 0.610 | |
| 73 | 34.2 | 0.802 0.070 | -2.080 0.124 | 2.321 0.585 | |
| 74 | 33.9 | 0.783 0.057 | -2.071 0.101 | 2.350 0.540 | |
| 75 | 33.7 | 0.798 0.076 | -2.059 0.135 | 2.366 0.515 | |
| 76 | 33.5 | 0.855 0.050 | -2.094 0.089 | 2.386 0.488 | |
| 77 | 33.3 | 0.857 0.028 | -2.123 0.050 | 2.411 0.475 | |
| 78 | 33.1 | 0.804 0.045 | -2.240 0.080 | 2.442 0.452 | |
| 79 | 32.9 | 0.745 0.074 | -2.280 0.133 | 2.462 0.388 | |
| 80 | 32.6 | 0.759 0.113 | -2.175 0.203 | 2.481 0.373 | |
| 81 | 32.4 | 0.888 0.078 | -1.792 0.140 | 2.523 0.409 | |
| 82 | 32.2 | 0.983 0.038 | -1.453 0.068 | 2.557 0.436 | |
| 83 | 32.0 | 0.928 0.034 | -1.485 0.061 | 2.529 0.369 | |
| F | 129 | 22.0 | 0.834 0.057 | -2.322 0.101 | 2.236 0.623 |
| 130 | 21.8 | 0.903 0.027 | -2.252 0.048 | 2.322 0.530 | |
| 131 | 21.6 | 1.021 0.036 | -2.102 0.064 | 2.261 0.568 | |
| 132 | 21.3 | 1.073 0.009 | -1.993 0.016 | 2.237 0.598 | |
| I | 103 | 27.6 | 0.757 0.125 | -2.979 0.224 | 2.208 0.649 |
| 104 | 27.4 | 0.784 0.079 | -2.997 0.142 | 2.240 0.794 | |
| Combined | 0.830 0.079 | -2.210 0.060 | 2.290 0.300 |
Note. — Absolute proper motions are defined as and .
5 ABSOLUTE POSITION OF CENTRAL STAR
5.1 Absolute position of VY CMa derived from VLBA observation
Based on the circumstellar maser distribution, it is possible to locate the central star with reasonable accuracy. For example, for a ring-like distribution of maser emission, the star should be located at the center of the ring. That this is indeed the case has been observationally verified for AGB stars by Reid & Menten (1990) for H2O masers and Reid & Menten (2007) for SiO masers. Previous VLBI observations of SiO masers towards VY CMa have shown that the masers appear clumpy and asymmetrical (Miyoshi et al., 1994, 2003). Our observations (see Fig. 2) show that the SiO masers toward VY CMa exhibit only a partial ring-like structure.
There are “spoke-like” (linearly distributed) maser features at all four epochs; one of the best examples is found in the group of features which include the reference spot (see Fig. 9). These maser features, appear to be composed of “spokes” of gas flowing outward from the central star and mostly have decreasing radial velocities with increasing the distance from the star (Yi et al., 2005; Matsumoto et al., 2008). There are several spoke-like maser features in VY CMa and they probably “point back” to the star. From these spoke-like features and the ring-like maser distribution, we estimate the position of the central star relative to the reference spot to be ( = 28, = 10 mas) in east and north directions with an uncertainty of about 10 mas. Based on the combined parallax fit in §4, we determine the position offset ( = , = mas) of the reference spot at mean epoch 2006.53 of our observation. Combining these offsets, we estimate the absolute position ( = 07h22m583259, = 25∘46′03063) of the central star with an uncertainty of about 10 mas.
(A color version of this figure is available in the online journal.)
5.2 SiO masers and radio photosphere from VLA observation at 43 GHz
From multi-wavelength VLA observations of a sample of long period Mira and semi-regular variable stars, Reid & Menten (1997, 2007) detected emission from their radio photospheres. The approach of using a strong narrowband signal (maser emission) in one observing band to calibrate the phase (and amplitude if necessary) of a weak broadband signal (radio continuum emission from the radio photosphere) was described in detail by Reid & Menten (1997, 2007). In the following we refer to the two datasets as narrow band (NBD) and broad band (BBD) data.
In order to register the SiO masers relative to the radio photosphere, we first measured the position of the radio photosphere from the BBD relative to the maser emission in the (pseudo-continuum) NBD. Next, we aligned the maser emission from the spectral-line data by producing a map of “simulated” NBD (hereafter SNBD) from the line data. Because the NBD and SNBD cover the same velocity range, we can align the maps from the NBD and SNBD by comparison of positions of peaks in each map. This allows the positions of the emission in individual channels to be registered to the NBD, and then to the BBD (radio photosphere) emission.
Following the procedures described in detail in Reid & Menten (1997), once the data were “cross-self-calibrated”, both NBD and BBD were imaged with the AIPS task IMAGR. We performed Gaussian position fits to the peak in the BBD and NBD, using AIPS task JMFIT, and obtained the relative position ( = , = mas).
The line data were self-calibrated by choosing a channel with strong emission as a reference, and the resulting phase and amplitude corrections were applied to the other channels. From the line data we produced a spectral-line data cube and then we produced a NBD-like map by averaging all the channels in the cube. We fitted the two strongest peaks in the NBD and SNBD maps and calculated a relative position of ( = 8, = 24 mas) with an uncertainty less than 1 mas.
(A color version of this figure is available in the online journal.)
Finally, we estimated a position offset ( = , = mas) of the weak continuum source (radio photosphere) relative to the maser spots (reference spot) with a uncertainty of 3 mas. Thus, all the maser spots were registered to the radio photosphere at a similar accuracy (see Fig. 10).
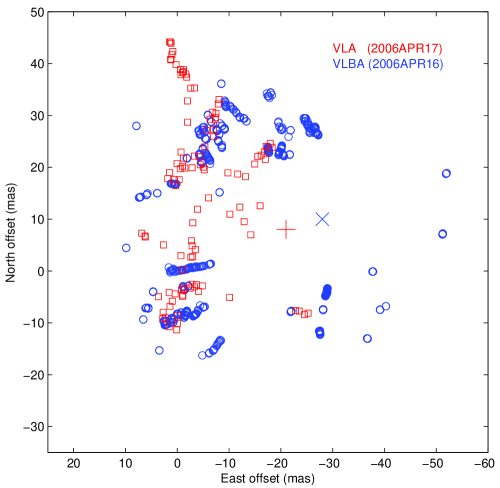
However, to estimate absolute position of the continuum source, we have to align the maser spots with those from the VLBA observations. Due to the significantly different angular resolution and sensitivity of the VLA and VLBA, there is no guarantee that the two images should be identical. Note that the VLA has a 50 mas synthesized beam, which for any channel essentially gives a centroid position. If a single spectral channel contains emission from across the source, the VLA position would be falsely interpreted as near the center of the distribution.
(A color version of this figure is available in the online journal.)
Nevertheless, the SiO maser distributions from VLA and VLBA data bear significant resemblance. In order to align these two maps, we assumed that the centroid positions of the strongest maser spots are consistent. For the VLA map, the strongest maser spot was chosen as the phase reference and, hence, is at the map origin (see Fig. 10). For the VLBA map, the phase reference was not the strongest spot, and the reference spot is at () mas (see Fig. 9). After shifting all positions from the VLA map by this offset, we find reasonable agreement with the VLBA and VLA maser spot maps. Since we obtained an offset of () mas for the central star (imaged with the VLA) relative to the VLBA spots maps, we now can locate the star on the VLBA spot maps to about 10 mas uncertainty. This is shown in Fig. 11.
6 THE KINEMATIC MODEL
6.1 Expansion
Combining the proper motion (, ) and parallax with the of each maser spot, we can derive its 3-dimensional velocity vector and its variance
| (1) | |||
| (2) | |||
| (3) |
where is used to convert proper motion to velocity adopting the distance of 1.2 kpc from §4, and is a “turbulent” velocity component, assumed to be km s-1. The of the star () is adopted as 22 km s-1 from Menten et al. (2006).
The model velocity vector for an expanding flow is
| (4) |
where, is an expansion speed modeled as
| (5) |
is the systemic velocity (presumably of the exciting star) and () is the position vector of a maser spot relative to the expansion center . The sky positions () of the maser spots are relative to the reference maser spot which is located at (,), and the radial position is relative to the expansion center assuming . The sky positions () are converted from mas to AU adopting a distance of 1.2 kpc.
The three components of velocity for all maser features in §3 are taken as observables, and the weight of each observable is assigned the reciprocal of its variance. The fitting procedure is similar to that used in previous studies (Reid et al., 1988; Gwinn et al., 1992; Imai et al., 2000); however, unlike most other expanding maser models, we know the distance and and do not have to solve for them. Apart from the global parameters listed in Table 4, the of each maser spot is also solved for as a free parameter. In order to restrict the parameter estimates to physically reasonable values as well as to incorporate our knowledge of parameters and , we added a priori information for these two parameters by adding extra data-like equations, one for each parameter, to the observables, and weighting the “pseudo-observables” with their estimated uncertainties. This allowed us to incorporate the information that ( AU) from §5.
The global parameters and the of each maser spot were adjusted to minimize the sum of the squares of the weighted residuals using the Levenberg-Marquardt method. We first performed the model fitting using all the maser spots, and then discarded those maser spots (6 of 60) with large residuals (), and estimated the parameters again; the best fitted global parameters are listed in Table 4. As Fig. 12 shows, the expansion velocities are much smaller than the systemic velocity, indicating that the absolute proper motions of the maser spots are dominated by the systemic velocity of km s-1 eastward and km s-1 northward (corresponding to mas yr-1 and mas yr-1), which is consistent with the proper motion estimated in §4 within 3.
| Parameter | Value | Uncertainty | Units | Comments |
|---|---|---|---|---|
| 35 | 5 | (AU) | Center of expansion | |
| 13 | 5 | (AU) | ||
| 16 | 1 | (km s-1) | Systemic velocity | |
| 15 | 1 | (km s-1) | ||
| 2 | 1 | (km s-1) | Expansion speed at the origin | |
| 0.09 | 0.01 | (km s-1 AU-1) | Expansion speed gradient |
(A color version of this figure is available in the online journal.)
6.2 Radial Spoke-like Maser Features
(A color version of this figure is available in the online journal.)
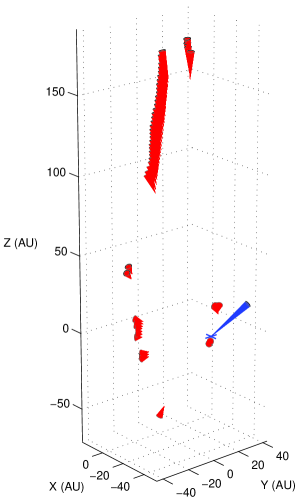
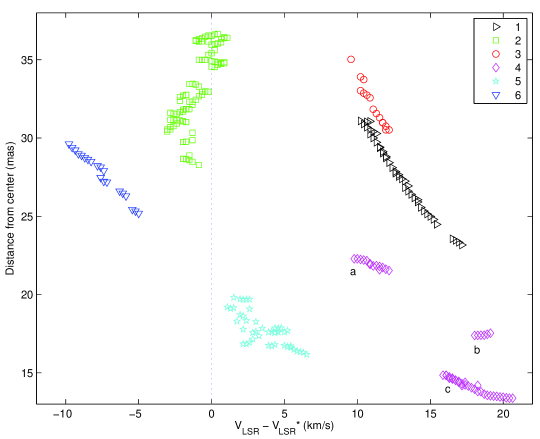
As mentioned in §5.1, there are several spoke-like maser features in VY CMa. Fig. 13 shows the distance-velocity structure of six of these features, labeled as in Fig. 9. These spoke-like features have clear velocity gradients, and most of them have radial velocities ( ) 0 and decreasing with increasing angular distance from the center. This could happen in two ways: (1) the spoke-like features have motions outward from the star (i.e., outflow) on the far side and are decelerating; (2) the spoke-like features have motions inward toward the star (i.e., infall) on the near side and are accelerating. Taken into consideration the motions shown in Fig.3, we believe most of the spoke-like features are on the far side and are decelerating.
In order to explore the nature of the radial velocities of the observed spoke-like features, we adopt the ballistic-orbit model of Matsumoto et al. (2008) to fit the distance-velocity structure of the spoke-like feature. This model assumes that the maser spots are moving in a radial direction with acceleration or deceleration due to the stellar gravity.
The relation between the projected distance from the center of the star, , and the line-of-sight velocity, , is written as
| (6) |
where = , is the gravitational constant, the stellar mass, () the inclination angle of the maser feature projected onto the sky plane, and is the distance of apocenter (where ) from the center of the star. However, unlike the ballistic-orbit model fitting in Matsumoto et al. (2008), we adopt a stellar mass of 25 from Monnier et al. (2000), while we think is unknown and may be different for each spoke-like feature. Thus, we solve for , which is converted to angular units adopting a distance of 1.2 kpc, and for each spoke-like feature.
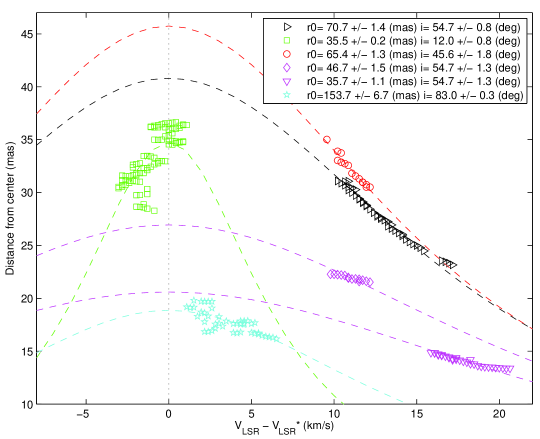
(A color version of this figure is available in the online journal.)
Fig. 14 shows the observed and modeled distance-velocity structures of all the spoke-like features (except 6 and 4b which do not follow a ballistic model) using Eq. 6. The distance-velocity structure should be symmetric about , which means blue shifted () maser feature should increase their with increasing distance. Since most of the spoke-like features can be reasonably well modeled with ballistic orbits, this suggests that most of the spoke-like features “point back” to the star.
7 DISCUSSION
Images of some AGB stars such as IK Tauri demonstrate that SiO masers may form circular or elliptical rings of emission. Also the line-of-sight velocity structure of some SiO masers can have an apparent axis of symmetry consistent with the elongation axis of the maser distribution, suggestive of rotation of the SiO maser shell (Boboltz, 2005, and references therein). However, for VY CMa such symmetry is not evident in the spatial or velocity distribution of the masers. Large scale optical and near-infrared images of VY CMa (e.g. Kastner & Weintraub (1998); Monnier et al. (1999); Smith et al. (2001); Humphreys et al. (2007)) display a possible northeast-southwest axis of symmetry, which might suggest a possible bipolar structure. However, these observations are from dust emission much further from the star than the circumstellar SiO masers. After subtracting the average internal motion, the SiO masers show a tendency for expansion from the central star, which is similar to the 22 GHz H2O masers measured by VERA (Choi et al., 2008b). Observation of SiO () maser emission towards VY CMa with VLA shows a bipolar outflow along the line of sight (Shinnaga et al., 2004), consistent with the 3-dimensional kinematics of the H2O masers from Choi et al. (2008b). However, there is no strong evidence for bipolar outflow but a slow quasi-spherical outflow displayed in Fig. 12 from our VLBA observations.
The 3-dimensional expansion model implies that the radial velocities of the maser features will increase with increasing distance from the star. If the maser features are radially aligned as the ballistic orbit model assumes, then the expansion model seems counter to the ballistic model. However, the ballistic-orbit model provides only one of the possible explanations for the spoke-like features. As mentioned in §6.2, there are still spoke-like features that cannot be modeled with a ballistic orbit. A more realistic model might involve a hydrostatic inner envelope and/or acceleration driven by pulsation or giant convective cells first introduced by Schwarzschild (1975). For the expansion model, a very small value of the expansion speed gradient (see Table 4) is rather weak evidence for acceleration in outward motion. Furthermore, even though we know the distance of the star, based on the combined parallax of the maser spots, the distances of the maser features from the star are unclear (i.e., coordinate component along the line of sight, ) and can only be solved for as parameters, which are dependent on the model. Nevertheless, the uncertain ’s of the maser features for the expansion model will not significantly affect the derivation of the proper motion of the central star, which is one of the most important results in this paper.
Our accurate parallax based on SiO masers measured with VLBA agrees with that determined from H2O masers with VERA (see Table 5). The small difference in proper motions of the center of expansions for the two maser species is not strongly statistically significant and, even if real, might be caused by small errors in determining the center of expansion for the different maser species which are located in different places in the circumstellar envelope.
Lada & Reid (1978) suggested that VY CMa and the open cluster NGC 2362 are at nearly the same distance, which was estimated to be 1.5 kpc from main-sequence fitting of NGC 2362. Their argument rested on the fact that VY CMa was located at the apex of an arc of bright emission that is visible in red-light images and had a similar to that of the molecular cloud complex and the stars of the cluster NGC 2362. Lada & Reid also pointed out that there were other possible ionizing sources for the arc, including CMa (HD 57061); UW CMa (HD 57060, 29 CMa); and NN CMa (HD 58011). These stars were estimated to be 1.1 kpc distant, based on photometric measurements, and significantly closer than NGC 2362. Since our trigonometric parallax is closer to 1.1 than 1.5 kpc, this suggests that the main-sequence fitting at the time was less accurate than the photometric distances.
The main-sequence fitting distances are nearly 40 years old and one might worry that better calibrations would resolve the discrepancy. However, more recent estimates of the distance to NGC 2362 are 1.62 kpc (Mermilliod & Maeder, 1986), 1.42 kpc (Brown et al., 1986), 1.48 kpc (Moitinho et al., 2001) and 1.36 kpc (Mayne & Naylor, 2008). These are all reasonably consistent with the 1.5 kpc value previously used and still different from the parallax values determined in this paper and by VERA. For an individual star, a photometric distance is highly dependent on the spectral type and extinction model. Compared to 1.1 kpc quoted by Lada & Reid (1978), Kaltcheva & Hilditch (2000) estimate a significant different photometric distance of 2.86 kpc for NN CMa and 1.51 kpc for UW CMa. These are significantly larger than 1.2 kpc distance to VY CMa reported in this paper. Provided that VY CMa is indeed associated with NGC 2362 and NN CMa or UV CMa, this suggest that systematic uncertainties for the distance estimated using either main-sequence fitting or the photometric method is at least .
The absolute position of the central star from our VLBA and VLA measurement at 43 GHz is consistent with that from VERA. However, the position and proper motion from Hipparcos are significantly different with the values determined from radio measurements (see Table 5). Using the position and proper motion from radio measurement, we predicted the position of VY CMa at the same epoch as the Hipparcos catalogue, then compared the position derived from optical and radio observations, and found a large discrepancy of tens of mas. VY CMa is embedded in an asymmetric dust reflection nebula, and recent images from optical (Kastner & Weintraub, 1998; Smith et al., 2001; Humphreys et al., 2007) and near-IR observations (Monnier et al., 1999) show that the dust shell is time variable. Since most of the optical radiation coming from the star is reprocessed by the surrounding dust, a likely explanation for the difference between Hipparcos and the radio results is that the observed optical light is mostly scattered by circumstellar dust and a reliable stellar proper motion determination at optical wavelengths is practically impossible.
Another possibility for a difference between the VLBA and Hipparcos proper motions would be that an inhomogeneity on VY CMa’s surface contributes to the Hipparcos proper motion. For example, the early M-type supergiant Orionis’ ultraviolet appearance, as resolved with the Hubble space telescope, shows a conspicuous, compact “hot spot” (Gilliland & Dupree, 1996), with a 200 K higher temperature than the rest of the surface. One of their interpretations for this spot is in the context of a conjecture by Schwarzschild (1975) that a red giant star’s surface only may show a few hundred convective cells, with large temperature differences (of up to 1000 K) between the hot and cool portions of a convective element. In addition, Soker & Clayton (1999) investigated the structure of cool magnetic spots in the photospheres of evolved stars and found the spots will cause the AGB star to appear asymmetrical. Adopting a diameter of 20 mas (Monnier et al., 2000) for VY CMa, could the apparent proper motion from Hipparcos be the result of a hot spot rotating with the star’s surface? Unfortunately, the rotation velocities of red supergiant are expected to be of order 1 km s-1, much lower the measured proper motion discrepancy. Could the random appearance and disappearance of different independent spots mimic the Hipparcos proper motion? Given that Hipparcos’ proper motion determinations are typically based on 30 measurements within the mission lifetime of 3 yr, this is conceivable.
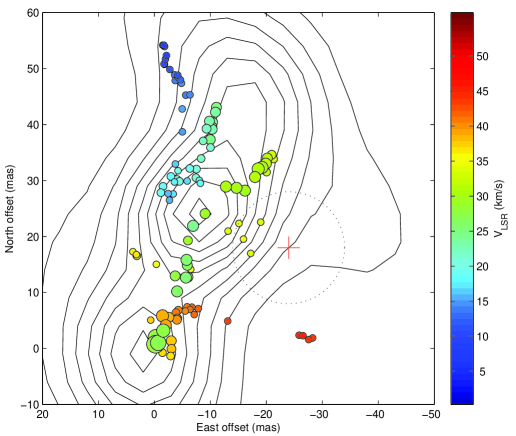
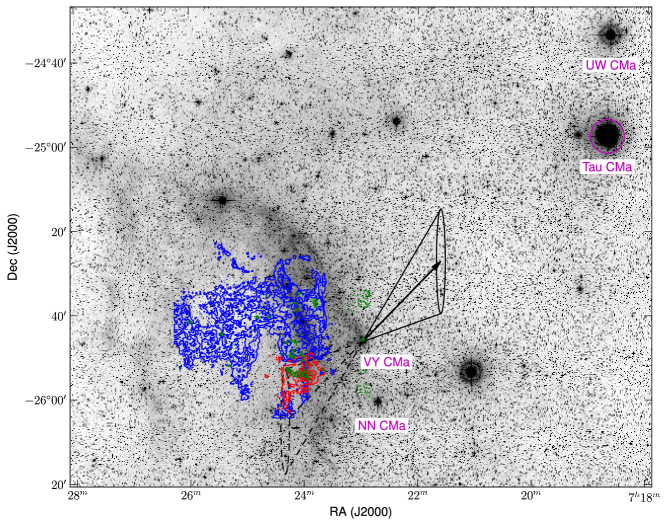
Fig. 15 shows the geometry of VY CMa’s optical environment overlaid with radio emission contours measured with the Atacama Pathfinder Experiment (APEX) telescope by Schuller & Menten (2011). The V-shaped surrounding material highlighted as H emission, which is either external to VY CMa (i.e., interstellar material) or comes from VY CMa (stellar mass loss), suggests relative motion of gas and the star. Taking our VLBA absolute proper motion, one explanation could be that VY CMa is drifting out of the molecular cloud to the east of it.
Assuming that VY CMa was formed in the region where current signs of star formation are found (i.e., to the south-east of the molecular cloud as indicated by the color contours in Fig. 15) and that the absolute proper motion of the molecular cloud is small, then the travel time of VY CMa to its current location is about 0.5 Myr. This might be reasonable since VY CMa is a very massive, and hence short-lived, star. However, adopting a luminosity of from Choi et al. (2008a) and an effective temperature of 3650 K from Massey et al. (2006), the location of VY CMa on an HR diagram is consistent with an age of of 8.2 Myr, based on an evolutionary track of a 25 star of solar metallicity with an initial rotational velocity of 300 km s-1 at its equator (Meynet & Maeder, 2003). This age discrepancy between the motion time and age of VY CMa may imply that the relative proper motion between the molecular cloud and VY CMa is much smaller than its absolute proper motion or that the stellar evolution model is not appropriate for VY CMa.
| Telescope | Epoch | R.A. (J2000) | Dec. (J2000) | ||
|---|---|---|---|---|---|
| (h m s) | (° ′ ″) | (mas yr-1) | (mas yr-1) | ||
| Hipparcosa | 1991.25 | 07 22 58.3251 0.0001 | 25 46 03.180 0.003 | 8.86 1.34 | 0.75 3.25 |
| Hipparcosb | 1991.25 | 07 22 58.3251 0.0002 | 25 46 03.176 0.003 | 5.72 2.01 | 6.75 4.47 |
| VERAc | 2006.82 | 07 22 58.3264 0.000? | 25 46 03.066 0.00? | 2.09 0.16 | 1.02 0.61 |
| VLBAd | 2006.53 | 07 22 58.3259 0.0007 | 25 46 03.070 0.010 | 2.21 0.06 | 2.29 0.30 |
(A color version of this figure is available in the online journal.)
8 CONCLUSIONS
We have measured the trigonometric parallax and proper motion of VY CMa from VLBA observations of the variations of relative positions between 43 GHz SiO masers and the background source J07252640. The parallax of 0.83 0.08 mas provides a distance of kpc, which is consistent with that measured with 22 GHz H2O maser using the VERA by Choi et al. (2008a). There can be little doubt that VY CMa is nearer than the value of 1.5 kpc generally used in the literature.
Using the VLA detection of the radio photosphere, using the SiO masers as a phase reference, we determined the position of the central star relative to the SiO masers. This position is consistent with that estimated from the distribution of maser spots with an uncertainty better than 10 mas. We found there are several spoke-like maser features; most of these could be modeled by ballistic orbits, suggesting that most spoke-like maser features are on the far side of the star, are decelerating, pointing back to the central star.
The kinematics of SiO maser spots show a slow expansion. After removing the effects of expansion, we derived an absolute proper motion of the central star. A large discrepancy of tens of mas between the positions of VY CMa determined by optical and radio measurements is found, and we suggest that optical position determinations are affected by the scattering from circumstellar dust and cannot be used to locate the star or its motion.
We wish to thank the anonymous referee for very detailed and helpful comments. B. Zhang is supported by the National Science Foundation of China under grant 10703010, 11073046, and the Knowledge Innovation Program of the Chinese Academy of Sciences.
References
- Baudry et al. (1984) Baudry, A., Mazurier, J. M., & Requieme, Y. 1984, in IAU Symposium, Vol. 110, VLBI and Compact Radio Sources, ed. R. Fanti, K. I. Kellermann, & G. Setti, 355
- Boboltz (2005) Boboltz, D. A. 2005, in Astronomical Society of the Pacific Conference Series, Vol. 340, Future Directions in High Resolution Astronomy, ed. J. Romney & M. Reid, 342
- Boboltz & Diamond (2000) Boboltz, D. A., & Diamond, P. J. 2000a, in Bulletin of the American Astronomical Society, Vol. 32, American Astronomical Society Meeting Abstracts, 1476
- Boboltz & Marvel (2000) Boboltz, D. A., & Marvel, K. B. 2000b, ApJ, 545, L149
- Brown et al. (1986) Brown, P. J. F., Dufton, P. L., Lennon, D. J., & Keenan, F. P. 1986, MNRAS, 220, 1003
- Choi et al. (2008a) Choi, Y. K., et al. 2008a, PASJ, 60, 1007
- Choi et al. (2008b) Choi, Y. K., Hirota, T., Honma, M., & Kobayashi, H. 2008b, in The role of VLBI in the Golden Age for Radio Astronomy
- Colomer (1993) Colomer, F. 1993, in Lecture Notes in Physics, Berlin Springer Verlag, Vol. 412, Astrophysical Masers, ed. A. W. Clegg & G. E. Nedoluha, 429–432
- Cotton et al. (2004) Cotton, W. D., et al. 2004, A&A, 414, 275
- Diamond et al. (1994) Diamond, P. J., Kemball, A. J., Junor, W., Zensus, A., Benson, J., & Dhawan, V. 1994, ApJ, 430, L61
- Gilliland & Dupree (1996) Gilliland, R. L., & Dupree, A. K. 1996, ApJ, 463, L29
- Greenhill et al. (1995) Greenhill, L. J., Colomer, F., Moran, J. M., Backer, D. C., Danchi, W. C., & Bester, M. 1995, ApJ, 449, 365
- Gwinn et al. (1992) Gwinn, C. R., Moran, J. M., & Reid, M. J. 1992, ApJ, 393, 149
- Hollis et al. (2001) Hollis, J. M., Boboltz, D. A., Pedelty, J. A., White, S. M., & Forster, J. R. 2001, ApJ, 559, L37
- Honma et al. (2008) Honma, M., Tamura, Y., & Reid, M. J. 2008, PASJ, 60, 951
- Humphreys et al. (2007) Humphreys, R. M., Helton, L. A., & Jones, T. J. 2007, AJ, 133, 2716
- Imai et al. (2000) Imai, H., Kameya, O., Sasao, T., Miyoshi, M., Deguchi, S., Horiuchi, S., & Asaki, Y. 2000, ApJ, 538, 751
- Kaltcheva & Hilditch (2000) Kaltcheva, N. T., & Hilditch, R. W. 2000, MNRAS, 312, 753
- Kastner & Weintraub (1998) Kastner, J. H., & Weintraub, D. A. 1998, AJ, 115, 1592
- Kovalev et al. (2007) Kovalev, Y. Y., Petrov, L., Fomalont, E. B., & Gordon, D. 2007, AJ, 133, 1236
- Lada & Reid (1978) Lada, C. J., & Reid, M. J. 1978, ApJ, 219, 95
- Massey et al. (2006) Massey, P., Levesque, E. M., & Plez, B. 2006, ApJ, 646, 1203
- Matsumoto et al. (2008) Matsumoto, N., et al. 2008, PASJ, 60, 1039
- Mayne & Naylor (2008) Mayne, N. J., & Naylor, T. 2008, MNRAS, 386, 261
- Menten et al. (2006) Menten, K. M., Philipp, S. D., Güsten, R., Alcolea, J., Polehampton, E. T., & Brünken, S. 2006, A&A, 454, L107
- Mermilliod & Maeder (1986) Mermilliod, J.-C., & Maeder, A. 1986, A&A, 158, 45
- Meynet & Maeder (2003) Meynet, G., & Maeder, A. 2003, A&A, 404, 975
- Miyoshi et al. (2003) Miyoshi, M., Kameno, S., & Falcke, H. 2003, in Astronomical Society of the Pacific Conference Series, Vol. 289, The Proceedings of the IAU 8th Asian-Pacific Regional Meeting, Volume I, ed. S. Ikeuchi, J. Hearnshaw, & T. Hanawa, 33–36
- Miyoshi et al. (1994) Miyoshi, M., Matsumoto, K., Kameno, S., Takaba, H., & Lwata, T. 1994, Nature, 371, 395
- Moitinho et al. (2001) Moitinho, A., Alves, J., Huélamo, N., & Lada, C. J. 2001, ApJ, 563, L73
- Monnier et al. (2000) Monnier, J. D., Danchi, W. C., Hale, D. S., Lipman, E. A., Tuthill, P. G., & Townes, C. H. 2000, ApJ, 543, 861
- Monnier et al. (1999) Monnier, J. D., Tuthill, P. G., Lopez, B., Cruzalebes, P., Danchi, W. C., & Haniff, C. A. 1999, ApJ, 512, 351
- Perryman et al. (1997) Perryman, M. A. C., et al. 1997, A&A, 323, L49
- Petrov et al. (2005) Petrov, L., Kovalev, Y. Y., Fomalont, E., & Gordon, D. 2005, AJ, 129, 1163
- Reid & Menten (1990) Reid, M. J., & Menten, K. M. 1990, ApJ, 360, L51
- Reid & Menten (1997) —. 1997, ApJ, 476, 327
- Reid & Menten (2007) —. 2007, ApJ, 671, 2068
- Reid et al. (2009) Reid, M. J., Menten, K. M., Brunthaler, A., Zheng, X. W., Moscadelli, L., & Xu, Y. 2009, ApJ, 693, 397
- Reid et al. (1988) Reid, M. J., Schneps, M. H., Moran, J. M., Gwinn, C. R., Genzel, R., Downes, D., & Roennaeng, B. 1988, ApJ, 330, 809
- Sánchez Contreras et al. (2002) Sánchez Contreras, C., Desmurs, J. F., Bujarrabal, V., Alcolea, J., & Colomer, F. 2002, A&A, 385, L1
- Schuller & Menten (2011) Schuller, F., & Menten, K. M. 2011, Private communication
- Schuster et al. (2006) Schuster, M. T., Humphreys, R. M., & Marengo, M. 2006, AJ, 131, 603
- Schwarzschild (1975) Schwarzschild, M. 1975, ApJ, 195, 137
- Shibata et al. (2004) Shibata, K. M., et al. 2004, PASJ, 56, 475
- Shinnaga et al. (2004) Shinnaga, H., Moran, J. M., Young, K. H., & Ho, P. T. P. 2004, ApJ, 616, L47
- Smith et al. (2001) Smith, N., Humphreys, R. M., Davidson, K., Gehrz, R. D., Schuster, M. T., & Krautter, J. 2001, AJ, 121, 1111
- Soker & Clayton (1999) Soker, N., & Clayton, G. C. 1999, MNRAS, 307, 993
- van Leeuwen (2007) van Leeuwen, F. 2007, A&A, 474, 653
- Yi et al. (2005) Yi, J., Booth, R. S., Conway, J. E., & Diamond, P. J. 2005, A&A, 432, 531