Deep spectroscopy of the emission-line populations in NGC 185 ††thanks: Based on observations obtained at the Gemini Observatory, which is operated by the Association of Universities for Research in Astronomy, Inc., under a cooperative agreement with the NSF on behalf of the Gemini partnership.
Abstract
Dwarf galaxies are crucial to understand the formation and evolution of galaxies, since they constitute the most abundant galaxy population. Abundance ratios and their variations due to star formation are key constraints to chemical evolution models. The determination of these abundances in the dwarf galaxies of the Local Universe is thus of extreme importance. However, these objects are intrinsically faint and observational constraints to their evolution can be obtained only for very nearby galaxies. NGC 185 is one of the four brightest dwarf companions of M31, but unlike than the other three, NGC 147, NGC 205, and NGC 221 (M32) it has an important content of gas and dust. We obtained deep spectroscopic observations of the H emitting population of NGC 185 using GMOS-N at Gemini. As a result, in addition to the bright planetary nebulae (PNe) previously found in the galaxy and reported in the literature, we found other, much fainter, PNe. We then re-calculated the electron temperatures and chemical abundances of the brightest ones, and derived, for the first time, their electron densities. Our characterisation of the PN population properties is interpreted in terms of the chemical evolution of NGC 185, which suggests that it has suffered a significant chemical enrichment within the last 8 Gyr. We also discovered the first symbiotic star in the galaxy and enlightened the properties of a known supernova remnant located close to the centre of NGC 185.
keywords:
Galaxies: abundances - evolution - Local Group - Individual (NGC 185); ISM: planetary nebulae - supernova remnants; STARS: binaries: symbiotic.1 Introduction
Dwarf galaxies are currently the most abundant galaxy population and were probably even more abundant during the first epochs of the Universe. Thus, they are crucial to the understanding of galaxy formation and evolution. Elemental abundance ratios and their variation within galaxy lifetime due to star formation are among the most important constraints to chemical evolution models (e.g., Mollá, Ferrini & Díaz 1996). Because of that, optical spectroscopy of emission-line gas in galaxies is essential to understand their chemical evolution history.
Local Universe dwarf galaxies are an ideal environment for studying these aspects. However, owing to their intrinsic faintness, observational constraints to their evolution, such as the chemical abundances of stellar populations of different ages, can be obtained only for very nearby galaxies in the Local Group (LG).
This paper is part of an ongoing project aimed at deriving the chemical abundances of a significant sample of LG galaxies using emission-line objects, like planetary nebulae (PNe), which are present from early- to late-type galaxies. Similar analysis were already published by Richer & McCall (1995), Stasińska, Richer & McCall (1998), Magrini et al. (2005), Gonçalves et al. (2007), Peña, Stasińska & Richer (2007), Richer & McCall (2008) and Magrini & Gonçalves (2009).
NGC 185, together with NGC 205, NGC 147, and NGC 221, is one of the brightest dwarf companions of M31. It is similar to NGC 147 in terms of mass and luminosity, but its content of gas and dust is much more significant. Using a four-colour photometry to analyse the stellar content of NGC 185, Nowotny et al. (2003) concluded that its metallicity is [Fe/H]. Following the arguments of Nowotny et al. (2003) and Mateo (1998), while NGC 147 and NGC 185 are very similar in terms of their stellar content, star formation history and absolute luminosity, their metallicities are different. From the PN photometry, (Corradi et. al., 2005) found that the PNe in NGC 185 are systematically brighter than those in NGC 147. In their detailed photometric study of NGC 185, Martínez-Delgado, Aparicio & Gallart (1999) found a significant star formation, in the inner region, during the last few Gyr (see also Battinelli & Demers 2004). This is specifically so within an elliptical isophote of semi-major axis of 240 arcsec, where all the 5 brightest PNe of NGC 185 are located. Prior to the present work, these 5 bright PNe were spectroscopically studied by Richer & McCall (1995, 2008). From the PN photometry, Corradi et. al. (2005) suggested that the brighter PNe in the inner regions of NGC 185 might be the product of stars formed in the last few Gyr, while the absence of such bright PNe in NGC 147 would be the consequence of the absence of such relatively young stellar population.
Our deep spectroscopic observations of NGC 185 were aimed at studying its fainter PN population and its diffuse interstellar medium (ISM, also discussed by Gallagher, Hunter & Mould 1984; Martínez-Delgado et al. 1999 and Corradi et. al. 2005) in the regions where the star formation is probably still active. It turns out that we actually can summarise our study as follows: i) we detected three new faint PNe in NGC 185, ii) we discovered the first symbiotic star of the galaxy, and iii) we described for the first time the properties of the supernova remnant (Gallagher et al., 1984), associated with the arc-like diffuse nebula, and located at the centre of this galaxy. Section 2 describes the observations and reduction process. In Section 3 we present and interpret our spectroscopic results, in terms of PN extinction, densities, temperatures and chemical abundances, also including abundance patterns and the NGC 185 chemical evolution suggested by its PN population. The characteristics of the supernova remnant and its possible relation with the ongoing star formation at the centre of NGC 185 is discussed in Section 4. We report the discovery of the first symbiotic system of NGC 185 and its planetary nebula luminosity function in Sections 5 and 6, respectively. Section 7 summarises the main results.

2 Gemini data acquisition and reduction
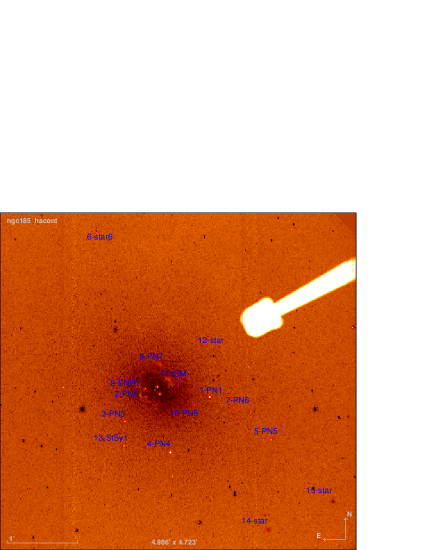
GMOS-N pre-imaging of a field of view of 5.5′ 5.5′ in the central region of NGC 185 were taken, on August 09, 2008, in order to identify PNe and other emission-line objects for our multi-object spectroscopy. Two filters were used. H, HaG0310, whose central and width are 655 nm and 7 nm, respectively. The other is a H-continuum filter, HaCG0311, whose central is located at the continuum adjacent to H (=662 nm and width of 7 nm). We obtained 3 exposures of 150 s for each filter. The two narrow-band frames were then used to build a H continuum-subtracted image, from which we re-identified the 5 brightest PNe (Richer & McCall 1995, Corradi et. al. 2005, Richer & McCall 2008) together with other, much fainter, compact and diffuse emission-line objects. We selected a total of 15 objects for spectroscopy, including the previously known PNe and new emission-line objects. We thus had: 8 PN candidates; the central part of a supernova remnant (SNR); a diffuse object that is part of the arc-like central nebula, described as ISM emitting in H by Martínez-Delgado et al. (1999) and by Corradi et. al. (2005); a symbiotic system; and 4 stars. Figure 1 (top panel) shows the 5.5 arcmin2 GMOS field of view (f.o.v.) superposed to the 11 arcmin2 DSS image of NGC 185. The 15 objects we studied spectroscopically are shown in Figure 1 (bottom panel).
| # - ID | RA | Dec | Ref |
| J2000.0 | |||
| 1 - PN1 | 00:38:53.128 | 48:20:07.66 | well known |
| 2 - PN2 | 00:38:57.309 | 48:20:10.06 | well known |
| 3 - PN3 | 00:39:00.263 | 48:19:47.02 | well known |
| 4 - PN4 | 00:38:56.431 | 48:19:21.17 | well known |
| 5 - PN5 | 00:38:47.961 | 48:19:31.66 | well known |
| 6 - star | 00:39:02.736 | 48:22:23.52 | this work |
| 7 - PN6 | 00:38:51.087 | 48:19:58.29 | this work |
| 8 - PN7 | 00:38:57.301 | 48:20:35.04 | this work |
| 9 - SNR-1 | 00:38:57.528 | 48:20:16.12 | Gallagher et al. (1984) |
| 10 - PN8 | 00:38:54.395 | 48:20:00.89 | this work |
| 11 - ISM | 00:38:56.556 | 48:20:22.27 | known |
| 12 - star | 00:38:53.426 | 48:20:52.85 | this work |
| 13 - SySt-1 | 00:39:00.364 | 48:19:26.57 | this work |
| 14 - star | 00:38:48.209 | 48:18:16.02 | this work |
| 15 - star | 00:38:42.754 | 48:18:40.02 | this work |
| “Well known” PNe were studied by Ford, Jenner, & Epps (1973), | |||
| Ford, Jacoby, & Jenner (1977), Ciardullo & Jacoby (1992), | |||
| Richer & McCall (1995), Corradi et. al. (2005), and Richer & MaCall | |||
| 2008. The “known” ISM is quoted in Gallagher et al. (1984), | |||
| Martínez-Delgado et al. (1999) and Corradi et. al. (2005). | |||
Our spectroscopic study confirmed all the 8 PN candidates as true PNe. Out of these 8, 5 PNe were previously observed (Richer & McCall 1995; Corradi et. al. 2005; Richer & McCall 2008). Identifications and equatorial coordinates of the emission-line objects included in the mask are shown in Table 1. ID numbers for the PNe in Table 1 were assigned starting from the last number of the previous list of PNe in NGC 185 (Corradi et. al., 2005).
Spectra of the NGC 185 emission-line objects were obtained in queue mode with GMOS-N, through two different gratings: R400+G5305 (‘red’) and B600 (‘blue’). The effective ‘blue’ plus ‘red’ spectral coverage was generally from 3700 Å to 9600 Å, allowing a displacement of about 200 Å. The blue spectra were taken on 28 of July, 2009, with 3 exposures of 900s each. The red spectra were observed on July 29, 2009, with 31060s exposures.
In order to avoid the possibility of having important emission-lines falling in the gap between the 3 CCDs of GMOS-N, the central wavelength of the disperser was varied from one exposure to another. So R400+G5305 was centred at 750 nm, and for B600 we adopted 460 nm.
Regarding the spatial coverage, the slit width was always 1′′, while the slit heights varied from 5′′ to 10′′. Spatial pixels were binned. The spatial scale and reciprocal dispersions of the spectra were as follows: 0144 and 0.045 nm per binned pixel, in ‘blue’; and 0144 and 0.0673 nm per binned pixel, in ‘red’. For the three exposures, seeing varied from 0.46′′ to 0.64′′ for the R400 spectra, and from 0.55′′ to 0.69′′ in the case of the B600 grating. CuAr lamp exposures were obtained with both gratings (in the case of B600 on April 02, 2010) for wavelength calibration.
We performed spectrophotometric standards (Massey et al. 1988; Massey & Gronwall 1990) exposures, with the same instrumental setups as for science exposures. BD+284211 was observed on 2009 July 28 and G191B2B on August 09, for the blue and red gratings, respectively. These frames were used to flux calibrate the spectra.
Data were reduced and calibrated in the standard way by using the Gemini gmos data reduction script and long-slit tasks, both being part of IRAF111IRAF is distributed by the National Optical Astronomy Observatory, which is operated by the Association of Universities for Research in Astronomy (AURA) under cooperative agreement with the National Science Foundation. .
Although the observations were carried out at relatively low airmasses, the slits were not aligned exactly to the parallactic angle. For both gratings, B600 and R400, the mean difference between the parallactic angle and the position angle of the slits was 45∘. The mean airmasses were 1.20 during the observations with B600 and 1.25 with R400. This implies that, given our 1′′ wide slits and the seeing of 0.7′′, some amount of light is lost, especially in the blue end of the spectra, due to differential atmospheric refraction. In order to estimate the light-losses for point-like sources, we calculated the displacement of the centroid of an object, as a function of wavelength, from the midpoint of the slit (along the direction perpendicular to its length) using the figures in Filippenko (1982), and as described by Magrini et al. (2005). In doing so, we considered that sources are well centred at H, the wavelength at which preimaging images were taken to identify objects for spectroscopy. We then calculated the amount of light lost (relative to that at H) assuming a Gaussian point-spread function with a FWHM which is the seeing of the observing run. As expected, the differential light-losses are negligible in the red side of the spectra, but they become as large as 30% at the shorter wavelengths we consider, i.e. H at 4100Å. At [O iii]5007 they become as small as 7%, and thus they do not compromise the determination of the [O iii] magnitude used to build the PNLF, described in Section 6. In addition, as discussed in Magrini et al. (2005), the possible light losses in the bluest part of the spectra will not affect significantly our chemical analysis (Section 3.2), since: i) they are in part compensated by the extinction correction; and ii) they affect mostly the part the spectrum not used for the determination of the chemical and physical properties of the nebulae.
| # - Id | c(H) | Ion | (Å) | Fλ | Fλ | Iλ |
|---|---|---|---|---|---|---|
| 1 - PN1 | 0.360.03 | HI | 4100 | 74.65 | * | 87.44 |
| (PN2 RM08) | HI | 4340 | 73.97 | * | 82.44 | |
| [OIII] | 4363 | 8.76 | 14% | 9.72 | ||
| HeII | 4686 | 0.64 | 32% | 0.67 | ||
| HI | 4861 | 100.0 | 6% | 100.0 | ||
| [OIII] | 4959 | 261.64 | 6% | 256.41 | ||
| [OIII] | 5007 | 653.42 | 5% | 634.00 | ||
| HeI | 5876 | 13.76 | 14% | 11.56 | ||
| [OI] | 6300 | 3.34 | 20% | 2.67 | ||
| [SIII] | 6312 | 1.32 | 20% | 1.329 | ||
| [OI] | 6363 | 1.03 | 20% | 1.301 | ||
| [NII] | 6548 | 13.63 | 14% | 10.58 | ||
| HI | 6563 | 367.8 | 5% | 285.0 | ||
| [NII] | 6584 | 41.78 | 8% | 32.30 | ||
| HeI | 6678 | 4.55 | 20% | 3.48 | ||
| [SII] | 6717 | 1.84 | 24% | 1.40 | ||
| [SII] | 6731 | 3.81 | 20% | 2.89 | ||
| HeI | 7065 | 10.13 | 14% | 7.40 | ||
| [ArIII] | 7135 | 16.84 | 14% | 12.2 | ||
| [OII] | 7320 | 9.72 | 14% | 6.89 | ||
| [OII] | 7330 | 7.53 | 14% | 5.33 | ||
| [ArIII] | 7751 | 4.17 | 19% | 2.81 | ||
| [SIII] | 9069 | 11.71 | 14% | 6.76 | ||
| FHβ=1.46 | ||||||
| 2 - PN2 | -0.060.055 | [OII] | 3727 | 73 | * | 73 |
| (PN5 RM08) | HI | 4100 | 27.89 | * | 27.89 | |
| HI | 4340 | 66.69 | * | 66.69 | ||
| [OIII] | 4363 | 27.79 | 10% | 27.79 | ||
| HeI | 4471 | 5.21 | 20% | 5.21 | ||
| HeII | 4686 | 15.22 | 14% | 15.22 | ||
| HI | 4861 | 100.0 | 7% | 100.0 | ||
| [OIII] | 4959 | 329.3 | 6% | 329.3 | ||
| [OIII] | 5007 | 907.3 | 5% | 907.3 | ||
| HeI | 5876 | 4.46 | 23% | 4.46 | ||
| [NII] | 6548 | 3.01 | 25% | 3.01 | ||
| HI | 6563 | 272.4 | 6% | 272.4 | ||
| [NII] | 6584 | 8.70 | 15% | 8.70 | ||
| HeI | 7065 | 3.07 | 25% | 3.07 | ||
| [SIII] | 9069 | 1.36 | 28% | 1.36 | ||
| FHβ=1.09 | ||||||
| 3 - PN3 | -0.060.06 | HI | 4100 | 64.76 | * | 64.76 |
| (PN3 RM08) | HI | 4340 | 56.68 | * | 56.68 | |
| [OIII] | 4363 | 23.95 | 14% | 23.95 | ||
| HeII | 4686 | 44.98 | 10% | 44.98 | ||
| HI | 4861 | 100.0 | 8% | 100.0 | ||
| [OIII] | 4959 | 479.1 | 6% | 479.1 | ||
| [OIII] | 5007 | 1420. | 5% | 1420. | ||
| HeI | 5876 | 5.93 | 23% | 5.93 | ||
| [OI] | 6300 | 10.16 | 18% | 10.16 | ||
| [SIII] | 6312 | 3.84 | 20% | 3.84 | ||
| [OI] | 6363 | 3.06 | 28% | 3.06 | ||
| [NII] | 6548 | 33.84 | 13% | 33.84 | ||
| HI | 6563 | 272.98 | 6% | 272.98 | ||
| [NII] | 6584 | 104.5 | 8% | 104.5 | ||
| HeI | 6678 | 3.56 | 26% | 3.56 | ||
| [SII] | 6717 | 6.54 | 23% | 6.54 | ||
| [SII] | 6731 | 11.78 | 17% | 11.78 | ||
| HeI | 7065 | 4.86 | 25% | 4.86 | ||
| [ArIII] | 7135 | 22.56 | 14% | 22.56 | ||
| [OII] | 7320 | 15.04 | 14% | 15.04 | ||
| [OII] | 7330 | 11.75 | 17% | 11.75 | ||
| [ArIII] | 7751 | 7.08 | 23% | 7.08 | ||
| [SIII] | 9069 | 32.59 | 13% | 32.59 | ||
| FHβ=7.18 | ||||||
| 4 - PN4 | 0.200.015 | HI | 4100 | 67.56 | 6% | 73.62 |
| (PN1 RM08) | HI | 4340 | 48.34 | 6% | 51.28 | |
| [OIII] | 4363 | 30.03 | 6% | 31.76 | ||
| HeI | 4471 | 10.51 | 10% | 10.98 | ||
| HeII | 4686 | 13.75 | 9% | 14.02 | ||
| HI | 4861 | 100.0 | 6% | 100.0 | ||
| [OIII] | 4959 | 342.3 | 5% | 338.6 | ||
| [OIII] | 5007 | 1075. | 5% | 1057. | ||
| # - Id | c(H) | Ion | (Å) | Fλ | Fλ | Iλ |
|---|---|---|---|---|---|---|
| 4 - PN4 | 0.200.015 | HeI | 5876 | 15.52 | 9% | 14.12 |
| (PN1 RM08) | [OI] | 6300 | 4.17 | 14% | 3.69 | |
| [SIII] | 6312 | 1.60 | 20% | 1.81 | ||
| [OI] | 6363 | 1.42 | 23% | 1.25 | ||
| [NII] | 6548 | 8.61 | 12% | 7.51 | ||
| HI | 6563 | 327.3 | 5% | 285.0 | ||
| [NII] | 6584 | 26.03 | 8% | 22.64 | ||
| HeI | 6678 | 3.93 | 14% | 3.40 | ||
| [SII] | 6717 | 1.42 | 23% | 1.22 | ||
| [SII] | 6731 | 1.79 | 20% | 1.54 | ||
| HeI | 7065 | 14.41 | 9% | 12.15 | ||
| [ArIII] | 7135 | 8.28 | 13% | 6.95 | ||
| [OII] | 7320 | 5.22 | 14% | 4.33 | ||
| [OII] | 7330 | 4.92 | 14% | 4.08 | ||
| [ArIII] | 7751 | 2.00 | 19% | 1.61 | ||
| [SIII] | 9069 | 8.55 | 13% | 6.35 | ||
| FHβ=3.33 | ||||||
| 5 - PN5 | 0.870.013 | HeII | 4686.0 | 18.11 | 25% | 19.76 |
| (PN4 RM08) | HI | 4861.0 | 100.00 | 14% | 100.04 | |
| [OIII] | 4959.0 | 655.91 | 6% | 625.06 | ||
| [OIII] | 5007.0 | 1919. | 6% | 1786.0 | ||
| HeI | 5876.0 | 14.247 | 25% | 9.40 | ||
| HI | 6563.0 | 523.65 | 7% | 285.12 | ||
| FHβ=1.86 | ||||||
| 7 - PN6 | 0.050.12 | HI | 4340 | 27.44 | * | 27.87 |
| HI | 4861 | 100.0 | 20% | 100.0 | ||
| [NII] | 6548 | 34.61 | 25% | 33.40 | ||
| HI | 6563 | 295.4 | 14% | 285.0 | ||
| [NII] | 6584 | 59.09 | 23% | 56.98 | ||
| FHβ=5.72 | ||||||
| 8 - PN7 | 0.460.05 | HI | 4861 | 100.0 | 10% | 100.0 |
| [OIII] | 4959 | 862.0 | 6% | 884.0 | ||
| [OIII] | 5007 | 2810. | 5% | 2625. | ||
| HI | 6563 | 394.5 | 6% | 285.0 | ||
| FHβ=3.46 | ||||||
| 9 - SNR-1 | 0.470.13 | HI | 4340 | 77.16 | * | 88.74 |
| HI | 4861 | 100.0 | 24% | 100.0 | ||
| [NII] | 6548 | 50.28 | 25% | 31.28 | ||
| HI | 6563 | 395.9 | 14% | 285.0 | ||
| [NII] | 6584 | 119.6 | 24% | 93.33 | ||
| [SII] | 6717 | 115.6 | 24% | 81.31 | ||
| [SII] | 6731 | 100.5 | 24% | 70.59 | ||
| [SIII] | 9069 | 5.57 | 40% | 2.74 | ||
| FHβ=3.56 | ||||||
| 10 - PN8 | 0.900.22 | HI | 4861 | 100.0 | 20% | 100.0 |
| [OIII] | 4959 | 337.0 | 14% | 320.7 | ||
| [OIII] | 5007 | 1030. | 8% | 957.1 | ||
| [NII] | 6548 | 134.8 | 23% | 72.34 | ||
| HI | 6563 | 533.7 | 14% | 285.1 | ||
| [NII] | 6584 | 421.3 | 14% | 223.7 | ||
| [SII] | 6717 | 108.9 | 23% | 55.69 | ||
| [SII] | 6731 | 90.44 | 23% | 46.03 | ||
| FHβ=6.61 | ||||||
| 13 - SySt-1 | 0.590.09 | HI | 4340 | 88.88 | * | 106.0 |
| HeII | 4686 | 111.5 | 14% | 118.4 | ||
| HI | 4861 | 100.0 | 14% | 100.0 | ||
| HeI | 5876 | 29.35 | 20% | 22.10 | ||
| HI | 6563 | 431.4 | 7% | 285.0 | ||
| HeI | 6678 | 13.00 | 26% | 8.40 | ||
| Raman | 6830 | 37.0 | 10% | 23.3 | ||
| HeI | 7065 | 19.53 | 25% | 11.72 | ||
| FHβ=2.16 | ||||||
3 Spectroscopic Results
| Parameter | PN1 | PN2 | PN3 | PN4 |
| [O III](K) | 11900 | 18900 | 14100 | 19070 |
| [O III] - RM08 (K) | 9300 | 16400 | 15100 | 17200 |
| [S II] (cm-3) | 16500 | - | 6600 | 1800 |
| HeI/H | 0.073 | 0.076 | 0.053 | 0.098 |
| HeII/H | 0.001 | 0.016 | 0.049 | 0.015 |
| He/H | 0.074 | 0.092 | 0.102 | 0.113 |
| He/H - RM08 | 0.110 | 0.101 | 0.098 | 0.112 |
| OI/H | 1.040(-6) | - | 6.020(-7) | 2.590(-7) |
| OII/H | 2.866(-5) | 3.82(-6) | 3.584(-5) | 5.210(-6) |
| OIII/H | 1.343(-4) | 5.682(-5) | 1.760(-4) | 6.331(-5) |
| ICF(O) | 1.007 | 1.139 | 1.553 | 1.100 |
| O/H | 1.651(-4) | 6.906(-5) | 3.299(-4) | 7.569(-5) |
| 12+log(O/H) | 8.218 | 7.839 | 8.518 | 7.879 |
| 12+log(O/H) - RM08 | 8.52 | 7.92 | 8.39 | 7.93 |
| NII/H | 4.808(-6) | 4.493(-7) | 9.715(-6) | 1.153(-6) |
| ICF(N) | 5.763 | 18.08 | 9.205 | 14.527 |
| N/H | 2.771(-5) | 8.123(-6) | 8.942(-5) | 1.674(-5) |
| 12+log(N/H) | 7.443 | 6.909 | 7.951 | 7.224 |
| 12+log(N/H) - RM08 | 8.03 | 7.69 | 8.79 | 8.08 |
| ArIII/H | 7.600(-7) | - | 1.010(-6) | 1.910(-7) |
| ArIV/H | - | - | - | - |
| ICF(Ar) | 1.870 | - | 1.870 | 1.870 |
| Ar/H | 1.421(-6) | - | 1.889(-6) | 3.572(-7) |
| 12+log(Ar/H) | 6.153 | - | 6.276 | 5.553 |
| SII/H | 2.503(-7) | - | 4.329(-7) | 2.456(-8) |
| SIII/H | 2.286(-6) | - | 4.033(-6) | 3.387(-7) |
| ICF(S) | 1.319 | - | 1.508 | 1.732 |
| S/H | 3.319(-6) | - | 6.733(-6) | 6.289(-7) |
| 12+log(S/H) | 6.525 | - | 6.828 | 5.799 |
The emission-line fluxes given in Table 3 were measured with the package splot of IRAF. Errors on the fluxes were calculated taking into account the statistical error in the measurement of the fluxes, as well as systematic errors of the flux calibrations, background determination, and sky subtraction. Table 3 presents the object ID, the (with its error), the measured fluxes (F), the relative error on the measured fluxes and the extinction corrected flux (hereafter intensities, I).
| # - ID | He/H | O/H | N/H | Ar/H | S/H | ||
|---|---|---|---|---|---|---|---|
| K | cm-3 | dex | dex | dex | dex | dex | |
| PN1 | 700 | 300 | 0.01 | 0.07 | 0.05 | 0.07 | 0.08 |
| PN2 | 900 | - | 0.01 | 0.06 | 0.05 | - | - |
| PN3 | 850 | 500 | 0.01 | 0.08 | 0.06 | 0.07 | 0.08 |
| PN4 | 700 | 300 | 0.02 | 0.03 | 0.05 | 0.06 | 0.08 |
3.1 Extinction
The observed line fluxes were corrected for the effect of the interstellar extinction using the extinction law of Mathis (1990) with =3.1. We used as a measurement of the extinction, which is defined as the logarithmic difference between the observed and theoretical H fluxes. Since H and H are only available in few cases, and are affected by larger uncertainties, was determined comparing the observed Balmer I(H)/I(H) ratio with its theoretical value, 2.85 (Osterbrock & Ferland, 2006).
As shown in Table 3, varies significantly from one PN to another, ranging from slightly negative values (-0.06; thus implying no correction to the originally measured fluxes) up to 0.90. Giving that we are mixing the brightest PNe of NGC 185 with the extremely faint ones, the relative errors of turn out to be important. Considering indistinctly all the objects in Table 3, =0.460.29 (being 0.29 the standard deviation). The extinction inferred for the PNe and the other emission line objects of NGC 185 (note that in Table 3, 8 entries actually correspond to PNe, the object number 13 is in fact a symbiotic star and entry number 9 is a SNR) compares nicely with the E(B-V) by Burstein & Heiles (1984) and Richer & McCall (1995), obtained from only two NGC 185 PNe. The latter authors also found very different values of E(B-V) for the two PNe, namely, 0.422 and 0.195, whose mean value converts to = 0.456 ( 0.168). The more recent work by Richer & McCall (2008) (hereafter RM08), based on new observations and using the 4m Canada-France-Hawaii Telescope instead of the Multiple Mirror Telescope used in the Richer & McCall (1995)’s paper, includes the 5 brightest PNe of NGC 185. Taking the average of the they derived for these PNe (by adopting the Fitzpatrick (1999) reddening law parametrised with a ratio of total-to-selective extinction of 3.041) we obtain 0.34 ( 0.07). If, accordingly, only the 5 PNe were considered in Table 3, we would get 0.29 ( 0.14).
3.2 Electron densities, temperatures, and chemical abundances
The extinction-corrected intensities were used to obtain the electron densities () and temperatures () of each PN for which the appropriated diagnostic line ratios were available. Plasma diagnostics were calculated using the 5-level atom model included in the nebular analysis package in iraf/stsdas (Shaw & Dufour, 1994). For the electron densities we used the doublet of the sulphur lines [S ii]6716,6731, while the electron temperatures were derived from the ratio [O iii]4363/(5007+4959). The [O iii] line ratio gives the medium-excitation temperatures (Osterbrock & Ferland 2006, 5.2), and, since we were not able to measure the [N ii]5755Å emission line with good S/N, we adopted [O iii] for deriving the abundances of all the ionic species in Table 4. The diagnostics explained above were derived only for the 4 brightest PNe of the sample.
We were able to obtain the for 3 of the brightest PNe. It is important to realise that this is the first time that is estimated for these PNe. RM08 assumed a value of 2000 as the density for the 5 PNe they analysed, since they were not able to calculate it. The first rows of Table 4 show the electron temperatures and densities we derived. We also detected [S ii]6716,6731 for PN8, which allowed us to determine its density, 240 .
It is worth mentioning that PN8 has an electron density almost two orders of magnitude lower than those of the brightest PNe which are PN1, PN3 and PN4 (see Table 4).
The corresponding for PN1, PN3 and PN4, are respectively 16500, 6600 and 1800 (in log scale: 4.21, 3.82 and 3.25). PN1’s density is higher than the typical values for PNe, while the other two have values commonly found in Galactic samples of PNe. Values around log()4 are found only in a few of the 146 planetary nebulae analysed by Stanghellini & Kaler (1989). Similar and higher densities are found in symbiotic stars (Pereira et al. 1998; Schmid & Schild 1990; Gutiérrez-Moreno & Moreno 1996) and in young planetary nebulae like Hen 2-57 (Kingsburgh & Barlow, 1994), Hen 2-35 (Corradi, 1995), IC 4997 (Hyung, Aller & Feibelman, 1994) and K 4-47 (Gonçalves et al., 2004).
Concerning the the difference of the present results and those of RM08 highlights the key role of the electron temperature on the determination of abundances based on collisionally excited lines (Stasińska 2002a, Stasińska 2002b), as we proceed to discuss below. In order to make the comparison between the results of RM08 and ours easier, we added their results (for , He/H, 12+log(O/H) and 12+log(N/H)) in Table 4.
In the present work the abundances of the PNe were obtained following the prescription already used in other studies (see, for instance, Magrini & Gonçalves 2009). The abundances of all elements except helium were calculated with the ionization correction factors (ICFs) given in Kingsburgh & Barlow (1994) for the case where only optical lines are detected. Helium abundances were calculated following Benjamin, Skillman & Smits (1999) in the two density regimes they discuss in their paper. The formal errors in the ionic and total abundances were computed taking into account the uncertainties of the observed fluxes and in the and as well as that of the . Errors were formally propagated and are given in Table 4.
Comparing our temperature values with those from RM08, we notice see that there is a difference between them that goes up to 2600 K. The errors in both determinations (see Table 4) are not enough to justify this discrepancy. Note that in our table we do not include the PN5 for which only an upper limit to the [O iii]4363Åline was obtained, implying a lower limit to its (i.e [O iii]12600 K). As discussed in RM08 a lower limit for the electron temperature will underestimate the abundances of the collisionally excited lines, implying lower limits to O/H, N/H, S/H and Ar/H. Because of that, we will not discuss the results for PN5 any longer.
We can further compare the results in Table 4 with the ones from RM08. The values obtained for He/H and 12+log(O/H) are similar in both studies. The exception is PN1, which is also the PN for which the [O iii] is higher by 2600 K in our work. On the other hand, N is really different in the two works. In both studies N/H abundances are based on the same ICF scheme (Kingsburgh & Barlow, 1994). In the case of nitrogen the ICF is (O/H)/(O+/H), implying that N/H=ICF(N+/H). However, their O+/H was obtained from the [O ii]3727Å emission line, while ours comes from another [O ii] line, 7325Å. O+/H based on the [O ii]3727 line was preferred in the analysis of RM08, because the flux of both [O ii] lines was measured only for PN1. On the other hand, we only measured a lower limit flux for [O ii]3727 of PN2, so we based our O+/H on the emission of the 7325Å. In fact no lines with reasonable uncertainties at wavelengths lower than 4300Å were obtained from our spectra of all the other PNe. Checking Table 5 of RM08 it is possible to see that for their PN1 the O+/H was derived from both [O ii] lines. We note that [O ii]3727Å returns O+/H about 6 times lower than that obtained from [O ii]7325Å! Therefore, our O+/H are higher than theirs by similar factors, which implies in nitrogen ICFs which are 6 times lower, resulting in significantly lower nitrogen abundances. A possible reason for this effect is explained below.
The [N ii] nebular lines may be excited by recombination as well as by collisions (Rubin 1986, Péquignot et al. 1991). In standard nebular abundance analyses, the N+/H and O+/H ratios are derived from intensities of the [N ii] 6548,6584 and [O ii]3726,3729 nebular lines respectively, assuming the electron temperature deduced from the [N ii] nebular to auroral line ratio (I6548+I6584)/I5754 for both ions. The recombination excitation of the 5754 leads to overestimated [N ii] temperature and the N+/H abundance can be significantly underestimated for some nebulae, in particular for those of relatively high excitation classes where more N is in the doubly ionised stage (Liu et al. 2000, Tsamis et al. 2003). The temperatures derived from the ratios that involve the auroral lines [N ii]5754 and in particular the [O ii]7320,7330 are significantly more affected than those derived from the [O iii]4363 line. In our study only the latter is being used to obtain electron temperatures. The effects of recombination excitation on the O+/H abundances derived from the [O ii]3726,3729 lines are more complicated. Liu et al. (2000) and Tsamis et al. (2003) show that while correcting for recombination excitation of the [N ii]5754 line will increase the O+/H abundance derived from the [O ii]3726,3729 lines owing to a lower [N ii] temperature, the enhancement is offset or even diminished after correcting for the recombination excitation contribution of the [O ii]3726,3729, which have much larger effective (radiative plus dielectronic) recombination coefficients than the [N ii]6548,6584 lines. The net effect of recombination excitation on the N+/H and O+/H abundance ratios depends on the actual electron temperature, N+2/H and O+2/H abundances.
The effect of recombination excitation on the intensity of [O ii]7320,7330 lines can be estimated using the equations given by Liu et al. (2000) and Tsamis et al. (2003). Although they are valid only in the range 104 K, we have used them to grossly estimate this contribution in the fluxes we observed for PN1, PN3 and PN4 (those whose [O ii]7320,7330 lines were measured with good S/N). For that we used eq. (3) of Tsamis et al. (2003), the observed intensities given in Table 3, and the [O iii] as well as O+2/H given in Table 4. The results show that the contribution of recombination is less than 1% in these three PNe, so no correction need to be applied to the intensities in order to obtain the O+/H abundances of the PNe we studied. As pointed out by Liu et al. (2000), the predicted intensity due to recombination excitation of the [O ii]3726,3729 lines is 7.5 times that of the [O ii]7320,7330 lines. Based on this fact we conclude that RM08 [O ii]3726,3729 observed intensities of PN1, PN3 and PN4 are slightly contaminated by recombination, by amounts of 6.2%, 6.5% and 7.4%, respectively. Either or not the excitation by recombination could be the responsible for the O+/H discrepancies found above it is hard to say, because all these effects depend on temperature and no adequated predictions are available for the range of of the PNe in NGC 185. It is important to realise that the total oxygen abundance is not affected by these issues, since O+/H is only a small fraction of total O/H.
Taking into account all that was discussed above, the consequences of the different N abundances on the chemical evolutionary stage of the PNe in NGC 185 remains to be explored. We do this through the analysis of these PN abundance trends.
3.3 Abundance patterns
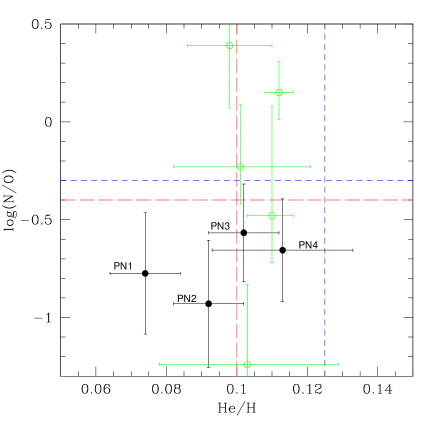
In Figure 2 we show the log(N/O) vs. He/H plot, to verify whether or not the PNe in our sample are significantly enriched in He and N, which is equivalent to identify if they are type I PNe or not, following the definition based on Galactic PNe by Peimbert & Torres-Peimbert (1983), Kingsburgh & Barlow (1994) and others. Type I PNe are nitrogen and helium-enriched, with progenitors having likely undergone the third dredge-up and hot bottom-burning, and thus are likely to have higher progenitor masses (Peimbert & Torres-Peimbert 1983; Marigo 2001). Following this criterion, type I PNe are located in this plot where He/H0.125 and log(N/O)-0.3 (short dashed lines) are defined for the Milky Way (see Perinotto, Morbidelli, & Scatarzi 2004. However, since the metallicity of NGC 185 is similar to that of the Small Magellanic Cloud (SMC), we also include in this plot the equivalent criterion, defined by Leisy & Dennefeld (2006) using a large number of SMC PNe (long dashed lines). The top right portion of the plot, regardless the criterion adopted, should be populated by the type I’s PNe of NGC 185. Clearly, there are no type I PNe among those we observed in NGC 185 (filled circles). Taking into account that RM08 N/H greatly differs from ours, two of the PNe in NGC 185 could be of type I, if the use of [O ii]3727 would be proved to give a better N/H measurement than [O ii]7325.
3.4 The chemical evolution of NGC 185
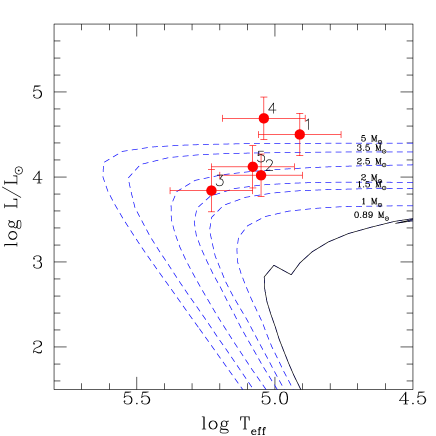
Based on our data it is possible to estimate the central star luminosity and effective temperature by assuming these PNe are optically thick. For the calculation of the Zanstra temperature we used the equation suggested by Kaler & Jacoby (1989) and applied by Kniazev et al. (2004) to extragalactic PNe. The total luminosities of the PN central stars were derived from the relation given in Gathier & Pottasch (1989) and Zijlstra & Pottasch (1998), using the H absolute fluxes, extinction and adopting the distance of 616 kpc to NGC 185. Masses were derived from the theoretical evolutionary tracks of Vassiliadis & Wood (1994) for Z=0.004 (1/5 Z). Ages were estimated using the evolutionary lifetimes of the various phases of the progenitor stars, from Vassiliadis & Wood (1993).
The locations of the central stars and the available H- and He-burning evolutionary tracks for Z=0.004 are shown in Fig. 3. From the loci of the central stars in the Hertzsprung-Russell diagram, we estimated the main sequence star masses, which range from 2 to 5 M. Stars with these main-sequence masses and with an initial metallicity of Z=0.004 were born from 0.2 to 1.8 Gyr ago (Charbonnel et al. 1999), thus representing an young to intermediate-age population.
However, we would remind the model dependence of this age determination, which is strictly related to the theoretical evolutionary tracks, to the assumption of the mass-loss during the stellar evolution, and to the metallicity dependency of these processes, which are, to date, still poorly known.
Following the approach of RM08, we could use the chemical abundances observed in bright PNe to constrain the masses of their stellar progenitors.
Taking into account the He and O abundances, and also the N/O ratio, we estimated that the masses of the four brightest PNe of NGC 185 should be lower than the corresponding masses derived from their luminosity and effective temperature, with initial masses of about 1.5M⊙ or less, as given by the current theoretical models (e.g., Marigo 2001; Herwig 2005; Karakas & Lattanzio 2007). Moreover, the assumptions adopted concerning convective overshooting, at the lower boundaries of both the convective envelope and the pulse-driven convective zone during a thermal pulse, are still quite uncertain and the behaviour of the overshooting and of the dredge-up at different metallicities is still matter of debate. In the following we maintain the age determination from luminosity considerations, keeping in mind the uncertainties related to this approach.
To study the chemical evolution of NGC 185, we have collected the literature information about stellar population ages and metallicities, with the aim of obtaining the history of its metal enrichment, as shown in Table 5. Adding the abundances obtained from the PN population to Table 5 is not a straightforward task, since we would need to translate the elemental abundances shown in Table 4 in [Fe/H]222Brackets indicate that the metallicity is given with respect to the Solar metallicity., and then compare these values with the metallicity measured in the stars of this galaxy. Given the fact that they are not type I nebulae, the PNe of NGC 185 should not have enhanced their original O abundances (as it is known to happen in a few low metallicity dwarf galaxies containing massive type I PNe; Peña et al. 2007 and Magrini & Gonçalves 2009). We can then use O/H as the characteristic metallicity of the NGC 185 PN progenitors (like we did in the case of NGC 147; Gonçalves et al. 2007), born some 0.2 to 1.8 Gyr ago. In principle, O/H can be converted into [Fe/H] using the following relation: [Fe/H]PNe = [O/H]PNe - 0.37 obtained by Mateo (1998), even though this relation is useful for comparing samples of galaxies, but less valid considering galaxies individually. On a statistical sense, this transformation has an uncertainty of 0.06 dex (Mateo, 1998). Keeping in mind this strong limitation, the mean value for O/H that we obtain from the PN1-4 in NGC 185 (1.6010-4 or 8.200.3) gives [Fe/H]PNe = -0.83 0.32 (O/Hsolar = 8.66; Asplund 2003). Thus, [Fe/H]PNe is close to the value obtained for RGB stars and higher than that of the much older stars studied by Butler & Martínez-Delgado (2005). All the other references quoted in Table 5 refer to populations dominated by the old stars of NGC 185. Therefore, the metallicity given by the PN population suggests a significant (at least 0.2-0.3 dex) overall chemical enrichment within the last 8 Gyr of the NGC 185 evolution.
Another important quantity that can give information about the chemical evolution and star formation history of NGC 185 is its [O/Fe]. Ultimately, this ratio measures the rate at which gas is turned into stars. The [O/Fe] in NGC 185 is about 0.8 dex, if we consider the oldest stellar population for which we have a measurement of [Fe/H], and about 0.4 dex, if we consider the RGB stars (see Table 5). A positive [O/Fe] implies that the contribution of type II supernovae is higher than that of type Ia. Type II SNe enrich light elements and also iron, while type Ia SNe provide almost all Fe, and have longer timescales. The consumption of the same fraction of gas over a longer time produces a lower [O/Fe], since type Ia SNe have time to release their by-products. This means that in the case of NGC 185 most of the gas from which stars were formed was consumed within a short time scale, and the following star forming episodes were less important. This result we find for NGC 185 is in agreement with Richer & McCall (1995) and confirms that dwarf ellipticals, as NGC 185, have higher [O/Fe] than irregular galaxies. The explanation for such higher [O/Fe] might be that dwarf ellipticals consume their gas more rapidly than dwarf irregulars.
Only a proper chemical evolution model can go further in the details of the chemical enrichment of the galaxy (Martins et al., 2011), but the fact that the previously determined oxygen abundances for the PNe of NGC 185 (RM08) and ours agree nicely, makes us confident about the above outlined chemical trend.
The chemical history of NGC 185 can also be compared with that of its twin galaxy, NGC147, another dwarf satellite of M31. As discussed in the introduction, Mateo (1998) and others expected that the metallicities of NGC 147 and NGC 185 would be different. This is the case when the photometry of these galaxies is concerned. A similar difference is also observed in the PN populations: we find in NGC 147 (Gonçalves et al., 2007) and in NGC 185 (this work and RM08). Note that differently than NGC 147, which had a negligible enrichment for a long period of time (Gonçalves et al., 2007), NGC 185 did suffer a metallicity enhancement within the last 8 Gyr, as indicated by its higher O/H, discussed earlier in this section. If not meaning anything else, this is at least in line with the results of Martínez-Delgado et al. (1999) who found a significant star formation at the central region of NGC 185 in the last few Gyr, and, all the PNe for which chemical abundances are available, are located in this central region. Moreover, the chemical evolution model that was performed for NGC 185, using the PN chemistry as given in this paper as a key constraint (Martins et al. 2011, MNRAS submitted) shows that the galaxy had a burst of SF about 8Gyr ago, and after that a long quiescent period followed by the more recent star formation episode.
4 A SNR close to the centre of NGC 185
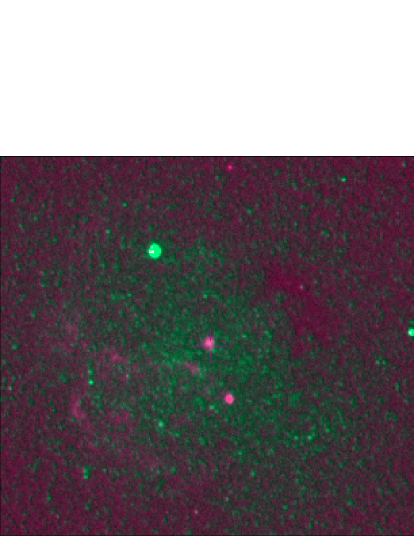
In the H continuum subtracted image, close to the centre of NGC 185 at RA=00:38:57.528 and DEC=48:20:16.12, we detected a resolved emission-line object with a fwhm=0.7′′(2 pc at the distance of NGC 185). The fwhm of this object is approximately two times broader than the point spread function, PSF=0.35′′. This object probably corresponds to the one discovered by Gallagher et al. (1984), for which they measured [S ii]/H=1.20.3 and thus concluded that, possibly, it was a supernova remnant (SNR). It has not been detected in the VLA radio search by Dickel, Silverman, & D’Odorico (1985) neither in the ROSAT HRI X-ray observations by Brandt et al. (1997), suggesting it is an old SNR (Mateo, 1998). Martínez-Delgado et al. (1999) obtained an H image of NGC 185 identifying an arc-like morphology around the central core, and thus they suggested that it may be a portion of a larger, old remnant, with a diameter of 80 pc. The central core and the arc-like structure are shown in our H-continuum image in the bottom panel of Figure 4. We also detected (see Table 1, entry 11: ISM) a portion of the arc-like structure, whose spectrum only shows the Balmer lines, so we cannot characterise the faint diffuse arc-like nebula in more detail.
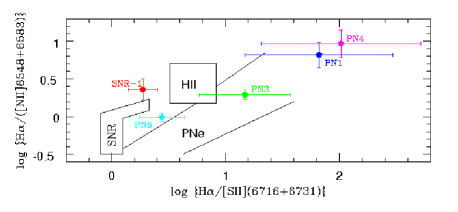
For the first time we have obtained a complete optical spectrum of the central part of the SNR, which is a bright source located approximately in the centre of the arc-like structure. The spectrum shows Balmer lines together with very strong [N ii] and [S ii] lines, but no [O iii] lines (see Table 2). The strong [N ii] and [S ii] lines indicate a shock-heated region. Blair & Long (2004) identified SNR candidates by using their observed [S ii]/H ratio: a dividing line at [S ii]/H=0.4 separates shock-heated (higher ratio) and photoionised (lower ratio) nebulae. In SNR-1 of NGC 185 this ratio is 0.53. The middle panel of Fig. 4 shows the original diagnostic diagram by Sabbadin, Minello & Bianchini (1977), based on Galactic samples of H ii regions, SNRs and PNe. Though NGC 185 has a different metallicity, this diagram can help us to show that the line ratios of SNR-1 are closer to the loci of the shock-excited nebulae than the other objects in our sample (middle panel of Fig. 4). The absence of [O iii] lines is a signature of low shock velocity variation, as shown by the models of Dopita, Binette & Tuohy (1984). When these variations reach values less than 85 km s-1, they do not produce any detectable [O iii] emission. Such low velocities point again to old SNRs. In addition, the lack of oxygen lines is an indication that this object was probably not produced by a core collapse supernova (see, e.g., Finkelstein et al. 2006 for an example of type II SNR) and thus does not require a high mass progenitor. This is in agreement with the results of Martínez-Delgado et al. (1999) who calculated the expected rate of different types of supernovae, concluding that the SNR observed in NGC 185 originates in a type Ia event. Finally, we derived SNR-1 electron density using the [S ii]6716/[S ii]6731 ratio and we obtained a quite low density of 300 cm-3.
4.1 Triggered star formation in NGC 185?
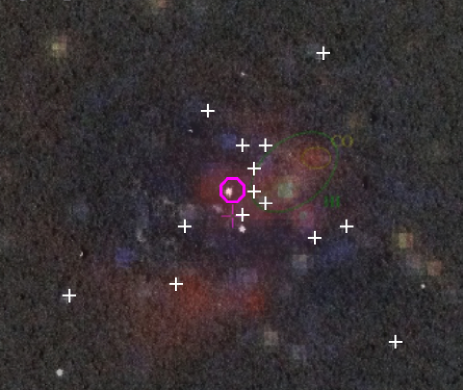
In Figure 5 we compare the location of SNR-1 with the IRAC images published by Marleau et al. (2010). From their images, especially the highest resolution image at 8 m, the diffuse dust emission from NGC 185 has a mixed morphology characterised by a shell-like emission region extending from the south to the east of the galaxy centre surrounding a zone of more concentrated emission. We consider that the mechanism responsible for such a morphology might be the supernova explosion. As described by Marleau et al. (2010) the emission peaks at the centre of a region of 30′′ in diameter ( 90 pc) where NGC 185 SNR-1 is located. The diffuse dust emission extends to a much larger distance, covering a region of approximately 450 pc. The interstellar medium, including atomic and molecular gas, is concentrated near the present-day star-forming region (CO, Welch, Mitchell,& Yi 1996; HI, Young 2001). Around the dust shell, recent star-forming activity has been detected with the presence of several young stars, the so-called “Baade’s blue stars” (Baade, 1951). In the following we discuss if there is any correlation between the star formation episode which generates the young blue stars and the supernova explosion.
Following Hodge (1963) the Baade’s stars are young OB stars, while according to the colour-magnitude diagram of Martínez-Delgado et al. (1999) these stars lie in a region where evolved stars of about 40-150 Myr are expected. Also Butler & Martínez-Delgado (2005) recognised them as evolved stars, with an associated faint main sequence population. They inferred an age for this population of 4108 yr.
Martínez-Delgado et al. (1999) estimated an age of 105 yr for the SNR-1 in NGC 185. Thus, if we consider that the Baade’s stars are more evolved stars, born 4108 yr ago, it seems there is no direct connexion between the supernova event and the most recent star formation episode in NGC 185. On the other hand, if they were really OB stars, they would be compatible with a star formation event triggered by the SN explosion. It is indeed very intriguing that the Baade’s stars are all located around the SNR! A spectroscopic study of the radial velocities and abundances of these stars is crucial to understand the recent (triggered?) star formation in NGC 185.
5 The first known symbiotic system in NGC 185
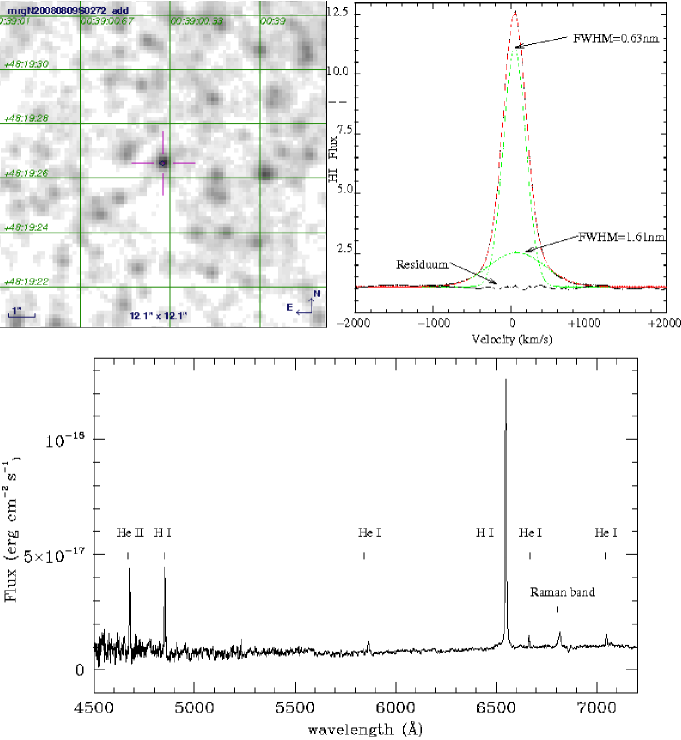
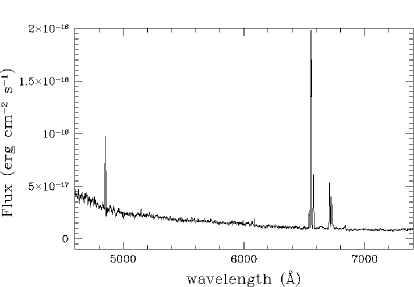
The spectroscopic analysis of one of the H line emitters in Table 1, object 13, shows that it is a symbiotic system, hereafter NGC 185 SySt-1, following Gonçalves et al. (2008) and Kniazev et al. (2009) naming pattern for extragalactic symbiotic systems. In Figure 6 we show its finding chart in the H image and its optical spectrum, which is clearly that of a symbiotic star, as one can see in the Munari & Zwitter (2002) atlas and in Fig.2 of Kniazev et al. (2009). In fact this newly discovered symbiotic star is extremely similar to that described by the latter authors, showing exactly the same H and He recombination lines pattern. NGC 185 SySt-1 presents strong emission lines of H I and He II (e.g. Belczyński et al. 2000) and a broad emission feature at 6830Å. Symbiotic stars are the only objects known to show this feature, in consequence of the Raman scattering of the O IV 1032, 1038 resonance lines by neutral hydrogen (Schmid, 1989). The collisional de-excitation, that also suggests very high electron densities for the gas surrounding the binary system, should be responsible for the absence of forbidden lines in the spectrum of NGC 185 SySt-1 (Mikolajewska, Acker & Stenholm, 1997). In fact, high electron densities (Gutiérrez-Moreno, Moreno & Cortés 1995; Proga et al. 1996) could also suggest a S-type symbiotic star classification for NGC 185 SySt-1.
Even though Balmer line ratios in many symbiotic nebulae indicate self-absorption effects (because of high densities), making the use of standard methods to estimate reddening not applicable, in the case NGC 185 SySt-1, we have determined an extinction coefficient (see Table 3) that is in rough agreement with that of the other photo-ionised nebulae of the galaxy, namely =0.590.09 (the mean value for the given in Table 3 is 0.460.29). Using the extinction corrected integrated flux of He ii4686, we derive a Teff of 82800 K as the temperature of the ionizing source (Kaler & Jacoby, 1989).
In Figure 6 we also plot the H profile of NGC 185 SySt-1. As in the case of NGC 6822 SySt-1 (Kniazev et al., 2009), we clearly see that a two-component Gaussian fit can account for the broad H emission. In this figure, it can be seen that the H line has extended low-intensity wings that mixes with the continuum level roughly at 1000 km s-1. Following Tomova & Tomov (1999) the observed asymmetry of the H profile is due to self-absorption. The velocity in the wings should be close to that of the mass centre of the system. In the case of NGC 185 SySt-1 the radial velocity of the wings is 30944 km s-1.
6 The PN Luminosity Function
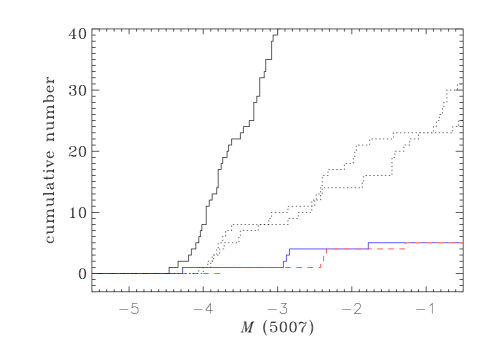
We could measure [O iii] 5007Å fluxes for 7 out of the 8 PNe listed in Table 2. One of them, PN6, is, indeed, a very low excitation PN, without any detectable [O iii] emission line. Since our sample is small we have chosen to build the cumulative PN luminosity function (PNLF) following the method described in Soffner et al. (1996). The cumulative 5007 PNLF at any magnitude is defined as the number of PNe with magnitude brighter than . For comparison, we show in Figure 7 the cumulative PNLFs corresponding to the Large Magellanic Cloud (LMC) (251 PNe, Jacoby, Walker & Ciardullo 1990), the solar neighbourhood (36 PNe, Méndez et al. 1993) and NGC 300 (34 PNe, Soffner et al. 1996). Note that the PN sample in NGC 300 is similar to the PN sample in the solar neighbourhood, therefore, the two cumulative PNLFs are close to each other and below the LMC PNLF, as required by the sample size effect.
In order to plot the cumulative PNLF for NGC 185, we had to calculate the absolute magnitudes, , by adopting a distance modulus and a Galactic extinction correction. From the mean value of =0.29 (0.14), estimated previously in section 3.1, we derived E(B-V) through the relation =0.4E(B-V), where =3.7.
We obtained E(B-V)=0.19, in agreement with E(B-V)=0.18 from Schlegel, Finkbeiner, & Davis (1998). We consequently derived the absolute extinction (A()=0.65) that we used to correct the distance modulus. Since our sample of 7 PNe is smaller than the solar neighbourhood sample, we adopted a distance modulus which places the NGC 185 PNLF below the solar neighbourhood sample. The resulting distance modulus varies between 23 and 24. This one magnitude variation reflects the uncertainty in the distance determination due to the small sample size. Figure 7 shows the two cumulative PNLFs if we vary the distance modulus from 23 to 24. We also mention that the SBF (Surface Brightness Fluctuation) method (Tonry et al., 2001) for distance determination gives a distance modulus for NGC 185 of 24 but a comparison with the PNLF method is not possible at the moment, due to the uncertainty of the latter.
7 Summary and conclusions
In this paper we have analysed the deep Gemini+GMOS optical imaging and spectroscopy of the emission-line population in NGC 185. Through the observation of the central 5.5 5.5 arcmin2 of the galaxy, we were able to describe some important properties of eight (three of them just discovered) PNe, one symbiotic system (the first of the galaxy) and one SNR in much more detail than previously done.
The four brightest PNe of NGC 185 are thoroughly discussed in terms of their electron densities (never reported in the literature before) and temperatures, as well as chemical abundances of He, O, N, Ar and S. Most of these properties compare nicely with previous works (when available, i.e., Richer & McCall 2008).
Moreover, and thanks to the rare situation in which more than one analysis of the PN population of a given nearby galaxy is available, we discussed here the risk associated with the use of the [O ii] ionic abundances for the derivation of the nitrogen ICFs, in the extragalactic context. [O ii]3727 as well as [O ii]7325 forbidden emission-lines can be contaminated by recombination, specially in environments where the PN population is of high-excitation (Liu et al. 2000; Tsamis et al. 2003), as in the case of NGC 185. This misleading process can affect seriously our conclusions about the chemical evolution of the galaxy, as given by its PN population.
We argue that the bright PNe in NGC 185 have ages between 0.2 and 1.8 Gyr, and so represent young to intermediate-age populations. In addition, by comparing the age and metallicity of the PNe with those of the old stellar population of the galaxy we are able to conclude that NGC 185 has suffered a significant chemical enrichment within the last 8 Gyr.
The [O iii] fluxes of 7 out of the 8 PNe were used to obtain the PN luminosity function of the galaxy, from which we contrained the distance modulus of NGC 185 between 23 and 24.
The deep spectroscopic data presented here also allowed us to discover and describe in relative detail, the first symbiotic system of NGC 185. This symbiotic star is extremely similar to that reported by Kniazev et al. (2009) in another Local Group dwarf galaxy, NGC 6822. Following the fact that NGC 185 SySt-1 also possesses the broad emission feature at 6830Å, and does not show forbidden lines in its spectrum, an S-type symbiotic class is suggested for this star.
And last, but not least, for the first time we present the physical characteristics of the NGC 185 SNR-1 (probably the same reported by Gallagher et al. 1984). Moreover, we discuss the very interesting possibility of witnessing the induction of star formation by a supernova explosion. Indeed, the connection of the SNR-1 with the recent star formation in NGC 185 is strongly suggested by the presence of a number of relatively young stars that are all located around the NGC 185 SNR-1!
Acknowledgments
We would like to thank Marshall McCall, the referee, for his critics and suggestions that helped us to improved the paper. We also thank Roberto Méndez, Mike Barlow and Roger Wesson for useful discussions regarding the PNLF, and the contamination of the [O ii] forbidden lines by recombination. DRG kindly acknowledges the UCL Astrophysics Group for their hospitality. LPM thanks FAPESP’s financial support (2011/00171-4). LM is supported through the ASI-INAF grant “HeViCS: the Herschel Virgo Cluster Survey” I/009/10/0. The work of CQ is supported by the INCT-A (PDJ 154908/2010-0).
References
- Asplund (2003) Asplund M., 2003,Charbonnel C., Schaerer D., Meynet G., eds, ASP Conf. Ser. Vol. 304, CNO in the Universe. Astron. Soc. Pac., San Francisco, p. 275
- Baade (1951) Baade W., 1951, Publ. Obs. Univ. Michigan, 10, 7
- Benjamin, Skillman & Smits (1999) Benjamin R. A., Skillman E. D., & Smits D. P., 1999, ApJ, 514, 307
- Battinelli & Demers (2004) Battinelli P., Demers S., 2004, A&A, 417, 979
- Belczyński et al. (2000) Belczyński K., Miko0̆142ajewska J., Munari U., Ivison R. J., & Friedjung M., 2000, A&AS, 146, 407
- Blair & Long (2004) Blair W P., & Long K. S., 2004, ApJS, 155, 101
- Brandt et al. (1997) Brandt W. N., Ward M. J., Fabian A. C., & Hodge P. W., 1997, MNRAS, 291, 709
- Burstein & Heiles (1984) Burstein D., & Heiles C., 1984, ApJS, 54, 33
- Butler & Martínez-Delgado (2005) Butler D. J., & Martínez-Delgado D., 2005, AJ, 129, 2217
- Charbonnel et al. (1999) Charbonnel C., Döppen W., Schaerer D., Bernasconi P. A., Maeder A., Meynet G., & Mowlavi N., 1999, A&AS, 135, 405
- Ciardullo & Jacoby (1992) Ciardullo R., Jacoby G. H., 1992, ApJ, 388, 268
- Corradi (1995) Corradi, R. M. L., 1995, MNRAS, 276, 521
- Corradi et. al. (2005) Corradi R. L. M., Magrini L., Greimel R., Irwin M., Leisy P., et al., 2005, A&A, 43, 555
- Dickel, Silverman, & D’Odorico (1985) Dickel J. R., Silverman A., Dodorico S, 1985, AJ, 90, 414
- Dopita, Binette & Tuohy (1984) Dopita M. A., Binette L., Tuohy I. R., 1984, ApJ, 282, 142
- Filippenko (1982) Filippenko A. V., 1982, PASP, 94, 715
- Finkelstein et al. (2006) Finkelstein S. L., Morse J. A., Green J. C., Linsky J. L., Shull J. M., et al., 2006, ApJ, 641, 919
- Fitzpatrick (1999) Fitzpatrick E. L., 1999, PASP, 111, 63
- Ford, Jenner, & Epps (1973) Ford H. C., Jenner D. C., Epps H. W., 1973, ApJ, 183, L73
- Ford, Jacoby, & Jenner (1977) Ford H. C., Jacoby G., Jenner D. C., 1977, ApJ, 213, 18
- Gallagher et al. (1984) Gallagher J. S. III, Hunter D. A., & Mould J. R., 1984, ApJ, 281, L63
- Gathier & Pottasch (1989) Gathier R., & Pottasch S. R., 1989, A&A, 209, 369
- Geha et al. (2010) Geha M., van der Marel R. P., Guhathakurta P., Gilbert K. M., Kalirai J., & Kirby E. N., 2010, ApJ, 711, 361
- Gonçalves et al. (2004) Gonçalves D. R., Mampaso A., Corradi R. L. M., Perinotto M., Riera A., & López-Martín L., 2004, MNRAS, 355, 37
- Gonçalves et al. (2007) Gonçalves D. R., Magrini L., Leisy P., & Corradi, R. L. M., 2007, MNRAS, 375, 715
- Gonçalves et al. (2008) Gonçalves D. R., Magrini L., Munari U., Corradi R. L. M., & Costa R. D. D., 2008, MNRAS, 391, L84
- Gutiérrez-Moreno & Moreno (1996) Gutiérrez-Moreno A., & Moreno H., 1996, PASP, 108, 972
- Gutiérrez-Moreno, Moreno & Cortés (1995) Gutiérrez-Moreno A., Moreno H., & Cortés, G. 1995, PASP, 107, 107
- Herwig (2005) Herwig F., 2005, ARA&A, 43, 435
- Hyung, Aller & Feibelman (1994) Hyung S, Aller L. H., & Feibelman W. A., 1994, ApJS, 93, 465
- Jacoby, Walker & Ciardullo (1990) Jacoby G. H., Walker A. R., & Ciardullo R., 1990, ApJ, 365, 471
- Kaler & Jacoby (1989) Kaler J. B., & Jacoby G. H., 1989, ApJ, 345, 871
- Karakas & Lattanzio (2007) Karakas A., Lattanzio J. C., 2007, PASA, 24, 103
- Kniazev et al. (2004) Kniazev A. Y., Pustilnik S. A., Grebel E. K., Lee H., & Pramskij A. G., 2004, ApJS, 153, 429
- Kniazev et al. (2009) Kniazev A. Y., Väisänen P., Whitelock P. A., Menzies J. W., Feast M. W., et al., 2009, MNRAS, 395, 1121
- Kingsburgh & Barlow (1994) Kingsburgh R. L., & Barlow M. J., 1994, MNRAS, 271, 257
- Lee, Freedman & Madore (1993) Lee M. G., Freedman W. L., & Madore B. F., 1993, AJ, 106, 964
- Leisy & Dennefeld (2006) Leisy P. & Dennefeld M., 2006, A&A, 456, 451
- Liu et al. (2000) Liu X.-W., Storey P. J., Barlow M. J., Danziger I. J., Cohen M., & Bryce M., 2000, MNRAS, 312, 585
- Magrini et al. (2005) Magrini L., Leisy P., Corradi R. M. L., Perinotto M., Mampaso A., & Vílchez J. M., 2005, A&A, 443, 115
- Magrini & Gonçalves (2009) Magrini L., & Gonçalves D. R., 2009, MNRAS, 398, 280
- Marleau, Noriega-Crespo & Misselt (2010) Marleau F. R., Noriega-Crespo A., & Misselt K. A, 2010, ApJ, 713, 992
- Marigo (2001) Marigo P., 2001, A&A, 370, 194
- Martins et al. (2011) Martins L. P., Lanfranchi G., Gonçalves D. R., Magrini L., Teodorescu A. M., & Quireza C., MNRAS submitted
- Martínez-Delgado & Aparicio (1998) Martínez-Delgado D., & Aparicio A., 1998, AJ, 115, 1462
- Martínez-Delgado et al. (1999) Martínez-Delgado D., Aparicio A., & Gallart C., 1999, AJ, 118, 2229
- Massey et al. (1988) Massey P., Strobel K., Barnes J. V., Anderson E., 1988, ApJ, 328, 315
- Massey & Gronwall (1990) Massey P., Gronwall C., 1990, ApJ, 358, 344
- Mateo (1998) Mateo M. L., 1998, ARA&A, 36, 435
- Mathis (1990) Mathis J.S., 1990, ARA&A, 28, 37
- Méndez et al. (1993) Méndez R. H., Kudritzki R. P., Ciardullo R., & Jacoby G. H., 1993, A&A, 275, 534
- Mikolajewska, Acker & Stenholm (1997) Mikolajewska J., Acker A., Stenholm B., 1997, A&A, 327, 191
- Mollá, Ferrini & Díaz (1996) Mollá M., Ferrini, F., & Díaz, A. I. 1996, ApJ, 466, 668
- Munari & Zwitter (2002) Munari U., & Zwitter T., 2002, A&A, 383, 188
- Nowotny et al. (2003) Nowotny W., Kerschbaum F., Olofsson H., & Schwarz H. E., 2003, A&A, 403, 93
- Osterbrock & Ferland (2006) Osterbrock D.E., & Ferland G., 2006, Astrophysics of Gaseous Nebulae and Active Galactic Nuclei, 2nd. ed. (Univ. Science Books)
- Peimbert & Torres-Peimbert (1983) Peimbert M., & Torres-Peimbert S., 1983, in Proc. Symp. (Dordrecht: D. Reidel Publishing Co.), 233
- Péquignot et al. (1991) Péquignot D., Petitjean P., Boisson C., 1991, A&A, 251, 680
- Peña et al. (2007) Peña M., Stasińiska G., & Richer M. G., 2007, A&A, 476, 745
- Pereira, Landaberry, & da Conceição (1998) Pereira C. B., Landaberry, S. J. C., & da Conceição, F. 1998, AJ, 116, 1971
- Perinotto, Morbidelli, & Scatarzi (2004) Perinotto M., Morbidelli L., & Scatarzi A., 2004, MNRAS, 349, 793
- Proga et al. (1996) Proga D, Kenyon S. J., Raymond J. C., & Mikolajewska J., 1996, ApJ, 471, 930
- Richer & McCall (1995) Richer M. G., & McCall M. L., 1995, ApJ, 445, 642
- Richer & McCall (2008) Richer M. G., & McCall M. L., 2008, ApJ, 684, 1190
- Rubin (1986) Rubin R. H., 1986, ApJ, 309, 334
- Sabbadin et al. (1977) Sabbadin F., Minello S., Bianchini A., 1977, A&A, 60, 147
- Schlegel, Finkbeiner, & Davis (1998) Schlegel D. J., Finkbeiner D. P., & Davis M., 1998, ApJ, 500, 525
- Schmid (1989) Schmid H. M., 1989, A&A, 211, L31
- Schmid & Schild (1990) Schmid H. M., & Schild H., 1990, MNRAS, 246, 84
- Shaw & Dufour (1994) Shaw R. A., & Dufour R. J., 1994, ASPC, 61, 327
- Soffner et al. (1996) Soffner T., Méndez R. H., Jacoby G. H., Ciardullo R., Roth M. M., & Kudritzki R. P., 1996, A&A, 306, 9
- Stanghellini & Kaler (1989) Stanghellini L., & Kaler J. B., 1989, ApJ, 343, 811
- Stasińska, Richer & McCall (1998) Stasinska G., Richer M. G., & McCall M. L., 1998, A&A, 336, 667
- Stasińska (2002a) Stasińska G., 2002a, RMxAC, 12, 62
- Stasińska (2002b) Stasińska G., 2002b, Proceedings of the XIII Canary Islands Winter School of Astrophysics; In: Cosmochemistry. The melting pot of the elements, edited by C. Esteban, R. J. García López, A. Herrero, F. Sánchez. Cambridge contemporary astrophysics. Cambridge, UK: Cambridge University Press, 2004, p. 115 - 170
- Tomova & Tomov (1999) Tomova M. T., Tomov N. A., 1999, A&A, 347, 151
- Tonry et al. (2001) Tonry J. L., Dressler A., Blakeslee J. P., Ajhar E. A., Fletcher A. B., Luppino G. A., Metzger M. R. & Moore C. B., 2001, ApJ, 546, 681
- Tsamis et al. (2003) Tsamis Y. G., Barlow M. J., Liu X.-W., Danziger I. J., & Storey P. J., 2003, MNRAS, 345, 186
- Vassiliadis & Wood (1993) Vassiliadis E., & Wood P. R., 1993, ApJ, 413, 641
- Vassiliadis & Wood (1994) Vassiliadis E., & Wood P. R., 1994, ApJS, 92, 125
- Young (2001) Young L. M., 2001, AJ, 122, 1747
- Welch, Mitchell,& Yi (1996) Welch G. A., Mitchell G. F., Yi S., 1996, ApJ, 470, 781
- Zijlstra & Pottasch (1998) Zijlstra A. A., & Pottasch S. R., 1998, A&A, 216, 245