Fast motions of galaxies in the Coma I cloud: a case of Dark Attractor?
Abstract
We notice that nearby galaxies having high negative peculiar velocities are distributed over the sky very inhomogeneously. A part of this anisotropy is caused by the “Local Velocity Anomaly”, i.e. by the bulk motion of nearby galaxies away from the Local Void. But a half of the fast-flying objects reside within a small region , known as the Coma I cloud. According to Makarov & Karachentsev (2011), this complex contains 8 groups, 5 triplets, 10 pairs and 83 single galaxies with the total mass of .
We use 122 galaxies in the Coma I region with known distances and radial velocities km/s to draw the Hubble relation for them. The Hubble diagram shows a Z-shape effect of infall with an amplitude of +200 km/s on the nearby side and km/s on the back side. This phenomena can be understood as the galaxy infall towards a dark attractor with the mass of situated at a distance of 15 Mpc from us. The existence of large void between the Coma and Virgo clusters affects probably the Hubble flow around the Coma I also.
keywords/ galaxies: distances and redshifts — galaxies: clusters:
individual (Coma I)
Accepted for publication in ApJ September, 3rd, 2011
1 Introduction
Peculiar motions of galaxies relative to the uniform Hubble expansion can be divided into two types: 1) the virial (thermal) motion in groups and clusters, and 2) coherent flows (or “Gulf Streams”) triggered by the continuing formation of the large-scale structure of the universe. In the first case the galaxies “ forget” their initial conditions. Characteristic amplitudes of the virial motions amount to km/s at the typical sizes of virial regions amounting to Mpc. In the second case, the flow amplitudes can be also large, reaching km/s (an example — the motion of the Local Volume relative to the cosmic microwave background, CMB, with the velocity of 630 km/s (Kogut et al. 1993)). It is assumed that linear scales of the flows range from to Mpc.
In a simplified view, the cosmic currents appear as a radial infall of galaxies towards local attractors, or as radial motions outward from the centers of cosmic voids.
If the virial motions in groups and especially in clusters are easily measurable even at large distances, the cosmic flows are still mostly unstudied. The main reason is the scarcity of available database on galaxy distances.
According to Tonry et al. (2000), our Local Group and its wider vicinities are moving to the nearest Virgo cluster with a velocity of km/s, and to a more distant and more massive Great Attractor in the Hydra-Centaurus with a velocity of km/s. Some authors (Scaramella et al. 1995) explain the observed motion of the Local Volume relative to the CMB by the gravitational influence of the supercluster of galaxies, called the Shapley Concentration, located at a distance of 200 Mpc from us.
Based on much more numerous data on individual distances to nearby galaxies, Tully at al. (2008) have divided the global motion of the Local Volume into three approximately orthogonal components: the infall towards the Virgo Cluster with a velocity of 185 km/s, a recession from the expanding Local Void with 260 km/s, and a motion towards the Centaurus cluster with a velocity of 455 km/s.
According to the results of N-body simulations of the evolution of large-scale structure (Klypin et al. 2003, Schaap 2007), the pattern of collective galaxy motions on the scales of 10–100 Mpc can look much more intricate. Beyond the boundaries of virialized groups and clusters, in the regions of low density (occupying more than 90% of the universe’s volume), the characteristic kinematic pattern appears as the motion of galaxies from voids towards walls and filaments, embordering them, and as flows along the filaments to large concentrations of mass, i.e. towards the clusters. According to the results of modeling, the amplitude of such local bulk motions can reach up to several hundred km/s (see Figs. 5–7 in Klypin et al. 2003).
The data on radial velocities and distances of galaxies in the vicinity of the closest groups and clusters: the Local Group, M81 group, Centaurus A group, Virgo cluster, Fornax/Eridanus cluster reveal the presence of the expected infall zones around them (Karachentsev et al. 2007a, 2009, Karachentsev & Nasonova 2010, Nasonova et al. 2011).
Unfortunately, the study of collective galaxy motions in the low density regions is not yet supported by a sufficient amount of observational data. Only the nearest volume around us contains a reasonable number of galaxies with measured distances in order to get the initial idea on the “Gulf Streams”, associated with the walls and filaments of the large-scale structure. In our paper we attempt to assess the observational capabilities in this aspect.
2 Local ( km/s) galaxies with high negative peculiar velocities
Back in the 1980s, it was noted that nearby galaxies with large negative peculiar radial velocities are distributed in the sky extremely inhomogeneously. Except for the central region of the Virgo cluster, negative velocities, km/s, occur mainly in the region of the Gemini-Cancer-Leo constellations. This phenomenon has been called the “Local Velocity Anomaly” LVA (de Vaucouleurs & Bollinger 1979, de Vaucouleurs & Peters 1985, Giraud 1990, Hun & Mould 1990). The most plausible explanation for this phenomenon was proposed by Tully et al. (1992, 2008), under which the Local Cloud (Sheet) is receding away from the Local Void, thus approaching the neighboring clouds in the Leo and Cancer with a relative velocity of km/s. As a result, such galaxies as UGC3755, DDO47, KK65, D634-03, located at a distance of Mpc, possess radial velocities relative to the LG of less than 200 km/s. Note that distances to these galaxies were measured with high accuracy based on the Tip of Red Giant Branch (TRGB) method with the Hubble Space Telescope (HST).
Continuing to measure distances to nearby galaxies by the TRGB method at the HST, Karachentsev et al. (2006) drew attention to other cases of galaxies with large negative peculiar velocities: IC779, KK127, NGC4150, UGC7321. These galaxies are concentrated in a small region of the sky around , where a scattered group Coma I is located.
The most representative sample of nearby galaxies to date, the Catalog of Neighboring Galaxies (Karachentsev et al. 2004), contains 450 galaxies with distance estimates within 10 Mpc from us. If the individual distance to a galaxy was unknown, it was included in the Local Volume sample based on the value of its corrected radial velocity km/s. The second, expanded version of this catalog (Karachentsev, 2012, in preparation) contains about 770 galaxies with Mpc or km/s. Thirty-six galaxies with the velocities of km/s, but having the distance estimates exceeding 12 Mpc made it into this sample too. At the Hubble parameter km/s/Mpc, these galaxies have peculiar radial velocities of km/s. Their list is presented in Table 1. For the obvious reason it does not include the galaxies in the virial zone with the radius of 6∘ around the center of the Virgo cluster.
The columns of Table 1 contain: (1) galaxy name, (2) its equatorial coordinates, (3) morphological type on de Vaucouleurs scale; (4) radial velocity relative to the centroid of the Local Group; (5) distance estimate in Mpc; (6) the method used for distance measurement (“tf”— based on the Tully-Fisher relation with the parameters from Tully et al. (2008), “sbf” — based on the surface brightness fluctuations from Tonry et al. (2001), “bs” — based on the luminosity of the brightest stars); (7) apparent B-band magnitude; (8) doubled amplitude of rotation in km/s; (9) peculiar radial velocity in km/s; (10) comments on probable galaxy membership in certain groups. Most data on magnitudes and rotational velocities are taken from NED and HyperLEDA databases and supplemented with Courtois et al. (2009, 2011) and Cannon et al. (2011).
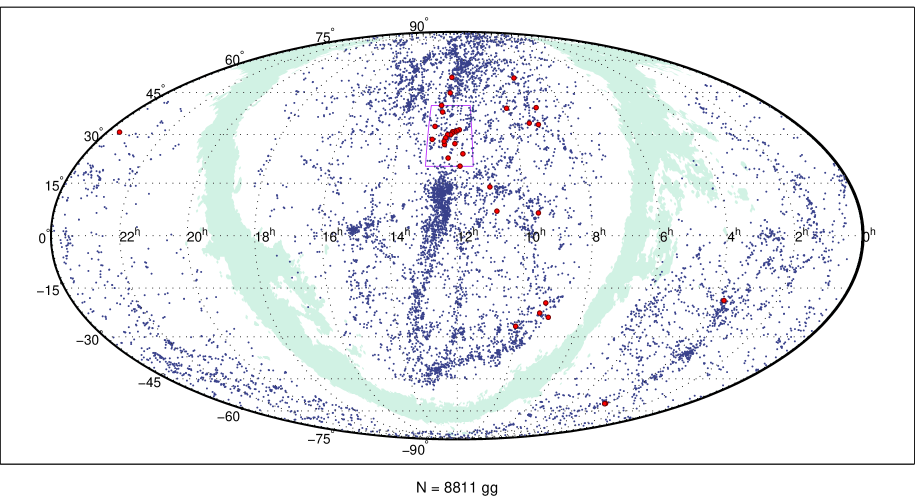
Figure 1 shows the distribution of 8811 galaxies in the sky in equatorial coordinates with radial velocities km/s at the galactic latitudes . The gray ragged strip indicates the zone of strong galactic absorption according to Schlegel et al. (1998). The figure clearly shows the filamentary structure of the Local Supercluster and its immediate environs. The red circles mark 36 galaxies from Table 1 with large negative . The distribution of the 36 marked galaxies is characterized by a significant clumpiness, as well as by the west-east asymmetry. A part of this asymmetry is caused by the LVA phenomenon, caused by the runaway of galaxies from a large volume of the Local Void centered approximately at . The median peculiar velocity of the “flyer” galaxies is 660 km/s. With a median distance of the galaxies amounting to 15.1 Mpc, a typical error of distance measurement using the Tully-Fisher method (about 20%) generates a characteristic error of peculiar velocity amounting to km/s. Consequently, some galaxies could appear in Table 1 due to the distance measurement errors. Another reason could be the entry of galaxies in a group or a cluster with large virial velocities. Some cases like this are commented in the last column of Table 1. In particular, the case of an E-galaxy NGC1400, belonging to the Eridanus group, was already discussed by Trentham et al. (2006). Curiously, this list includes the galaxy UGC12713 = LOG506, which is included in the catalog of 513 most isolated objects of the Local Supercluster (Karachentsev et al. 2011).
Exactly one half of the galaxies in Table 1 is concentrated within the region , , occupying only 1% of the total area of the sky. The probability of random formation of such a configuration is vanishingly small . This subsystem of “flyers”, designated in Table 1 as Coma I cloud, is characterized by the median distance of 16.2 Mpc and the median peculiar velocity of km/s. A complex kinematic situation in this region, which lies on the equator of the Local Supercluster, deserves a more detailed examination.
3 The Coma I complex of galaxies
According to Tully (1988) in the region ], outlined by a red contour in Fig. 1, there is a group of galaxies “14–1”, belonging to the Coma-Sculptor cloud. From 25 galaxies with known radial velocities Tully has determined the mean radial velocity of the group as +911 km/s and its total luminosity of . The virial radius of the group according to Tully is 0.34 Mpc, the dispersion of radial velocities km/s and the ratio of virial mass to luminosity .
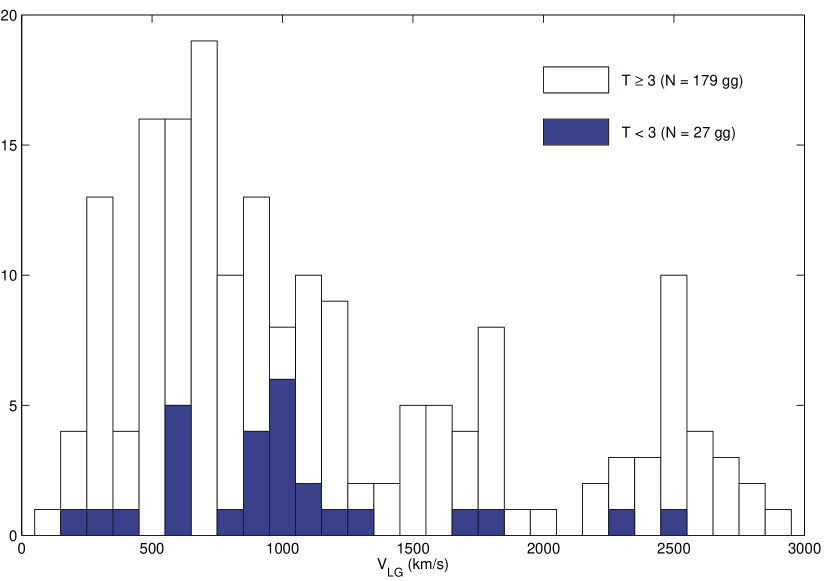
At present, 206 galaxies are known in this region with radial velocities km/s. The distribution of these galaxies on the velocity scale is shown in Fig. 2. The early-type galaxies with developed bulges ( are marked in gray. A small number of galaxies with radial velocities km/s catches one’s eye. This is probably due to the presence of a large cosmic void between the Local Supercluster and the rich Coma cluster (+6900 km/s).
Some authors made a search for dwarf galaxies in the region of Coma I. Almost a half of this region has been inspected by Binggeli et al. (1990) on the specially exposed IIIaJ Palomar Schmidt plates, resulting in to the discovery of 34 dwarf galaxies. Trentham & Tully (2002) used the 8-m Subaru telescope to search for the dwarf population in Coma I in a narrow strip near NGC4274. In the area of 1.3 square degrees, they have detected about 30 dwarf member candidates of the Coma I group. Karachentsev et al. (2007b) found in the region ] twenty-five dwarf galaxies of low surface brightness. Subsequent observations in the HI 21cm line (Huchtmeier et al. 2009) added several new dwarf members of the Coma I complex. About 12% of the studied region overlap with the zone of the blind HI survey (Kovac et al. 2009), where several new nearby gas-rich dwarfs were discovered. The SDSS survey contains a lot of valuable data about the galaxies in Coma I (Abazajian et al. 2009). Boselli & Gavazzi (2009) used the HI characteristics of the galaxies in this region to search for the effect of ”HI-deficiency”.
Makarov & Karachentsev (2011) collected the observational data on 10 800 galaxies in the Local Supercluster and its vicinity with km/s and . A new clustering algorithm was applied to this sample, which takes into account individual luminosities, radial velocities and mutual distances of galaxies. In contrast to the simple friend-of-friend percolation algorithm (Huchra & Geller 1982, Crook er al. 2007), a new criterion isolates the galaxy systems with approximately the same characteristics both in close and distant volumes. In the examined region ] eight groups (Makarov & Karachentsev 2011), 5 triplets (Makarov & Karachentsev 2009) and 10 pairs of galaxies (Karachentsev & Makarov 2008) were isolated with a total of members. Apart from them, 83 galaxies have evaded the clustering, representing 41% of the total. The data on the group members, the members of triplets and pairs, and single galaxies are listed in Tables 2, 3 and 4, respectively. The columns of tables contain: (1) galaxy name, (2) its coordinates, (3) radial velocity relative to the , (4) morphological type, (5) the apparent -magnitude, (6,7) the distance to the galaxy, indicating the method of distance measurement: “cep” — from the luminosity of Cepheids, “rgb” — from the luminosity of the tip of red giant branch, “sbf”— from the surface brightness fluctuations , “tf” — by the Tully-Fisher method. The assumed typical errors of these methods are: 7% for ”cep” and ”rgb”, 12% for ”sbf”, and 20% for ”tf”.
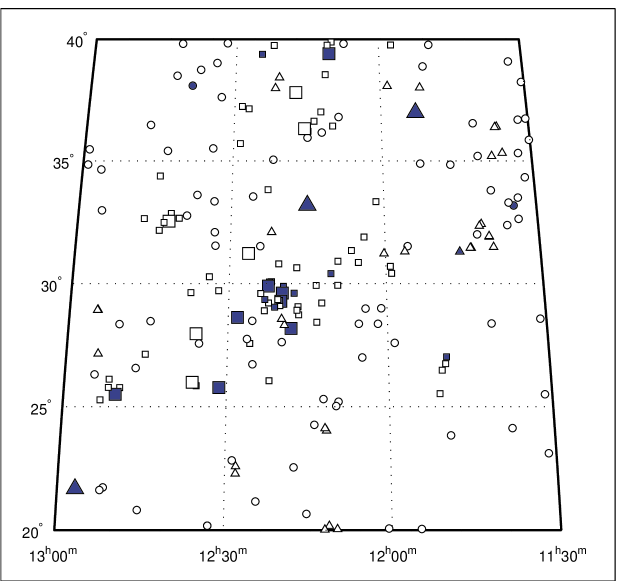
The distribution of 206 galaxies of different degrees of multiplicity is presented in equatorial coordinates in Fig. 3. Early-type galaxies (3) are marked in gray. The members of the eight groups are indicated by squares, the members of triplets and pairs — by triangles, and single objects are shown by small circles. The larger symbols mark bright galaxies with . Note that among 83 field galaxies there are only two early-type galaxies: CGCG186-009 and UGC7816, and objects of high luminosity are almost absent.
As we can see, there exists a mutual overlap of members of different systems in this sky region. However, this situation is absolutely expectable, since the region is located on the very equator of the Local Supercluster.
The summary of the main characteristics of the eight MK-groups, forming the Coma I complex is presented in Table 5, its columns contain: (1) the name of the brightest galaxy of the group, (2) the number of members with measured radial velocities, (3) the mean radial velocity based on which the distance to the group was determined at km/s/Mpc, (4) radial velocity dispersion, (5) linear harmonic radius of the group in kpc, (6) the total luminosity of the group members in the -band, (7.8) virial mass and virial mass ratio to the total K-luminosity, (9) the number of group members with measured distances, (10,11) the mean distance modulus of the group and its variance. In the lower rows of columns (5–8) we list the values of group parameters, not derived by the average velocity of the group, but from the average of individual distance moduli of the group members.
It follows from these data that the groups of galaxies have a typical linear size of kpc and a rather low dispersion of radial velocities. Only one group, NGC4150, stands out by a very high virial mass-to-luminosity ratio, . However, this value drops by a factor of 5 when the distance to the group is estimated directly, rather than by the mean radial velocity.
Most of the individual distance moduli for galaxies in this complex were measured from the Tully-Fisher relation with a typical error of mag. The values of in the last column of Table 5 show that 7 out 8 groups may be regarded as real physical groups. Only in the case of group NGC4631 the applied clustering algorithm isolates a pseudo-group of galaxies with close radial velocities, but different distance estimates (subgroups around NGC4631, NGC4278 and NGC4414). Despite the small statistics, a good agreement between the distance estimates is as well observed in the pairs and triplets of galaxies (see Table 3).
4 Hubble flow in the Coma I complex
A group of galaxies around NGC 4150 looks like a “flock” heading towards us with an average velocity of km/s relative to the uniform Hubble expansion. Its angular distance from the center of the Virgo cluster is 17∘, what is smaller than the zero-velocity surface radius of the cluster, 23∘ (Karachensev & Nasonova 2010). At the first sight, a high peculiar velocity of NGC4150 can be explained by its participation in the Virgocentric infall. However, the group is located at a distance of 16.3 Mpc from us, almost as far as the center of the Virgo cluster (16.8 Mpc). Therefore, the radial infall of the NGC4150 group toward the center of the cluster should not produce a significant component of the line-of-sight velocity. Consequently, there exists another reason of high peculiar velocity in this group as a whole.
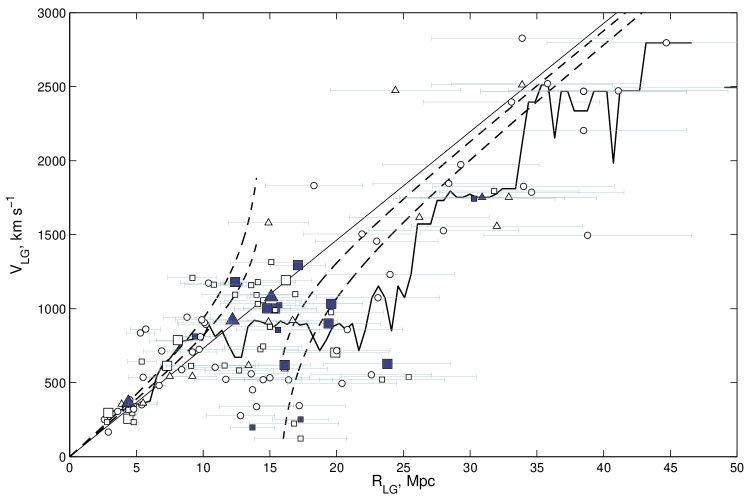
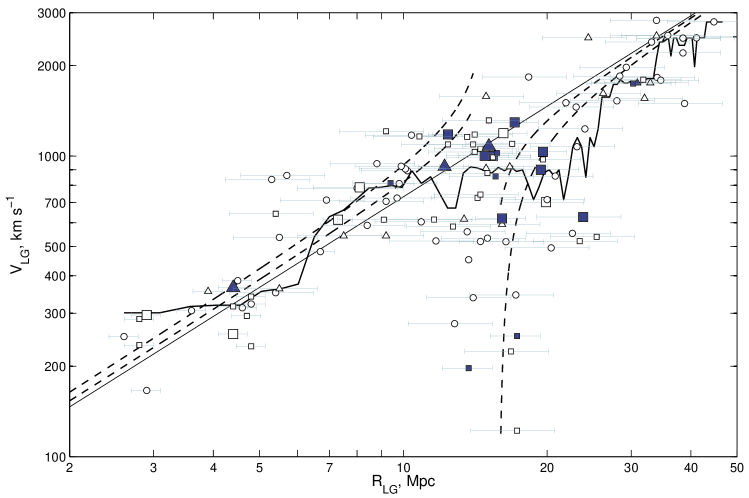
The distribution of 122 galaxies in the Coma I region by radial velocities and distance estimates is presented in Fig. 4. Its upper and lower pannels show the same observational data but given in two different manner: in the linear scale and in a log-log view. Different symbols denote galaxies of different morphology and membership in the same manner as in Fig.3. Distance error bars are marked by light horizontal lines. The straight line there corresponds to the uniform Hubble flow with the parameter of km/s/Mpc. The broken line shows the behavior of the running median with a window of 2 Mpc. Notwithstanding a significant scatter of observational data, the mean radial velocity variation with distance demonstrates the well-known effect of a Z-shaped wave that results from the infall of galaxies towards a local attractor. The characteristic infall velocity at the front side is about 200 km/s, and at the back side it amounts to about 700 km/s. Two dashed lines in Fig. 4 show the order of infall on the attractor with the mass of and , located at a distance of 15 Mpc from us, for the line of sight, crossing the center of the attractor. A comparison of these curves with the running median suggests that the mass of the hypothetical attractor is .
However, the distribution of galaxies in Fig. 1 does not reveal any prominent concentration of galaxies in the region of Coma I. In other words, what we have here is an unusual case of a Dark Attractor. The total virial mass of 8 groups from Table 5 is . Adding to it the total mass of five triplets (), 10 pairs () and single galaxies (), we derive the total mass of the Coma I complex of about (). This value is four times smaller than the expected mass to explain the infall amplitude in Fig. 4.
As noted by Makarov & Karachentsev (2011), the total mass of the dark matter concentrated in the virial regions of groups and clusters corresponds to the average density , which is three times lower than the global density of (Spergel et al. 2007). An assumption that 2/3 of the amount of dark matter in the universe is located outside the virialized regions can be one of the explanations of this contradiction. Massive, but unvirialized filaments and walls of the large-scale structure may appear to be considerable reservoirs of dark matter as well as “lost” baryons (Fukugita & Peebles 2004). It is quite likely that the region of Coma I is a fragment of such a massive dark filament, extending far to the north of the Virgo cluster.
5 Concluding remarks
The detection of galaxies or galaxy groups, moving with peculiar velocities of km/s is a sophisticated observational task. Such motions in the low density regions, comparable in amplitude with virial velocities in clusters, probably arise from the continuing formation of elements of the large-scale structure, namely, filaments and walls.
Large peculiar motions in the Coma I cloud are not related with a high concentration of galaxies in this field. The observed relationship between the velocities and distances in the Coma I resembles the pattern of galaxy infall towards an invisible Dark Attractor. Such an attractor can be a dark filament ( galaxies + dark matter), which extends to the north of the Virgo cluster. Behind this filament there is a large cosmic void, lying between the Virgo and Coma I clusters. It is possible that the presence of this void causes the three times greater infall amplitude at the far side of the filament in the Coma I compared to the front side. The observational resources for the investigations of motions in Coma I are far from being exhausted. The scatter of galaxies on the Hubble diagram (Fig. 4) is partly due to the low quality of the available HI data, used to determine the distances by the Tully-Fisher method. For example, according to the LEDA, the galaxy IC2992=Mrk757 has the HI line width of km/s, whereas according to the recent observations at the Arecibo, it amounts to only 46 km/s (R. Giovanelli, personal communication). Within the SDSS survey (Abazajian et al. 2009) a large number of dwarf galaxies were detected in Coma I, in which the HI line widths have not yet been measured. Almost entire region of the Coma I is situated in the ALFALFA survey zone (Giovanelli et al. 2005). New data from this survey can render the pattern of kinematics in the Coma I galaxies much more clear 111The new ALFALFA data release (Haynes et al, arXiv:1109.0027) yields at least two new distant dIr galaxies with low velocities in the Coma I field: AGC229053 ( D= 17.9 Mpc, VLG = +376 km/s) and AGC749236 ( D= 19.5 Mpc, VLG = +235 km/s)..
One pessimistic deduction follows from the above. For the vast majority of galaxies the only distance estimates available as yet are their radial velocities. To account for non-Hubble motions of galaxies, and thereby improve the accuracy of kinematic distance measurement , various models correcting for the local galaxy infall towards the Virgo attractor and the Great Attractor in the Centaurus have been proposed (Kraan-Korteweg 1986, Masters 2005). Such models may, however, turn out to be too naive, not reflecting the true pattern of large-scale flows.
References
References
- [1]
- [2] [Abazajian K.N., Adelman-McCarthy J.K., Agueros M.A. et al., 2009, ApJSuppl. 182, 543]
- [3] [ Binggeli B., Tarenghi M., Sandage A., 1990, A & A, 228, 42]
- [4] [ Boselli A., Gavazzi G., 2009, A & A, 508, 210]
- [5] [ Cannon J.M., Giovanelli R., Haynes M.P. et al., 2011, ApJL, in press (ArXiv:1105.4505) ]
- [6] [Courtois H.M., Tully R.B., Makarov D.I. et al., 2011, MNRAS, 411, 2005]
- [7] [ Courtois H.M., Tully R.B., Fisher J.R. et al., 2009, AJ, 138, 1938]
- [8] [ Crook A.C., Huchra J.P., Martimbeau N. et al., 2007, ApJ, 655, 790]
- [9] [ de Vaucouleurs G., Peters W.L., 1985, ApJ, 297, 27]
- [10] [ de Vaucouleurs G., Bollinger G., 1979, ApJ, 233, 433]
- [11] [ Fukugita M., Peebles P.J.E., 2004, ApJ, 616, 643]
- [12] [ Giovanelli R., Haynes M.P., Kent B.R., et al. 2005, AJ, 130, 2598]
- [13] [ Giraud E., 1990, A&A, 231, 1]
- [14] [ Han M., Mould J., 1990, ApJ, 360, 448]
- [15] [ Huchra J.P., Geller M.J., 1982, ApJ, 257, 423]
- [16] [ Huchtmeier W.K., Karachentsev I.D., Karachentseva V.E., 2009, A & A, 506, 677]
- [17] [ Karachentsev I.D., Makarov D.I., Karachentseva V.E., Melnyk O.V., 2011, Astrophys. Bulletin, 66, 1]
- [18] [ Karachentsev I.D., Nasonova O.G., 2010, MNRAS, 405, 1075]
- [19] [ Karachentsev I.D., Kashibadze O.G., Makarov D.I., Tully R.B., 2009, MNRAS, 393, 1265]
- [20] [ Karachentsev I.D., Makarov D.I., 2008, Astrophys. Bulletin, 63, 299]
- [21] [ Karachentsev I.D., Karachentseva V.E., Huchtmeier W.K., 2007a, Astron.Lett., 33, 512]
- [22] [ Karachentsev I.D., Tully R.B., Dolphin A. et al. 2007b, AJ, 133, 504]
- [23] [ Karachentsev I.D., Dolphin A.E., Tully R.B., et al. 2006, AJ, 131, 1361]
- [24] [ Karachentsev I.D., Karachentseva V.E., Huchtmeier W.K., Makarov D.I., 2004, AJ, 127, 2031 (CNG)]
- [25] [ Klypin A., Hoffman Y., Kravtsov A.V., Gottloeber S., 2003, ApJ, 596, 19]
- [26] [ Kogut A., Lineweaver C., Smoot G.F., et al., 1993, ApJ, 419, 1]
- [27] [ Kovac K., Oosterloo T.A., van der Hulst J.M., 2009, MNRAS, 400,743]
- [28] [ Kraan-Korteweg R.C., 1986, A & AS, 66, 255]
- [29] [ Makarov D.I., Karachentsev I.D., 2011, MNRAS, 412, 2498]
- [30] [ Makarov D.I., Karachentsev I.D., 2009, Astrophys. Bulletin, 64, 24]
- [31] [ Masters K.L., 2005, “Galaxy flows in and around the Local Supercluster”q, PhD, Cornell Univ.]
- [32] [ Nasonova O.G., de Freitas Pacheco J.A., Karachentsev I.D., 2011, A&A, 532, A104]
- [33] [ Scaramella R., 1995, ApL & C, 32, 297]
- [34] [ Schaap W., 2007, PhD Thesis, Groningen Univ.]
- [35] [ Schlegel D.J., Finkbeiner D.P., Davis, M., 1998, ApJ, 500, 525]
- [36] [ Spergel D.N., et al. 2007, ApJS, 170, 377]
- [37] [ Tonry J.L., Dressler A., Blakeslee J.P., et al. 2001, ApJ, 546, 681]
- [38] [ Tonry J.L., Blakeslee J.P., Ajhar E.A., Dressler A., 2000, ApJ, 530, 625]
- [39] [ Trentham N., Tully R.B., Mahdavi A., 2006, MNRAS, 369, 1375]
- [40] [ Trentham N., Tully R.B., 2002, MNRAS, 335, 712]
- [41] [ Tully R.B., Shaya E.J., Karachentsev I.D., et al., 2008, ApJ, 676, 184]
- [42] [ Tully R.B., Pierce M.J., 2000, ApJ, 533, 744]
- [43] [ Tully R.B., Shaya E.J., Pierce M.J., 1992, ApJS, 80, 479]
- [44] [ Tully R.B., 1988, Nearby Galaxies Catalog, Cambridge University Press]
 |
 |
| Name | RA Dec | T | 2 | Notes | |||||
| (2000.0) | km/s | Mpc | mag | km/s | km/s | ||||
| (1) | (2) | (3) | (4) | (5) | (6) | (7) | (8) | (9) | (10) |
| NGC1400 | 033930.8184117 | -3 | 485 | 24.5 | sbf | 11.92 | — | 1303 | Eridanus gr |
| IC 2038 | 040854.1555932 | 7 | 505 | 17.0 | tf | 14.98 | 95 | 736 | pair w. N1533 |
| NGC1533 | 040951.8560706 | 1 | 582 | 19.4 | sbf | 11.79 | 239 | 834 | pair w. IC2038 |
| UGC4704 | 085900.3391236 | 8 | 581 | 15.2 | tf | 15.0 | 96 | 529 | LVA |
| ESO497-04 | 090303.1234830 | 8 | 519 | 14.5 | tf | 16.36 | 78 | 540 | |
| UGC4787 | 090734.9331636 | 8 | 490 | 15.1 | tf | 14.6 | 106 | 612 | LVA |
| UGCA153 | 091312.1192431 | 8 | 488 | 19.0 | tf | 15.40 | 96 | 899 | |
| UGC4932 | 091934.1510633 | 8 | 598 | 18.6 | tf | 15.17 | 100 | 760 | N2841 gr? |
| DDO62 | 092127.5223002 | 8 | 592 | 14.4 | tf | 14.8 | 103 | 459 | |
| SDSS | 092609.4334304 | 10 | 488 | 19.7 | tf | 17.8 | 47 | 950 | LVA |
| CGCG035-07 | 093444.9062532 | 9 | 356 | 13.0 | tf | 15.22 | 92 | 593 | LVA? |
| ESO499-38 | 100350.2263646 | 10 | 591 | 12.7 | tf | 15.68 | 68 | 336 | |
| KKH58 | 100722.7385811 | 8 | 569 | 14.9 | tf | 15.61 | 72 | 519 | LVA? |
| UGC5923 | 104907.6065502 | 7 | 537 | 16.4 | tf | 14.4 | 122 | 660 | Leo I gr |
| NGC3489 | 110018.6135404 | 1 | 538 | 12.1 | sbf | 11.12 | 282 | 345 | Leo I gr |
| DDO97 | 114857.2235016 | 10 | 453 | 13.7 | bs | 15.14 | 70 | 547 | Coma I cld |
| UGC6881 | 115444.7200320 | 10 | 519 | 16.4 | tf | 15.9 | 72 | 678 | Coma I cld |
| KDG82 | 115539.4313110 | 8 | 560 | 13.6 | tf | 14.84 | 87 | 433 | Coma I cld |
| KUG1157+31 | 120016.2311330 | 8 | 593 | 16.1 | tf | 15.05 | 91 | 582 | Coma I cld |
| NGC4080 | 120451.8265933 | 8 | 519 | 15.0 | tf | 13.7 | 134 | 576 | Coma I cld |
| IC 2992 | 120515.9305120 | 9 | 583 | 12.7 | tf | 15.02 | 46 | 344 | Coma I cld |
| UGC7131 | 120911.8305424 | 8 | 226 | 16.8 | tf | 15.1 | 102 | 1000 | Coma I cld |
| NGC4150 | 121033.6302406 | 1 | 198 | 13.7 | sbf | 12.49 | — | 802 | Coma I cld |
| KK127 | 121322.7295518 | 9 | 122 | 17.3 | tf | 15.6 | 82 | 1141 | Coma I cld |
| UGC7267 | 121523.6512060 | 8 | 550 | 12.9 | tf | 14.79 | 95 | 392 | N4157 gr? |
| UGC7320 | 121728.5444841 | 8 | 582 | 14.3 | tf | 15.4 | 72 | 462 | N4258 gr |
| UGC7321 | 121734.0223225 | 7 | 344 | 17.2 | tf | 14.09 | 188 | 912 | Coma I cld |
| IC 779 | 121938.7295300 | 1 | 196 | 17.3 | sbf | 15.22 | — | 1067 | Coma I cld |
| IC 3247 | 122314.0285338 | 7 | 539 | 25.4 | tf | 15.25 | 137 | 1315 | Coma I cld |
| IC 3308 | 122517.9264253 | 8 | 277 | 12.8 | tf | 15.41 | 106 | 657 | Coma I cld |
| IC 3341 | 122623.4274444 | 9 | 338 | 14.0 | tf | 16.4 | 65 | 684 | Coma I cld |
| UGC7699 | 123248.0373718 | 7 | 508 | 14.5 | tf | 13.3 | 162 | 550 | Coma I cld |
| UGC7774 | 123622.5400019 | 7 | 553 | 22.6 | tf | 14.6 | 159 | 1097 | Coma I cld |
| FGC1497 | 124700.6323905 | 8 | 496 | 23.4 | tf | 16.8 | 72 | 1212 | Coma I cld |
| UGC7990 | 125027.2282110 | 10 | 495 | 20.4 | tf | 16.2 | 74 | 994 | Coma I cld |
| UGC12713 | 233814.5304233 | 7 | 578 | 12.2 | tf | 14.81 | 85 | 313 | LOG506 |
| Gal | RA,Dec. | |||||
| (1) | (2) | (3) | (4) | (5) | (6) | (7) |
| Group N3990 | ||||||
| NGC3900 | J114909.5+270119 | 1743 | 1 | 8.69 | 30.3 | tf |
| UGC06791 | J114923.7+264430 | 1795 | 7 | 11.32 | 31.8 | tf |
| NGC3912 | J115004.4+262844 | 1725 | 3 | 9.94 | — | |
| KUG1148+258A | J115039.9+253134 | 1748 | 7 | 14.10 | — | |
| Group N4062 | ||||||
| NGC4020 | J115856.9+302449 | 726 | 6 | 10.75 | 14.3 | tf |
| IC2984 | J115907.5+304151 | 683 | 9 | 13.27 | — | |
| UGC07007 | J120133.2+332029 | 758 | 9 | 13.88 | — | |
| NGC4062 | J120403.8+315345 | 745 | 5 | 8.20 | 14.5 | tf |
| Group N4150 | ||||||
| UGC07131 | J120911.8+305424 | 224 | 8 | 13.18 | 16.8 | tf |
| NGC4150 | J121033.7+302406 | 197 | 2 | 8.98 | 13.7 | sbf |
| KK127 | J121323.6+295519 | 122 | 9 | 13.99 | 17.3 | tf |
| IC0779 | J121938.8+295259 | 252 | 1 | 11.79 | 17.3 | sbf |
| Group N4151 | ||||||
| KUG1154+400 | J115725.3+394552 | 1019 | 9 | 12.46 | — | |
| SDSS | J120002.4+424723 | 1031 | 1 | 14.72 | — | |
| SDSS | J120751.6+413347 | 1098 | 9 | 15.58 | — | |
| SDSS | J120824.5+412405 | 955 | 9 | 14.84 | — | |
| UGC07129 | J120855.1+414427 | 950 | 2 | 10.56 | — | |
| NGC4143 | J120936.1+423203 | 1002 | 2 | 7.85 | 14.8 | sbf |
| UGC07146 | J120949.2+431405 | 1101 | 7 | 14.00 | — | |
| NGC4145 | J121001.5+395302 | 1032 | 7 | 8.47 | 14.1 | tf |
| NGC4151 | J121032.6+392421 | 1001 | 2 | 7.37 | 15.4 | tf |
| UGC07175 | J121055.4+394524 | 1173 | 8 | 12.52 | — | |
| KKH076 | J121121.8+383228 | 1094 | 10 | 15.34 | 12.4 | tf |
| UGC07207 | J121219.2+370049 | 1057 | 8 | 12.56 | 14.5 | tf |
| PGC166134 | J122207.0+394442 | 1098 | 10 | 14.66 | 16.9 | tf |
| NGC4369 | J122436.2+392259 | 1053 | 1 | 8.91 | — | |
| (1) | (2) | (3) | (4) | (5) | (6) | (7) |
| Group N4244 | ||||||
| KUG1207+367 | J120956.5+362604 | 341 | 10 | 14.12 | 4.83 | rgb |
| NGC4190 | J121344.7+363803 | 235 | 9 | 12.46 | 2.82 | rgb |
| UGCA276 | J121457.9+361308 | 287 | 10 | 12.96 | 2.86 | rgb |
| NGC4214 | J121539.2+361937 | 296 | 9 | 7.90 | 2.94 | rgb |
| NGC4244 | J121729.7+374826 | 256 | 6 | 7.72 | 4.49 | rgb |
| UGC07559 | J122705.2+370833 | 233 | 10 | 11.75 | 4.87 | rgb |
| UGC07599 | J122828.6+371401 | 294 | 8 | 12.42 | 4.70 | rgb |
| UGC07605 | J122838.9+354303 | 316 | 10 | 12.50 | 4.43 | rgb |
| Group N4274 | ||||||
| NGC4173 | J121221.4+291225 | 1093 | 7 | 10.65 | 14.0 | tf |
| PGC166125 | J121319.1+282522 | 991 | 10 | 16.42 | 15.4 | tf |
| UGC07300 | J121643.3+284350 | 1179 | 10 | 12.64 | 14.1 | tf |
| CS1008 | J121651.4+290318 | 1100 | 8 | 15.29 | — | |
| MAPS-NGP | J121703.4+285451 | 810 | 8 | 15.50 | — | |
| NGC4245 | J121736.8+293629 | 856 | 1 | 8.30 | 15.6 | tf |
| NGC4251 | J121808.3+281031 | 1033 | 2 | 7.72 | 19.6 | sbf |
| NGC4274 | J121950.6+293652 | 900 | 2 | 7.02 | 19.4 | tf |
| NGC4283 | J122020.8+291839 | 1023 | 5 | 9.03 | 15.7 | sbf |
| KUG1218+310 | J122035.9+304757 | 988 | 8 | 13.95 | — | |
| IC3215 | J122210.4+260307 | 975 | 7 | 12.54 | 19.6 | tf |
| NGC4310 | J122226.3+291231 | 878 | 3 | 9.67 | 15.0 | tf |
| NGC4314 | J122232.0+295343 | 959 | 1 | 7.44 | — | |
| VV279b | J122754.0+283801 | 1024 | 10 | 13.13 | — | |
| Group N4565 | ||||||
| NGC4494 | J123124.0+254630 | 1294 | -5 | 6.79 | 17.1 | sbf |
| NGC4525 | J123351.2+301639 | 1158 | 7 | 9.98 | 13.6 | tf |
| NGC4562 | J123534.8+255100 | 1315 | 7 | 11.12 | 15.1 | tf |
| IC3571 | J123620.1+260503 | 1224 | 10 | 15.37 | — | |
| NGC4565 | J123620.8+255916 | 1192 | 3 | 5.50 | 16.2 | sbf |
| NGC4670 | J124517.1+270732 | 1046 | 9 | 10.40 | — | |
| KUG1247+260 | J124940.6+254621 | 1262 | 8 | 14.10 | — | |
| NGC4725 | J125026.6+253003 | 1180 | 2 | 6.06 | 12.4 | cep |
| KUG1249+263 | J125144.4+260638 | 1209 | 10 | 13.83 | 9.2 | tf |
| NGC4747 | J125146.0+254638 | 1162 | 7 | 10.28 | 10.8 | tf |
| MRK1338 | J125310.1+251642 | 1075 | 9 | 12.78 | — | |
| (1) | (2) | (3) | (4) | (5) | (6) | (7) |
|---|---|---|---|---|---|---|
| Group N4631/N4278 | ||||||
| IC2992 | J120515.9+305120 | 583 | 9 | 12.43 | 12.7 | tf |
| MAPS-NGP | J120634.5+312033 | 542 | 8 | 13.81 | — | |
| NGC4136 | J120917.7+295539 | 576 | 6 | 9.30 | — | |
| CGCG158-058 | J121707.4+303836 | 690 | 9 | 12.40 | — | |
| NGC4278 | J122006.8+291651 | 620 | -5 | 7.21 | 16.1 | sbf |
| MAPS-NGP | J122017.5+290608 | 673 | 8 | 15.24 | — | |
| NGC4286 | J122042.1+292045 | 615 | 7 | 10.81 | 11.6 | tf |
| 2MASX | J122116.6+290222 | 639 | 1 | 13.80 | — | |
| NGC4308 | J122156.9+300427 | 591 | -5 | 10.61 | — | |
| UGC07438 | J122219.5+300342 | 669 | 8 | 13.59 | — | |
| MAPS-NGP | J122252.7+334943 | 566 | 10 | 15.65 | — | |
| UGC07457 | J122309.7+292059 | 632 | 1 | 12.81 | — | |
| IC3247 | J122313.9+285339 | 539 | 7 | 12.11 | 25.4 | tf |
| MAPS-NGP | J122357.4+293547 | 739 | 8 | 14.22 | — | |
| NGC4393 | J122551.2+273342 | 723 | 7 | 12.00 | — | |
| NGC4414 | J122627.1+311325 | 703 | 5 | 6.71 | 19.9 | tf |
| NGC4448 | J122815.4+283713 | 627 | 2 | 7.80 | 23.8 | tf |
| UGC07673 | J123158.1+294233 | 623 | 10 | 12.92 | — | |
| NGC4559 | J123557.7+275735 | 787 | 6 | 7.47 | 8.1 | tf |
| KUG1234+299 | J123714.0+293752 | 740 | 8 | 13.78 | — | |
| KDG178 | J124010.0+323932 | 774 | 10 | 15.14 | — | |
| CG1042 | J124147.1+325125 | 696 | 10 | 13.57 | — | |
| NGC4627 | J124159.7+323425 | 812 | -5 | 8.83 | 9.4 | sbf |
| NGC4631 | J124208.0+323229 | 614 | 7 | 6.46 | 7.31 | rgb |
| MCG+06-28-022 | J124307.1+322926 | 895 | 8 | 13.21 | — | |
| NGC4656 | J124357.7+321013 | 643 | 9 | 10.90 | 5.4 | tf |
| UGC07916 | J124425.1+342312 | 614 | 10 | 14.57 | 9.1 | tf |
| FGC1497 | J124700.6+323905 | 521 | 8 | 15.37 | 23.4 | tf |
| Gal | RA,DEC | |||||
|---|---|---|---|---|---|---|
| (1) | (2) | (3) | (4) | (5) | (6) | (7) |
| UGC06570 | J113550.0+352007 | 1580 | 8 | 10.72 | 14.9 | tf |
| UGC06603 | J113802.1+351213 | 1617 | 7 | 13.01 | 26.2 | tf |
| NGC3755 | J113633.4+362437 | 1557 | 5 | 10.59 | 32.0 | tf |
| HS1134+3639 | J113654.7+362316 | 1583 | 9 | 14.88 | — | |
| 2MASX | J113901.3+312916 | 2705 | 4 | 11.88 | — | |
| NGC3786 | J113942.5+315433 | 2673 | 4 | 9.33 | — | |
| NGC3788 | J113944.7+315552 | 2639 | 3 | 9.34 | — | |
| KUG1138+327 | J114107.4+322537 | 1704 | 10 | 14.13 | — | |
| MRK0746 | J114129.9+322059 | 1684 | 9 | 14.17 | — | |
| UGC06684 | J114320.9+312718 | 1753 | 7 | 12.12 | 32.9 | tf |
| UGC06684N1 | J114332.7+312728 | 1794 | 9 | 12.79 | — | |
| IC2957 | J114537.0+311758 | 1752 | 2 | 11.46 | 30.9 | tf |
| NGC3930 | J115146.0+380054 | 921 | 5 | 11.18 | 16.7 | tf |
| NGC3941 | J115255.4+365911 | 922 | 0 | 7.31 | 12.2 | sbf |
| UGC06955 | J115829.8+380433 | 911 | 8 | 11.34 | 14.9 | tf |
| KDG083 | J115614.5+311816 | 617 | 8 | 11.31 | 13.4 | tf |
| KUG1157+315 | J120016.2+311330 | 593 | 8 | 12.87 | 16.1 | tf |
| LSBCF573-03 | J120942.6+200252 | 2416 | 10 | 12.54 | — | |
| KUG1209+203 | J121157.7+200140 | 2291 | 9 | 12.47 | — | |
| NGC4158 | J121110.2+201033 | 2379 | 4 | 9.73 | — | |
| KUG1209+243 | J121134.9+240144 | 2458 | 10 | 14.63 | — | |
| NGC4162 | J121152.5+240725 | 2512 | 4 | 9.35 | 33.9 | tf |
| NGC4203 | J121505.1+331150 | 1078 | 1 | 7.40 | 15.1 | sbf |
| UGC07428 | J122202.5+320543 | 1125 | 8 | 12.83 | - | |
| IC0777 | J121923.8+281836 | 2495 | 4 | 11.03 | 51.0 | tf |
| KUG1217+288 | J121956.6+283319 | 2455 | 9 | 14.16 | — | |
| KUG1218+387 | J122054.9+382549 | 581 | 9 | 12.97 | — | |
| KDG105 | J122143.0+375914 | 582 | 10 | 15.07 | — |
| (1) | (2) | (3) | (4) | (5) | (6) | (7) |
|---|---|---|---|---|---|---|
| UGC07584 | J122802.8+223516 | 543 | 9 | 13.75 | 9.2 | tf |
| LSBCF573-01 | J122805.0+221727 | 543 | 10 | 14.56 | 7.5 | tf |
| NGC4793 | J125440.7+285618 | 2474 | 4 | 8.48 | 24.4 | tf |
| KISSR0148 | J125445.2+285529 | 2336 | 10 | 15.60 | — | |
| NGC4789A | J125405.2+270859 | 355 | 10 | 11.65 | 3.91 | rgb |
| LSBCD575-05 | J125540.5+191233 | 362 | 10 | 14.06 | 5.5 | tf |
| NGC4826 | J125643.8+214052 | 365 | 2 | 5.31 | 4.44 | rgb |
| Galaxy | J2000 | |||||
|---|---|---|---|---|---|---|
| (1) | (2) | (3) | (4) | (5) | (6) | (7) |
| UGC06499 | J113011.3+355208 | 2204 | 8 | 13.66 | 38.5 | tf |
| MRK0424 | J113027.7+364414 | 1974 | 9 | 12.82 | 29.3 | tf |
| KUG1127+385 | J113033.3+381427 | 1926 | 4 | 12.78 | — | |
| NGC3712 | J113109.1+283405 | 1527 | 8 | 11.69 | 28.0 | tf |
| KUG1128+257 | J113122.1+253005 | 2796 | 7 | 14.16 | 44.7 | tf |
| UGC06509 | J113122.7+230655 | 2827 | 7 | 12.49 | 33.9 | tf |
| UGC06512 | J113144.6+342000 | 1845 | 8 | 12.65 | 28.4 | tf |
| UGC06517 | J113202.4+364153 | 2472 | 4 | 11.10 | 41.1 | tf |
| UGC06526 | J113239.3+351942 | 1832 | 6 | 11.03 | 18.3 | tf |
| UGC06531 | J113249.0+390505 | 1565 | 6 | 12.45 | — | |
| KUG1130+337 | J113330.2+333026 | 2570 | 5 | 11.84 | — | |
| UGC06545 | J113343.4+323810 | 2586 | 3 | 10.65 | — | |
| CGCG186-009 | J113427.6+331044 | 2468 | 2 | 11.05 | — | |
| UGC06561 | J113526.7+331810 | 2396 | 7 | 13.03 | 33.1 | tf |
| WAS24 | J113602.6+322308 | 2709 | 9 | 14.04 | — | |
| UGC06599 | J113742.5+240755 | 1496 | 8 | 14.17 | 38.8 | tf |
| UGC06610 | J113844.2+334821 | 1826 | 7 | 13.00 | 34.0 | tf |
| UGC06637 | J114024.9+282226 | 1787 | 9 | 11.72 | 34.6 | tf |
| MRK0426 | J114049.1+351212 | 1504 | 7 | 12.29 | 21.9 | tf |
| NGC3813 | J114118.7+363248 | 1456 | 4 | 8.86 | 23.0 | tf |
| UGC06658 | J114202.4+320003 | 1434 | 6 | 12.59 | — | |
| MRK0429 | J114626.0+345109 | 1365 | 5 | 11.43 | — | |
| UGC06782 | J114857.2+235016 | 452 | 10 | 12.67 | 13.7 | bs |
| UGC06792 | J114923.4+394619 | 858 | 7 | 11.95 | 20.8 | tf |
| UGC06817 | J115053.0+385249 | 251 | 10 | 10.98 | 2.64 | rgb |
| MRK0641 | J115227.4+345340 | 2196 | 9 | 13.95 | — | |
| UGC6881 | J115444.7+200320 | 519 | 10 | 14.50 | 16.4 | tf |
| KDG82 | J115539.4+313110 | 560 | 8 | 12.41 | 13.6 | tf |
| BTS076 | J115844.1+273506 | 451 | 10 | 14.05 | — | |
| NGC4032 | J120032.8+200426 | 1173 | 7 | 10.37 | 10.4 | tf |
| 2MASX | J120105.9+285943 | 2910 | 3 | 13.44 | — | |
| BTS089 | J120147.0+282138 | 799 | 10 | 14.06 | — | |
| KUG1201+292 | J120404.7+285853 | 874 | 9 | 12.67 | — | |
| NGC4080 | J120451.8+265933 | 533 | 8 | 10.78 | 15.0 | tf |
| KUG1202+286 | J120523.3+282156 | 527 | 8 | 13.15 | — | |
| DDO109 | J120723.6+394846 | 894 | 10 | 12.72 | 10.2 | tf |
| UGC07125 | J120842.3+364810 | 1074 | 8 | 12.64 | 23.1 | tf |
| MAPS-NGP | J120921.2+251203 | 719 | 9 | 15.10 | — | |
| UGC07143 | J120946.7+250134 | 2520 | 4 | 11.70 | 35.8 | tf |
| KUG1209+255 | J121206.5+251833 | 2542 | 10 | 15.13 | — |
| (1) | (2) | (3) | (4) | (5) | (6) | (7) |
|---|---|---|---|---|---|---|
| NGC4163 | J121209.2+361009 | 166 | 10 | 12.85 | 2.96 | rgb |
| UGC07236 | J121349.1+241553 | 887 | 10 | 13.81 | — | |
| UGC07257 | J121503.0+355731 | 943 | 8 | 12.25 | 8.8 | tf |
| NGC4204 | J121514.4+203931 | 782 | 7 | 11.83 | 8. | txt |
| UGC07321 | J121734.0+223223 | 345 | 7 | 10.65 | 17.2 | tf |
| NGC4275 | J121952.6+273715 | 2276 | 5 | 10.18 | — | |
| UGC07427 | J122155.0+350305 | 725 | 10 | 14.09 | 9.7 | tf |
| NGC4359 | J122411.1+313118 | 1231 | 5 | 10.80 | 24.0 | tf |
| UGC07485 | J122422.2+210936 | 847 | 9 | 13.25 | — | |
| IC3308 | J122518.2+264254 | 277 | 8 | 13.00 | 12.8 | tf |
| KK144 | J122527.9+282857 | 453 | 10 | 14.02 | — | |
| NGC4395 | J122548.9+333248 | 313 | 9 | 9.97 | 4.67 | rgb |
| IC3341 | J122623.4+274444 | 338 | 9 | 11.57 | 14.0 | tf |
| NGC4455 | J122844.1+224921 | 588 | 7 | 10.63 | 8.4 | tf |
| UGC07678 | J123200.4+394955 | 714 | 9 | 12.47 | 6.9 | tf |
| UGC07699 | J123248.0+373718 | 520 | 7 | 11.15 | 14.5 | tf |
| UGC07697 | J123251.6+201101 | 2468 | 5 | 12.93 | 38.5 | tf |
| UGC07698 | J123254.4+313228 | 322 | 10 | 10.63 | 4.85 | rgb |
| NGC4509 | J123306.8+320530 | 906 | 9 | 12.70 | 10.1 | tf |
| KUG1230+336 | J123324.9+332103 | 836 | 10 | 13.57 | 5.3 | tf |
| UGC07719 | J123400.6+390110 | 707 | 8 | 12.33 | 9.2 | tf |
| NGC4534 | J123405.4+353108 | 810 | 8 | 11.21 | 9.8 | tf |
| MAPS-NGP | J123521.0+273347 | 1470 | 9 | 14.59 | — | |
| UGC7774 | J123622.5+400019 | 553 | 7 | 12.53 | 22.6 | tf |
| MAPS-NGP | J123649.4+333648 | 522 | 8 | 14.48 | 11.7 | tf |
| UGCA290 | J123721.8+384438 | 481 | 10 | 13.33 | 6.70 | rgb |
| UGCA292 | J123840.1+324601 | 306 | 10 | 13.63 | 3.62 | rgb |
| UGC07816 | J123856.9+380525 | 2252 | 1 | 13.32 | — | |
| PGC166140 | J124131.1+394847 | 669 | 10 | 14.69 | — | |
| IC3687 | J124215.1+383007 | 385 | 10 | 11.30 | 4.57 | rgb |
| BTS150 | J124312.8+352447 | 1819 | 10 | 15.00 | — | |
| UGCA294 | J124438.3+282819 | 925 | 9 | 12.46 | 9.9 | tf |
| IC3740 | J124530.6+204857 | 2602 | 4 | 12.81 | — | |
| UGCA298 | J124655.4+263351 | 774 | 9 | 12.42 | — | |
| DDO147 | J124659.8+362835 | 351 | 10 | 12.69 | 5.4 | tf |
| UGC07990 | J125027.2+282110 | 495 | 10 | 14.59 | 20.4 | tf |
| IC3840 | J125146.1+214407 | 536 | 10 | 14.38 | 5.5 | tf |
| UGC08011 | J125221.1+213746 | 716 | 10 | 15.49 | 20.0 | tf |
| UGC08030 | J125429.4+261818 | 604 | 10 | 15.61 | 10.9 | tf |
| BTS160 | J125526.9+325905 | 906 | 7 | 15.20 | — | |
| UGCA309 | J125617.8+343917 | 747 | 10 | 13.11 | — | |
| PGC166151 | J125901.0+352852 | 723 | 7 | 14.77 | — | |
| NGC4861 | J125902.3+345134 | 862 | 10 | 11.76 | 5.7 | tf |
| Group | ||||||||||
|---|---|---|---|---|---|---|---|---|---|---|
| N3900 | 4 | 1745 | 30 | 227 | 10.74 | 11.31 | 0.57 | 2 | 32.46 | 0.10 |
| 291 | 10.96 | 11.42 | 0.46 | |||||||
| N4062 | 4 | 736 | 33 | 175 | 10.08 | 11.92 | 1.84 | 2 | 30.80 | 0.02 |
| 247 | 10.38 | 12.07 | 1.69 | |||||||
| N4150 | 4 | 211 | 56 | 56 | 8.68 | 11.61 | 2.93 | 4 | 31.05 | 0.21 |
| 310 | 10.17 | 12.35 | 2.18 | |||||||
| N4151 | 14 | 1031 | 69 | 348 | 11.03 | 12.56 | 1.53 | 6 | 30.83 | 0.21 |
| 363 | 11.07 | 12.58 | 1.51 | |||||||
| N4244 | 8 | 291 | 38 | 76 | 9.71 | 11.60 | 1.89 | 8 | 27.95 | 0.51 |
| 73 | 9.67 | 11.58 | 1.91 | |||||||
| N4274 | 14 | 990 | 102 | 256 | 11.22 | 12.70 | 1.48 | 9 | 31.06 | 0.29 |
| 303 | 11.36 | 12.77 | 1.41 | |||||||
| N4565 | 11 | 1191 | 83 | 301 | 11.83 | 12.98 | 1.15 | 6 | 30.73 | 0.36 |
| 255 | 11.69 | 12.91 | 1.22 | |||||||
| N4631 | 28 | 635 | 90 | 243 | 11.12 | 12.98 | 1.86 | 11 | 30.41 | 1.31 |
| 333 | 11.40 | 13.12 | 1.72 |