Formation of iron nitride thin films with Al and Ti additives
Abstract
In this work we investigate the process of iron nitride (Fe-N) phase formation using 2Al or 2Ti as additives. The samples were prepared with a magnetron sputtering technique using different amount of nitrogen during the deposition process. The nitrogen partial pressure () was varied between 0-50% (rest Argon) and the targets of pure Fe, [Fe+Ti] and [Fe+Al] were sputtered. The addition of small amount of Ti or Al results in improved soft-magnetic properties when sputtered using 10. When is increased to 50 non-magnetic Fe-N phases are formed. We found that iron mononitride (FeN) phases (N50) are formed with Al or Ti addition at =50 whereas in absence of such addition phases (N30) are formed. It was found that the overall nitrogen content can be increased significantly with Al or Ti additions. On the basis of obtained result we propose a mechanism describing formation of Fe-N phases Al and Ti additives.
pacs:
68.55.-a, 61.05.Qr, 77.84.-s,81.15.CdI Introduction
Reactive sputtering of iron with nitrogen results in nanocrystallization and amorphization of the deposited films. Hellgren_PR99 ; Babonneau_APL03 ; Gupta_PRB02 ; Gupta_JJPS04 ; Gupta:PRB05 This happens due to incorporation of nitrogen atoms at the interstitial sites resulting in expansion and distortion of bcc-Fe units cells. This essentially implies that reactive nitrogen sputtering plays an important role in refining the grain sizes. As the grain size decreases below the ferromagnetic exchange length (20 nm for Fe) the averaging is done on very fine grains and magnetization follow the easy direction of each individual grain. This results in very low coercivity. Further, as the grain size decreases, there is a significant increase in the volume fraction of grain boundaries or interfaces. Therefore, the value of saturation magnetization is reasonably high. A combined effect results in good soft-magnetic properties in nanocrystalline or amorphous iron nitrides. However, incorporation of nitrogen in iron also results in loss of magnetization due to formation of non magnetic Fe-N compounds due to covalent Fe-N bonds. This leads to magnetic anisotropy and an increase in coercivity. In addition it has been observed in magnetic Fe-N that and nitrogen atoms tend to diffuse out even at very low temperatures. Navio.NJP2010 ; Menendez.JAP01 ; Gupta:AM:2009 Therefore nanocrystalline iron nitrides have these intrinsic limitations in succeeding as good soft-magnetic alloys.
Since early 1990s to recent years, various Fe-N thin films were studied by adding a tiny amount of a third element say , it was observed that using such additives the limitations of binary Fe-N can be reduced to a great extent. Hasegawa:JMSJ:1990 ; Ishiwata:JAP:1991 ; Ono:JAP:1993 ; Takeshima:JAP:1993 ; Qiu:JAP:1994 ; Roozeboom:JAP:1995 ; Viala:JAP:1996 ; Wang:JPCM:1997 ; Varga:JAP:1998 ; Chen:JAP:2000 ; Liu:APL:2000 ; Chezan:PSSA:2002 ; Rantschler:JAP:2003 ; Liu:JAP:2003 ; Chechenin:JPCM:2003 ; Kazmin:TPL:2005 ; Das:PRB:2007 ; Sangita:PRB:2008 ; FengXu:JAP:2011 The basic idea behind adding such element was to chose an element which has more affinity to nitrogen than iron. When a third element = Al, Ti, Ta, Zr etc. is added in an appropriate amount it can be substitutionally dissolved in to bcc-Fe unit cell. Das:PRB:2007 This addition results in increased thermal stability of the system as the binding energy of the system increases because the heat of formation of -N is less than Fe-N. Viala:JAP:1996 Therefore element works like a trap for nitrogen diffusing out. Although many third elements have been used in Fe--N system, the choice of element has been rather arbitrary. For example earlier works were mainly focused on Fe-Ta-N systems Ishiwata:JAP:1991 ; Takeshima:JAP:1993 ; Qiu:JAP:1994 ; Viala:JAP:1996 ; Varga:JAP:1998 , more recently other elements e.g. Ti Wang:JPCM:1997 ; Ding:JAP:2002 ; Rantschler:JAP:2003 ; Das:PRB:2007 , Al Liu:JAP:2003 ; Kazmin:TPL:2005 , Zr Chezan:PSSA:2002 ; Chechenin:JPCM:2003 and Rh Chen:JAP:2000 etc. have been used.
In this work we have chosen = Al, Ti in Fe--N, as the atomic radii = 0.156 nm is larger than = 0.118 nm but smaller than = 0.176 nm. Clementi:JCP:1967 Therefore, Ti addition is expected to expand the units cell of Fe when substitutionally dissolved whereas no such expansion is expected with Al addition. By adding similar amount of Ti and Al i.e. 2we systematically studied formation of Fe-N phases. The addition of small amount of Al or Ti has been reported to increase the thermal stability of Fe-N. Liu:APL:2000 ; MSEB:2003:Ma ; Wang:JPCM:1997 ; JPCM:Jiang:1997 It may be noted that though the heat of formation of TiN and AlN is almost similar, Kopcewicz:JAP:1995 their affinity to N is different. Viala:JAP:1996 Therefore the mechanism by which addition of element affects formation of Fe-N phases is not very clear. In addition, the studies with addition of element in Fe--N system have been mainly focused to magnetic phases where small amount of reactive nitrogen is used during sputtering. In the present work we investigate for the first time the effect of Al or Ti addition on formation of non-magnetic iron nitride phases. Recently, non-magnetic iron mononitrides have emerged as a promising material in spintronics applications. Wit:PRL94 ; MG:JAC2001 ; Navio.PRB08 ; Navio:APL:2009 A controlled annealing of FeN produces the -Fe4N phase and thus provides a source of spin injection for semiconductors or diluted magnetic semiconductors Gallego.PRB04 .
In our approach we have taken extreme care to deposit a series of samples in a single sputtering run so as to ensure identical depositions conditions. The amount of reactive nitrogen was successively increased from 0-50% with a step of 5%. The structure of deposited phases was studied using x-ray diffraction. In order to measure magnetic moment of the samples precisely, we used polarized neutron reflectivity. The magnetization measurements were carried out using a SQUID magnetometer and conversion electron Mössbauer spectroscopy.
II Experimental
Thin film samples were prepared at room temperature using a direct current magnetron sputtering (dc-MS) deposition system. The samples were prepared simultaneously on Si (100) and float glass substrates. A mixture of argon and nitrogen gases at different ratio was used to sputter a target. The total gas flow was kept constant at 20 standard cubic centimeter per minute (sccm). The nitrogen partial pressure defined as = /(+) was varied at 0, 5, 10, 15, 20, 25, 30, 35, 40 and 50. A base pressure of mbar was achieved prior to deposition. During the deposition the partial pressure in the chamber was mbar. The targets of pure Fe, and composite targets of [Fe+Ti], and [Fe+Al] were sputtered using a power of 50 W. Before deposition the vacuum chamber was repeatedly flushed with argon and nitrogen gases so as to minimize the possible contamination of trapped gases inside the vacuum chamber. The targets were pre-sputtered at least for 10 minutes in order to remove possible surface contaminations.
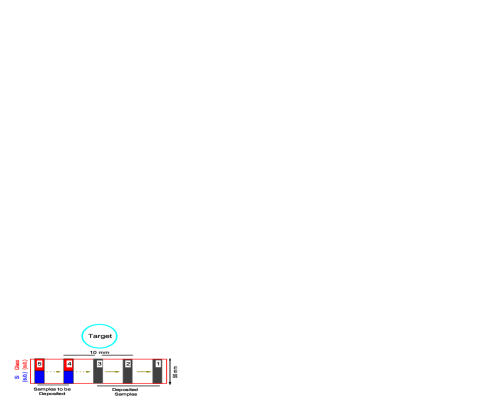
In order to achieve similar deposition conditions for a set of samples i.e. sputtering of Fe, [Fe+Ti] or [Fe+Al] targets all parameters were kept constant, except . On a 99.95 pure target of Fe, small pieces of 99.999 pure Al or 99.99 Ti were pasted using a silver epoxy paste. Thin films of different were prepared without exposing the deposition chamber to the atmosphere. The targets were covered with a small slit of size about 10 mm and the substrate was exposed at center of the target. After deposition at a particular , the substrate was translated using a computer controlled linear translation stage. Once deposition of a sample at a particular is completed, the gas flows were changed using mass flow controllers and monitored using a residual gas analyzer until a stable gas ratio is obtained. Such a procedure minimized the variation in deposition conditions which might occur otherwise. A schematic diagram of target and substrate configuration is shown in fig. 1. A total of 10 samples were deposited at various in a series. On a glass substrate of 250 mm, Si (100) substrates were mounted on position 1 to 10 (schematically shown in fig. 1 for positions 1 to 5). The thickness of the films was calibrated with x-ray reflectivity and by using different deposition times it was kept at about 100 nm for all samples prepared in this work.
The composition of deposited Fe-Ti and Fe-Al films (prepared without nitrogen) was determined using energy dispersive x-ray analysis installed in a scanning electron microscope. The obtained composition are and . The structural characterizations of the samples were carried using x-ray diffraction (XRD) using a standard x-ray diffractometer (Bruker D8 Advance) equipped with Cu K- x-rays in -2 mode. A 1-D position sensitive detector based on silicon strips technology (Bruker LynxEye) was used. By using using such detector it was possible to obtained XRD data with good statistics. The magnetization measurements were carried out using a Quantum design SQUID magnetometer and polarized neutron reflectivity (PNR). The PNR measurements were performed at (AMOR) Gupta_PramJP04 and NARZISS neutron reflectometers at SINQ/PSI, Switzerland. The Conversion electron Mössbauer spectroscopy (CEMS) measurements were carried out at room temperature using a source embedded in a rhodium matrix. The conversion electrons were detected by a proportional counter having continuous flow of a helium-methane (5 methane balance helium) gas mixture.
III Results
III.1 X-ray diffraction
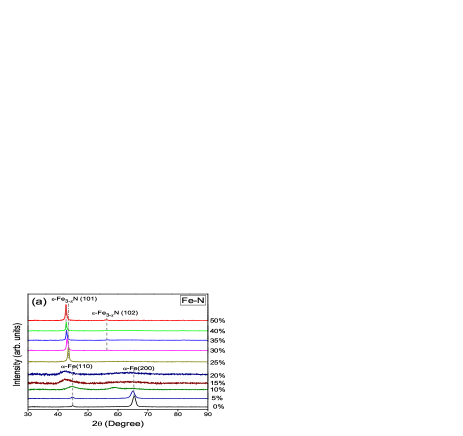
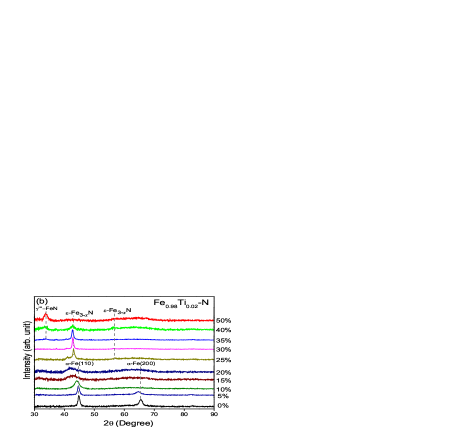
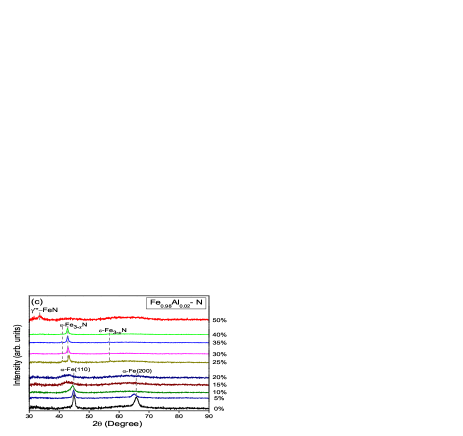
Fig. 2 shows the XRD pattern of Fe-N samples prepared using = 0-50. The obtained structural changes are similar as observed in an earlier work. Gupta:PRB05 Here, samples without Al or Ti additions were essentially prepared as a reference so that effect of alloying elements can be compared precisely. However, as we use a small slit of 10 mm to control over the deposition area there are some interesting features we observed in the XRD patterns shown in fig. 2 (a) -(c). It may be noted that nitrogen free (= 0) sample have a bcc--Fe structure with preferred orientation along (200) direction. Normally pure iron thin films are expected to align in (110) direction. The preferred orientation along (200) direction was caused by the small slit placed beneath the target as shown in fig. 1. Such slit was necessary to control deposition area so as to deposit ten samples with different . This slit basically reduced the number of adatoms depositing on a substrate. In this situation preferred orientation may change from (110) to (200) direction as the surface energy of (200) plane is lower than that of (110) plane. However, when no such slit is used the large influx of adatoms may give rise to some strain which results in preferred orientation along (110) direction. Such behaviour with sputtering power has been observed in case of Ti Oh:JAP:93 and with substrate biasing in case of Cr Feng:JAP:94 . However, as we observe from fig. 2 (a) with reactive sputtering, the preferred orientation seems to change from (200) to (110) direction. This effect is more prominent when samples were prepared with addition of Al or Ti. As discussed later in section IV, reactive sputtering with nitrogen or with Al or Ti additions, the deposited films cause strain in the Fe and in this case the strain energy may dominate over the surface free energy.
| Fe-N | -N | -N | |
|---|---|---|---|
| 0 | 9.0(0.3) | 11.3(0.3) | 10.3(0.3) |
| 5 | 7.8(0.2) | 11(0.3) | 9.6(0.3) |
| 10 | 2.4(0.3) | 3.8(0.1) | 4.1(0.1) |
| 15 | amorphous | amorphous | amorphous |
We will first analyze the XRD pattern of samples prepared without Al or Ti additions as shown in fig. 2 (a). Here the line width of the diffracted pattern can be used to calculate the grain size of the diffracting specimen in the direction perpendicular to the plane of the film using Scherrer formula,Cullity_XRD ; Scherrer_Eq:NatureNano:2011 = 0.9/ , where is the grain size, is an angular width in terms of 2, is the Bragg angle and is the wavelength of the radiation used. Although the boundary between nanocrystalline and amorphous phases may not be sharp, the obtained grain sizes (see table 1) may be used to identify the structure as nanocrystalline or amorphous. For pure iron sample the grain size calculated using (110) reflection is 9.0 nm which decreases slightly to 7.8 nm when sputtered using = 5. When is increased to 10, the estimated grain size is about 2.4 nm therefore at this partial pressure it may be difficult to label the structure as nanocrystalline or amorphous. Above this , the peaks are broad enough to identify them as amorphous. This amorphous phase persists up to nitrogen partial pressure of 20 and for 25, compounds are obtained. Since the heat of formation for phases is about (-40 to -45 as compared with neighboring, e.g., (-12 ) or (-34 ), phases. Tessier_SSS00 Therefore from the energetics of binary iron nitrides at room temperature it is expected that phase should be readily formed as enough reactive nitrogen is made available which may be the case when exceeds 25.
On the basis of amount of nitrogen partial pressure used, the phases formed can be divided into three ranges: (i) 10, where nanocrystalline Fe-N phases are formed (ii) = 10 - 20, where amorphous Fe-N phase are obtained and (iii) 25, where or -Fe-Nphases (with addition of Al or Ti) are obtained. We will now discuss the effect of small amount of Al or Ti in formation of iron nitrides in these three ranges.
-
(i)
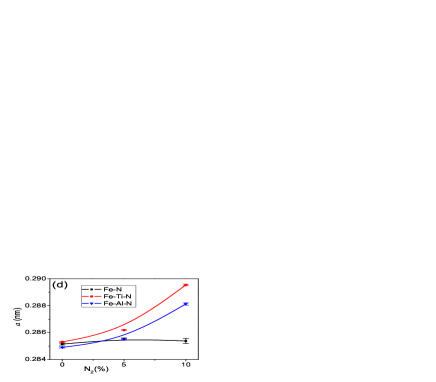
Fig. 2(b) and fig. 2(c) shows the XRD pattern of samples with addition of Al and Ti, respectively for different . For nitrogen free samples, the average grain size is about 9 nm (see table 1) which increases slightly to 11.3 nm with Ti addition and 10.3 nm with Al addition. At = 5, the grain sizes decreases slightly both with Al or Ti additions. At = 10, the grain sizes decrease appreciably to about 4 nm. The positions of Bragg peaks shift to lower-angle side when is increased from 0-10 although the basic structure remains same. This happens as nitrogen atoms occupy interstitial sites within the bcc unit cell. The lattice parameter () can be calculated for (110) peak and is plotted in fig. 2 (d). As can be seen here with Al or Ti additions increases more significantly. The reasons for such behaviour will be discussed later in section IV.
-
(ii)
For = 15 and 20, amoprhous phase are obtained and here no appreciable effect of Al or Ti addition can be seen in the XRD pattern.
-
(iii)
For between 25-35, the results are similar to Fe-N case where compounds are obtained. However at = 40 and 50 , the results are markedly different. With Ti addition as can be seen in fig. 2 (b) a new phase start appearing for = 40, where as with Al addition this phase is visible only at = 50. This new phase can be indexed as -FeN (confirmed with CEMS measurements shown later) which is iron mononitride and generally formed when iron targets are sputtered using 100 nitrogen. gupta:PRB02 ; Gupta:PRB05 ; MG:JAC:2011 Formation of this high nitrogen phase with Al or Ti addition can be understood with an enhancement of nitrogen incorporation. Although -FeN phase can be obtained when sputtered only with nitrogen as sputtering gas, formation of this phase with a 50 Ar+50 N2 mixture with Al or Ti addition is interesting as deposition rates will much higher as compred to the case when sputtering is done using N2 alone as sputtering gas. The -FeN phase has lowest heat of formation (-47 ) therefore due to enhancement of nitrogen by adding Ti or Al in Fe results in formation of -FeN phase. These results will be discussed in detail in section IV.
III.2 Polarized neutron reflectivity measurements
Polarized neutron reflectivity (PNR) is a technique which is able to yield the absolute value of magnetic moment per atom in a magnetic thin film with high accuracy.Blundell_PRB92 In contrast to bulk magnetization magnetometer technique (e.g. DC extraction, VSM or SQUID), no correction due to diamagnetic signal from the substrate has to be applied in PNR. Further, the samples dimensions and mass does not play any role in determination of magnetic moment. During the experiment, polarized neutrons with spin parallel or antiparallel to the direction of magnetization on the sample are reflected-off the surface of the sample at grazing incidence. The measurements were performed with an applied field of 800 Oe, which is sufficient to reach the saturation magnetization in all the samples.
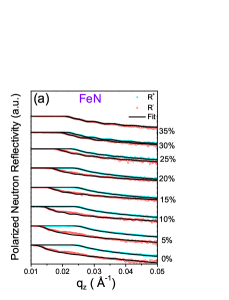
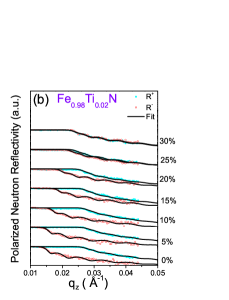
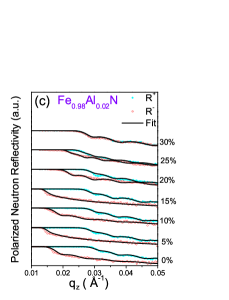
Figure 3 shows PNR pattern of Fe-N, -N and -N samples prepared using different . As the amount of nitrogen partial pressure is increased, the critical edge in spin down reflectivity () shows a shift towards higher qz values, and the separation between and reflectivities decreases continuously. For Fe-N samples and converge for = 35 , whereas in case of -N and -N samples the two reflectivities converge at 30.
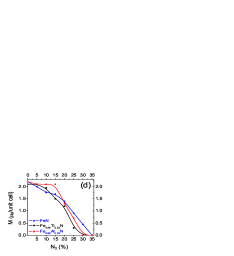
The difference between spin up and down reflectivities is a measure of magnetic moment. The PNR profiles were fitted using a computer programSimulReflec based on Parratt’s formulism. Parratt.PR54 The obtained values of iron magnetic moment () per atom are plotted in fig. 3(d) as a function of . As can be seen here, the magnetic moment decays as nitrogen is added is the system. Up to = 10, this decay is faster when Al or Ti are not added. However, for 20, the decay in magnetic moment is faster with addition of Al or Ti. This result can be understood in terms of formation of Fe-N bonds which are readily formed when additives Al or Ti are not added. As discussed later in section IV, with Al or Ti addition nitrogen essentially interacts with Al or Ti and therefore the magnetic moment of Fe does not decay as fast as it will be when Al or Ti are not added. When is further increased the total amount of nitrogen that can be added into the system is much exceeds due to interaction of Al or Ti with nitrogen. This leads to a faster loss of magnetization in samples prepared with Al or Ti addition for 15. When exceeds 30, the spin up and down reflectivities remain identical indicating that samples are not ferromagnetic.
III.3 Magnetization measurements
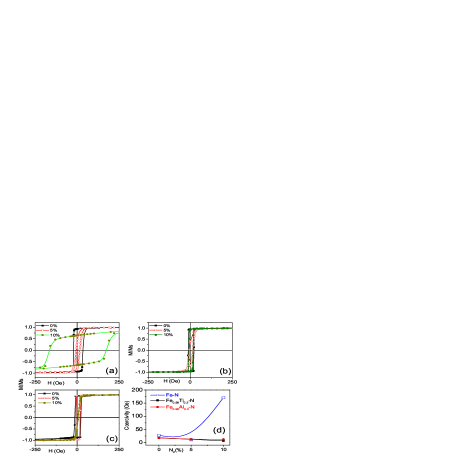
The magnetization measurements on different samples were carried out using a SQUID magnetometer. Fig. 4 shows normalized M-H loops for Fe-N, -N and -N samples prepared using = 0, 5 and 10. The obtained values of coercivity () are plotted in fig. 4 (d). For nitrogen free samples, the value of for Fe thin film is about 30 Oe, which decreases to about 17 Oe, when Al or Ti added. When sputtered using 5 nitrogen, decreases to about 10 Oe. It may be noted that when sputtered using 5 nitrogen the average grain decreases (see table 1). A reduction in grain size below ferromagnetic exchange length allows exchange coupling between the neighboring grains and results in a reduced effective anisotropy. Gupta:PRB05 ; Herzer_IEEE90 ; Herzer_IEEE89 The results obtained for the samples which were prepared using = 10 are very interesting. For the sample prepared without Al or Ti additions, increases significantly to 170 Oe whereas the samples prepared using Al or Ti it further decreases to about 5 Oe. As can be seen from fig. 3(d), the magnetic moment decreases rather slowly with Al or Ti additions. Therefore with Al or Ti additions, soft-magnetic properties can be improved. The obtained results can be understood in terms of structural changes caused by reactive sputtering. When Fe was sputtered with 10 nitrogen, formation of non-magnetic Fe-N covalent bonds may introduce large anisotropy in the system as reported in literature. Gupta:PRB05 Whereas in presence of Al or Ti alloying elements, nitrogen predominantly interacts with these alloying elements and due to formation of finer grain nanocrystalline structure, the coercivity decreases further.
| Parameter | Fe-N | -N | -N |
|---|---|---|---|
| IS1 ( 0.02) | 0.45 | 0.01 | 0.1 |
| IS2 ( 0.02) | 0.38 | 0.64 | 0.66 |
| QS1 ( 0.04) | 0.25 | – | – |
| QS2 ( 0.04) | 0.50 | – | – |
| RA1 ( 3%) | 63 | 54 | 62 |
| RA2 ( 3%) | 37 | 38 | 46 |
III.4 Conversion electron Mössbauer spectroscopy measurements
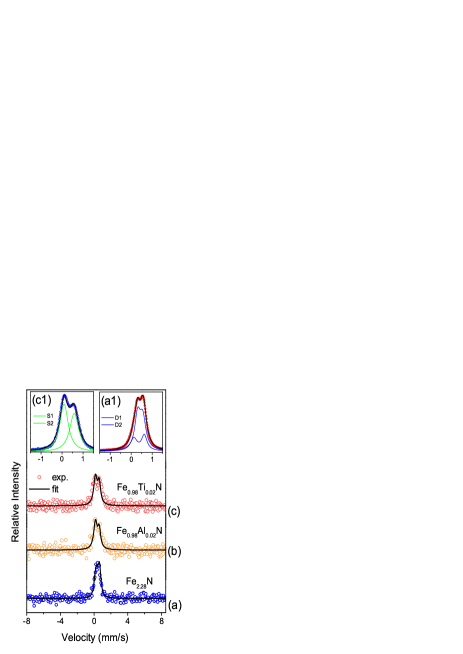
From XRD measurements we observed that at the highest nitrogen partial pressure used in this work, new phases of Fe-N are obtained with Al or Ti addition. Therefore in order to understand the phase formed with Al or Ti addition, we performed conversion electron Mössbauer spectroscopy (CEMS) measurements in the samples prepared using = 50. The measurements were first performed with velocity of the drive between 8.5 mms-1, which is sufficient to cover all resonance lines of magnetic Fe. Fig. 5 shows the CEMS pattern corresponding to Fe-N, -N and -N samples prepared with 50of . The CEMS pattern of the Fe-N samples was found to have asymmetric doublets and no magnetic lines can be seen. In order to get precise information about the samples we prepared Fe-N and -N samples using 57Fe enrichment and the CEMS measurements were performed with a reduced drive velocity between 2 mms-1 to get better CEMS data. The inset of fig. 5 shows CEMS pattern of 57Fe-N and 57-N samples. The patterns with Ti addition are clearly different. From XRD results we find that the Fe-N phase formed has type structure. Therefore in order to fit the observed symmetric doublets we deconvoluted it into two doublets corresponding to Fe-III and Fe-II sites. The fitted parameters are given in table II. These value matches well with reported values for and using the relative area ratio, we obtain the value of x = 0.72 following a procedure given in ref.[ Schaaf_HypInt95 ]. This gives the composition of the sample as .
On the other hand CEMS pattern of samples prepared with Al or Ti addition were different as compared to a sample prepared without such additions. Here it was found that the CEMS pattern is rather more asymmetric. The XRD pattern also revealed that the crystal structure is completely different and correspond to ZnS-type fcc structure. The phase identified was a monoatomic iron nitride having 1:1 atomic ratio Fe and N. As described in the literature, fitting of such patterns can be done considering two singlets. The fitted parameters are given in table II and match well with the reported values. Borsa.HI.2003 ; MG:JAC:2011 Here the singlets with almost zero value of isomer shift corresponds to Fe coordinated tetrahedrally with four N atoms and singlets with higher value of isomer shift corresponds to defects or vacancies. Therefore it can be seen that with Al or Ti addition Fe-N phase having more nitrogen can be obtained.
In an earlier work Liu et al Liu:JAP:2003 investigated CEMS pattern of Fe-Al-N thin films prepared using 2Al in a wide range. In their XRD pattern they also observed a peak around 234 degree, but they identified it as a “signature of Si3N4”. The CEMS pattern of this phase not presented and most probably they overlooked the formation of iron mononitride phase.
IV Discussion
Combining our results obtained from different experimental techniques, we investigate a mechanism leading to formation of iron nitride phases with small addition of Al and Ti. We will first focus on the samples prepared with highest i.e. 50. Here XRD and CEMS results clearly show that having about 30N is formed when additional element is not added. Whereas with Al or Ti addition -Fe-N phase having about 50N is obtained. Clearly with Al or Ti addition more nitrogen can be incorporated in iron nitride even though the amount of reactive nitrogen used during sputtering process remains the same. It can also be seen from XRD pattern that high-N -Fe-N phase already start appearing at =40when Ti is added where with Al addition only is obtained. This indicates that in Ti addition is more effective than Al in increasing nitrogen content in Fe-N. This behavior can also be observed in the PNR data where the magnetic moment falls-off more rapidly with Ti addition as compared to Al addition for 15.
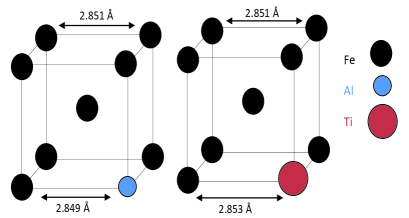
As mentioned before, the atomic radii of Fe is larger than Al but smaller than Ti. Therefore if small amount of Al or Ti is getting substitutionally dissolved in Fe, it is expected that Ti addition should expand the unit cell of Fe while Al addition may not be able todo so. From the XRD measurements performed on samples prepared without reactive nitrogen, we find that the lattice parameter () with Ti addition is 2.853 Å whereas with Al addition it is 2.849 Å. The experimentally obtained value of for pure Fe sample is 2.849 Å. Therefore it appears that Ti addition is expanding the unit cell slightly while Al addition is shrinking it slightly. Such a small changes has been reported in literature with addition of element X. Liu:APL:2000 A schematic representation of this scenario can be understood from fig. 6. With this argument alone we expect that Ti addition should result in incorporation of more nitrogen atoms due to expansion in the unit cell as evidenced in earlier works. Das:PRB:2007 However formation of nearly equiatomic iron mononitride phase with Al addition can not be understood with this argument as the unit cell of Fe is actually shrinking with Al addition. In addition the expansion in unit cell is very small with Ti addition to cause such an increase in N. Therefore distortion in the unit cell caused by Al or Ti addition may not give rise to such a prodigious changes as observed in = 50% samples.
In order to understand the observed results the affinity of element to N and the heat of formation of nitrides should be looked into. In ternary Fe--N systems the affinity between element and N has been defined with an interaction parameter Viala:JAP:1996 . The reported values of values for Ti and Al are (-0.63) and (+0.0025), respectively. It may be noted that these values are obtained at a temperature of about 1600 degree C and their consequences during a sputtering process may be different. Evans:AMIE_Tran:1965 On the other hand the heat of formation of stoichiometric nitrides TiN is -337 kJ mol-1 and that of AlN is -320 kJ mol-1. Kopcewicz:JAP:1995 These values are much larger as compared to FeN which is -47 kJ mol-1. Tessier_SSS00 Therefore it is expected that Ti or Al should be attracting more nitrogen as compared to iron.
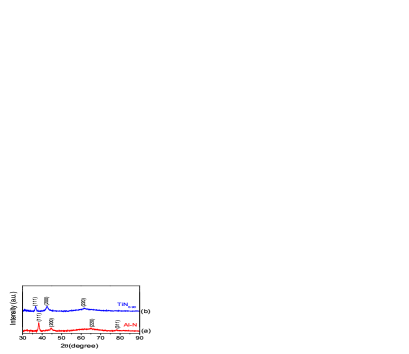
In order to determine the effect of reactive sputtering on Al and Ti, we prepared a series of Al-N and Ti-N samples under identical deposition conditions. Here it would be sufficient to compare the phases formed when Al or Ti are sputtered using = 10%. The XRD pattern of Al-N and Ti-N samples prepared using = 10% are shown in fig. 7. Here we find that the peaks corresponding to Ti-N matches well with reported values for TiN0.91 in JCPDS whereas in case of Al-N we find basically peaks corresponding to fcc-Al. The width of the peaks is larger as compared to pure Al (not shown). From these results it is apparent that Ti is indded attracting more nitrogen as compared to Al. In view of this we can understand formation of nitrogen rich FeN phase already at = 40% with Ti addition whereas this phase shows up at = 50% with Al addition. From fig. 2 (d) it is also clear that as increases from 0-10% the lattice parameter of Fe increases more with Ti addition than with Al addition. In view of above discussion we can also understand the variation in magnetic moment in the deposited samples with .
V Conclusion
In the present work we systematically deposited Fe-N thin films using of small amount (2) of Al or Ti as additive elements at different nitrogen partial pressures. When added in such a small amount Al or Ti get substitutionally dissolved in Fe. Since Al or Ti have more affinity to nitrogen as compared to Fe, nitrides of Al or Ti are formed leading to an enhancement in nitrogen concentration in Fe-N. It was found that the affinity to nitrogen is deterministic in overall nitrogen incorporation rather than the size of additive elements. This was reflected in formation of non-magnetic iron mononitride phases already at 50 nitrogen partial pressure which is not possible in absence of additive elements.
Acknowledgments
We acknowledge DST for providing financial support to carry out NR experiments under its scheme ‘Utilization of International Synchrotron Radiation and Neutron Scattering facilities’. A part of this work was performed at the Swiss Spallation Neutron Source, Paul Scherrer Institute, Villigen, Switzerland. We are thankful to Dr. P. Chaddah for continuous support and encouragement.
References
- (1) N. Hellgren, M. P. Johansson, E. Broitman, L. Hultman, and J.-E. Sundgren, Phys. Rev. 59, 5162 (1999).
- (2) D. Babonneau, M. Jaouen, M.-F. Denanot, P. Guérin, and F. Petroff, App. Phys. Lett. 82, 30565 (2003).
- (3) M. Gupta, A. Gupta, S. Rajagopalan, and A. K. Tyagi, Phys. Rev. B 65, 214204 (2002).
- (4) A. Gupta, M. Gupta, B. A. Dasannacharya, S. Kikuta, Y. Yoda, and M. Seto, J. Jpn. Phys. Soc. 73, 423 (2004).
- (5) R. Gupta and M. Gupta, Phys. Rev. B 72, 024202 (2005).
- (6) C. Navío, M. J. Capitán, J. Álvarez, R. Miranda, and F. Yndurain, New J. Phys. 12, 073004 (2010).
- (7) J. L. Menendez, G. Armelles, A. Cebollada, F. Briones, F. Peiro, F. Guell, A. Cornet, M. L. F. Gubieda, J. Gutierrez, and C. Meyer, J. Appl. Phys. 89, 6314 (2001).
- (8) S. Chakravarty, M. Gupta, A. Gupta, S. Rajagopalan, A. Balamurugan, A. Tyagi, U. Deshpande, M. Horisberger, and T. Gutberlet, Acta Mater. 57, 1263 (2009).
- (9) N. Hasegawa and M. Saito, J. Magn. Soc. Jpn. 14, 313 (1990).
- (10) N. Ishiwata, C. Wakabayashi, and H. Urai, J. Appl. Phys. 69, 5616 (1991).
- (11) H. Ono, M. Fujinaga, T. Yonemoto, and T. Miyagawa, J. Appl. Phys. 73, 2438 (1993).
- (12) Y. Takeshima, N. Ishiwata, T. Korenari, and H. Urai, J. Appl. Phys. 73, 6576 (1993).
- (13) G. Qiu and J. A. Barnard, J. Appl. Phys. 75, 6934 (1994).
- (14) F. Roozeboom and F. W. A. Dirne, J. Appl. Phys. 77, 5293 (1995).
- (15) B. Viala, M. K. Minor, and J. A. Barnard, J. Appl. Phys. 80, 3941 (1996).
- (16) H. Y. Wang, E. Y. Jiang, H. L. Bai, P. Wu, Y. Wang, and F. F. Gong, J. Phys.: Cond. Mat. 9, 8443 (1997).
- (17) L. Varga, H. Jiang, T. J. Klemmer, W. D. Doyle, and E. A. Payzant, J. Appl. Phys. 83, 5955 (1998).
- (18) Y. Chen, C. Qian, C.-Y. Hung, and M. Miller, J. Appl. Phys. 87, 5864 (2000).
- (19) Y.-K. Liu and M. H. Kryder, Appl. Phys. Lett. 77, 426 (2000).
- (20) A. Chezan, C. Craus, N. Chechenin, L. Niesen, and D. Boerma, physica status solidi (a) 189.
- (21) J. Rantschler, Y. Ding, S.-C. Byeon, and C. Alexander, J. Appl. Phys. 93, 6671 (2003).
- (22) Y.-K. Liu, M. H. Kryder, D. H. Ryan, and Z. Altounian, J. Appl. Phys. 93, 6471 (2003).
- (23) N. G. Chechenin, A. van Veen, H. Schut, A. R. Chezan, D. O. Boerma, T. Vystavel, and J. T. M. D. Hosson, J. Phys. Cond. Mat. 15, 7663.
- (24) A. Kamzin, F. Wei, Z. Yang, and S. Kamzin, Tech. Phys. Lett. 31, 461.
- (25) J. Das, S. S. Kalarickal, K.-S. Kim, and C. E. Patton, Phys. Rev. B 75, 094435 (2007).
- (26) S. S. Kalarickal, P. Krivosik, J. Das, K. S. Kim, and C. E. Patton, Phys. Rev. B 77, 054427 (2008).
- (27) F. Xu, S. Li, and C. K. Ong, J. Appl. Phys. 109, 07D322 (2011).
- (28) Y. Ding and C. Alexander, J. Appl. Phys. 91, 7833 (2002).
- (29) E. Clementi, D. L. Raimondi, and W. P. Reinhardt, J. Chem. Phys. 47, 1300 (1967), ISSN 00219606.
- (30) Y. Ma, X. Li, T. Xie, F. Wei, and Z. Yang, Mat. Sci. and Eng. B 103, 233 (2003).
- (31) H. Y. Wang, E. Y. Jiang, H. L. Bai, P. Wu, Y. Wang, and F. F. Gong, J. of Phys.: Cond. Mat. 9, 8443 (1997).
- (32) M. Kopcewicz, J. Jagielski, G. Gawlik, and A. Grabias, J. Appl. Phys. 78, 1312 (1995).
- (33) L. de Wit, T. Weber, J. S. Custer, and F. W. Saris, Phys. Rev. Lett. 72, 3835 (1994).
- (34) Journal of Alloys and Compounds 326, 265 (2001).
- (35) C. Navío, J. Alvarez, M. J. Capitan, F. Yndurain, and R. Miranda, Phys. Rev. B 78, 155417 (2008).
- (36) C. Navío, J. Alvarez, M. J. Capitan, J. Camarero, and R. Miranda, Appl. Phys. Lett. 94, 263112 (2009).
- (37) J. M. Gallego, S. Y. Grachev, D. M. Borsa, D. O. Boerma, D. Écija, and R. Miranda, Phys. Rev. B 70, 115417 (Sep 2004).
- (38) M. Gupta, T. Gutberlet, J. Stahn, P. Keller, and D. Clemens, Pramana J. Phys 63, 57 (2004).
- (39) U. C. Oh and J. H. Je, J. Appl. Phys. 74, 1692 (1993).
- (40) Y. C. Feng, D. E. Laughlin, and D. N. Lambeth, J. Appl. Phys. 76, 7311 (1994).
- (41) B. D. Cullity, Elements of X-ray Diffraction (Addison-Wesley,MA, 1978).
- (42) U. Holzwarth and N. Gibson, Nature Nano. 6, 534 (2011).
- (43) F. Tessier, A. Navrotsky, R. Niewa, A. Leineweber, H. Jacobs, S. Kikkawa, M. Takahashi, F. Kanamaru, and F. J. DiSalvo, Solid State Sciences 2, 457 (2000).
- (44) M. Gupta, A. Gupta, S. Rajagopalan, and A. K. Tyagi, Phys. Rev. B 65, 214204 (2002).
- (45) M. Gupta, A. Tayal, A. Gupta, V. R. Reddy, M. Horisberger, and J. Stahn, J. Alloys Compds. 509, 8283 (2011).
- (46) S. J. Blundell and J. A. C. Bland, Phys. Rev. B 46, 3391 (1992).
-
(47)
F. Ott, “Simulreflec,”
http://www-llb.cea.fr/prism/programs/simulreflec/simulreflec.html. - (48) L. G. Parratt, Phys. Rev. 95, 359 (1954).
- (49) G. Herzer, I.E.E.E. Trans. Mag. 26, 1397 (1990).
- (50) G. Herzer, I.E.E.E. Trans. Mag. 25, 3327 (1989).
- (51) P. Schaaf, C. Illgner, M. Niederdrenk, and K. P. Lieb, Hyp. Int. 95, 199 (1995).
- (52) D. M. Borsa and D. O. Boerma, Hyp. Int. 151-152, 31 (2003).
- (53) D. B. Evans and R. D. Pehkle, AIME Trans. 233, 1620 (1965).