Anomalous Properties in the Normal and Superconducting States of LaRu3Si2
Abstract
Superconductivity in LaRu3Si2 with the honeycomb structure of Ru atoms has been investigated. It is found that the normal state specific heat C/T exhibits a deviation from the Debye model down to the lowest temperature. A relation which concerns the electron correlations can fit the data very well. The suppression to the superconductivity by the magnetic field is not the mean-field like, which is associated well with the observation of strong superconducting fluctuations. The field dependence of the induced quasiparticle density of states measured by the low temperature specific heat shows a non-linear feature, indicating the significant contributions given by the delocalized quasiparticles.
pacs:
74.70.Dd, 74.25.Bt, 74.25.F-,74.10.+vSuperconductivity arising from non-phonon mediated pairing, such as through exchanging the magnetic spin fluctuations, has renewed interests in condensed matter physics. The superconducting (SC) mechanism of the cupratesHTSMuller and the iron pnictidesHosono , although not yet settled completely, should have a close relationship with the electron correlations.PWAnderson ; Scalapino ; Canfield1 A similar assessment may extend to many others, like heavy FermionSiQM1 and organic materialsDressel . In this regard, the systems Si2 or B2 ( stands for the rare earth elements, like La, Ce, Y, etc., for the transition metals, like Ru, Co and Ni, etc.) provide an interesting platform, since a variety of combinations of chemical compositions allow the system to be tuned between superconducting and magnetic, and sometimes both phases coexist.Escorne ; KuHQ Among these samples, the LaRu3Si2 has a SC transition temperature as high as 7.8 K.Barz The material of LaRu3Si2 contains layers of Ru with the honeycomb structure sandwiched by the layers of La and Si, forming a 63/m or 63 space group. Preliminary experiment found that the SC transition temperature drops only 1.4 K with the substitution of 16 La by Tm (possessing a magnetic moment of about 8), suggesting that the superconductivity is robust against the local paramagnetic momentEscorne . By doping the La with Gd, a coexistence of superconductivity and the spin glass stateGodart was observed. In CeRu3Si2, the SC transition temperature drops to about 1 K and a valence fluctuation model was proposed for the pairingRauchschwalbe . Since the Ru atom locates just below the Fe in the periodic table, a key player in the iron pnictide superconductors, therefore it is very curious to know whether the superconductivity here is induced by the electron-phonon coupling, or by other novel mechanism, such as the electron correlations. In this paper we report the results of transport and specific heat on samples of LaRu3Si2. Our results reveal some novelties in both the SC and normal states of LaRu3Si2.
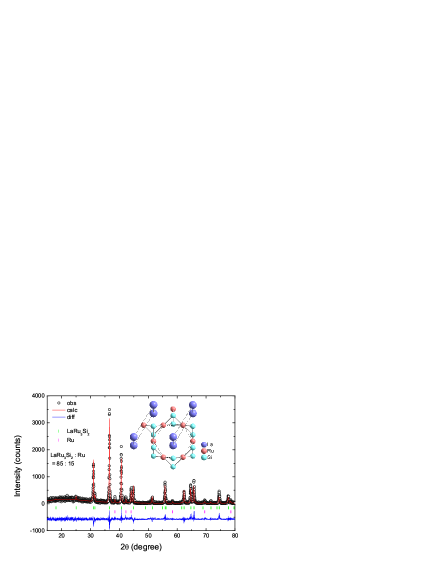
The samples were fabricated by the arc melting method.Escorne ; Barz ; Godart The starting materials La metal pieces (99, Alfa Aesar), Ru powder (99.9) and Si powder (99.99) were weighed and mixed well, and presseed into a pellet in a glover box filled with Ar atmosphere (water and the oxygen compositions were below 0.5 PPM). In order to avoid the formation of the LaRu2Si2 phase, we intentionally let a small amount of extra Ru with the nominal compositions as LaRu3+xSi2. Three round of welding with the alternative upper and bottom on the pellet was taken in order to achieve the uniformity. After these refined processes, the resultant sample contains mainly the phase of LaRu3Si2 and small amount of Ru remains as the impurity phase. In Fig.1 we plot the x-ray diffraction patterns (XRD) on one typical sample and the Rietveld fitting using the GSAS programGSAS . It is clear that the main diffraction peaks can be indexed well by a hexagonal structure with a = 5.68 and c = 7.13 . Some weak peaks arising from the impurity phase Ru can also be seen. A detailed fitting to the structural data find that the ratio between LaRu3Si2 and Ru is around 85:15 for this typical sample. The sample preparation and the quality characterized by the SC transitions can be repeated quite well. It is found that, some of the LaRu2Si2 phase with a tetragonal structure can be found if the starting material has the nominal composition of LaRu3Si2. In this case, the XRD data exhibit clearly two set of structures and can be easily indexed by the GSAS program. For the present sample, the absolute difference between the experimental data and the fitting curve can be observed for some peaks because part of the grains in the sample are slightly aligned. The resistivity was measured with a Quantum Design instrument PPMS-16T with a standard four-probe technique, while the magnetization was detected by the Quantum Design instrument SQUID-VSM with a resolution of about 5 10-8 emu.
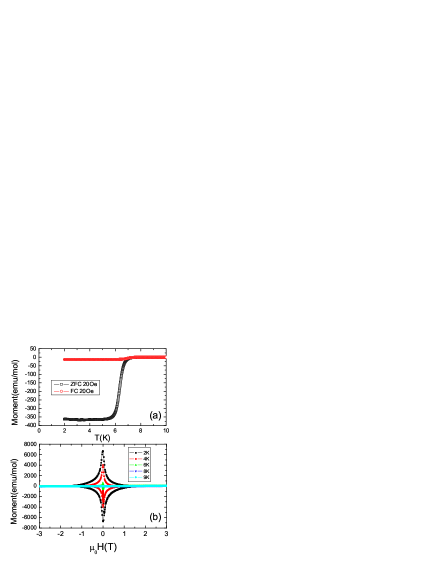
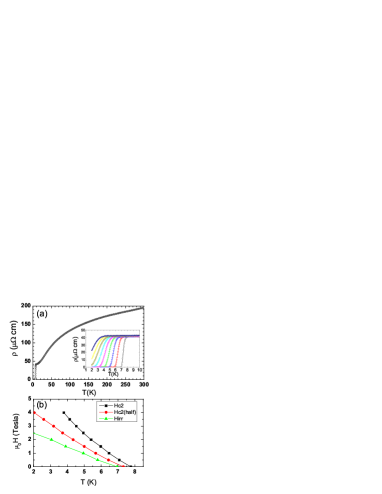
In Fig. 2(a) we present the temperature dependence of magnetization measured in the zero-field-cooling mode (ZFC) and the field-cooling mode (FC). By considering the demagnetization factor on the ZFC data, the Meissner screening is estimated to be almost 100 . This indicates that the SC connections between the grains of LaRu3Si2 are very good, although we have slight secondary phase of Ru. The onset Tc determined from the magnetization is around 7.8 K. The majority of the SC transition occurs at about 6.6 K under a magnetic field of 20 Oe. This difference is not induced by the inhomogeneity of the sample, it may be induced by the relatively strong SC fluctuations (see below). Fig.2(b) shows the magnetization hysteresis loops (MHL) measured at different temperatures. The symmetric and clear opening of the MHLs indicate that it is a type-II superconductor. A roughly linear MHL was observed at 9 K, just above Tc, indicating that the normal state has no long range ferromagnetic order. We didn’t observe a magnetization enhancement near Tc, which was reported in Tm and Gd doped samples in early publicationsEscorne ; Godart . Fig.3(a) shows the resistive transitions at zero field (main panel) and different magnetic fields under 4 Tesla (inset). The onset resistive transition temperature is at 7.9 K (95 normal state resistivity ), and the zero resistivity was achieved at about 6.8 K. By applying a magnetic field, the resistive transition broadens. Taking different criterions of resistivity we determined the upper critical field H, H, and the irreversibility line H. It is clear that there is a large difference between the H and Hirr(T). We will argue that this may be induced by the strong SC fluctuations.
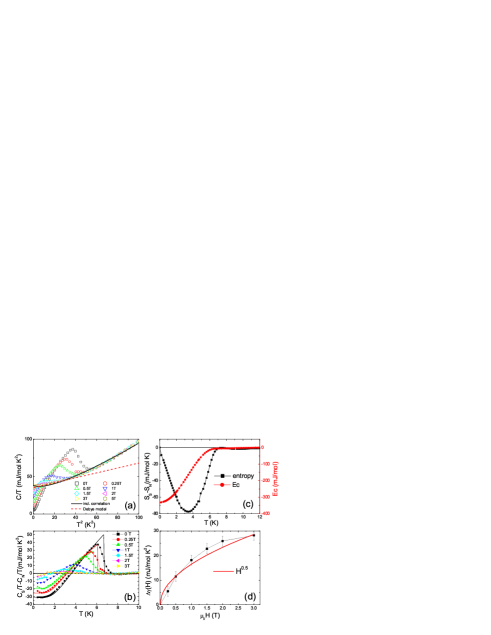
The raw data of specific heat was shown in Fig.4(a). A SC anomaly appears at about 7.6 K. Since the Ru has a at 0.49 K and a quite small normal state specific heat coefficient ( = ), a slight correction of about 0.42 was made to the data. By applying a magnetic field, the SC anomaly shifts to lower temperatures. It is interesting to note that the transition is not shifted parallel down to the low temperatures (the so-called mean-field like), rather the SC anomaly is suppressed. This kind of suppression was clearly seen in the cuprate superconductors Pr0.88LaCe0.12CuO4-δPNAS and was ascribed to a strong SC fluctuation. Combining with the resistive broadening under a magnetic field, we would argue that there is also a strong SC fluctuation in LaRu3Si2. As for a three dimensional system judged from our band structure calculations, this kind of strong SC fluctuation may suggest that the superfluid density is low. Another interesting point shown in Fig.4(a) is that the normal state specific heat (SH) coefficient C/T shows a non-linear dependence on T2 down to the lowest temperature (0.38 K). This is clearly deviating from the prediction of the Debye model. Taking the slope of vs. from the low temperature data, we get the Debye temperature = 284 K. The phonon contribution calculated based on the Debye model is shown by the red dashed line. One can see that the Debye model is seriously violated. It is naturally questioned whether this violation is induced by some electron correlation effect. For a non-Fermi liquid with three dimensionality, the enhanced electron-electron interaction will give an extra contribution to the electronic specific heatQCP with n = 1 to 3. This gives the correction to the Fermi liquid description, = 1 corresponds to the case of strong correlation, like in Heavy fermion systemsQCP , while n = 3 corresponds to a weak correlation. Thus we fit the data with and found a very good fitting when n takes 2 and , as shown by the solid line, leading to and . Therefore we intend to conclude that the electron correlations may play an important role in the system. In Fig.4(b), we derived the electronic specific heat by subtracting the normal state background measured at 5 T. One can see that the low-T part of exhibits a flat feature, indicating a full SC gap. There is a small upturn of in the low-T region when the field is very weak, see the data of 0.25 T and 0.5 T, which is attributed to the Schotkky anomaly due to the paramagnetic centers. Using an integral based on the BCS formula for electronic specific heat, we fit the data at H = 0, 0.25 and 0.5 T and show with the solid lines. In this way we obtained the data in the zero temperature limit for each field. For higher magnetic fields, it is known that the Schottky anomaly becomes weaker, we can determine the low-T data directly from the experiment data. Fig.4(c) shows the temperature dependence of the entropy calculated using , it is clear that the entropy is conserved at Tc as judged by = 0, where or are the entropies of the superconducting state and the normal state integrated up to T, and . After obtaining the low-T data, we derived the electronic SH at different magnetic fields and plot them in Fig.4(d). Interestingly, a non-linear field dependence can be easily seen here. Further analysis finds that this non-linear dependence is actually different from the relation (shown by the solid line in Fig.4(d)) predicted for a clean superconductor with line-node gap, the data below about 0.5 T seems to be more linear. Our result here is certainly different from a linear relation as predicted for a single isotropic SC gap. A multigap feature would already explain the data, but as seen from the flattening of at T 0, we would argue that it is not the multigap feature, but the gap anisotropy that leads to the non-linear field dependence of . A momentum resolved measurement is highly desired to uncover this puzzle.
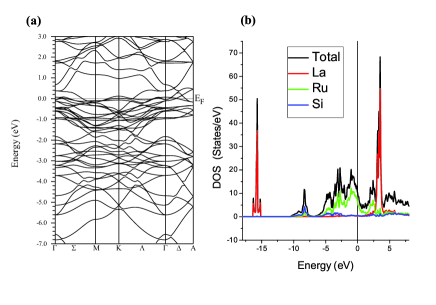
In order to have a comprehensive understanding to the data, we did the density-functional theory calculations by using the WIEN2k packageWIEN2k utilizing the generalized gradient approximationPBE for the exchange-correlation potential. As shown in Fig.5(a), the bands around Fermi level are mainly contributed by Ru 4d. The Si 3p bands are very wide and have some hybridization with Ru 4d. Further analysis of the calculation shows that the crystal-field splitting upon Ru 4d orbitals is quite weak, consequently all Ru 4d electron should play an important role in the electron conduction and related superconductivity. There are several bands crossing the Fermi level, which leads to complicated 3D Fermi surfaces, this will be presented elsewhere. Since the band closed to Fermi level is narrow, and the density of state at Fermi level is high as shown in Fig.5 (b). We also perform spin polarized calculations to check the possible magnetic instability. The calculation shows that the ferromagnetism is not stable for this compound. We cannot find any strong nesting effect in the Fermi-surface, thus the SDW order is unlikely. Worthy of noting is that all the five Ru 4d orbitals contribute to the conduction in , which is very similar to the case of the iron in the iron-pnictide superconductorsSingh . Actually a Ru-based compound, namely , is a superconductor with = 4.1 K, which has the similar structure of the superconductorMandrus ; Canfield , and probably they share the same superconducting mechanism. This reminds us that the correlation effect may play some roles in the superconductivity of .
In summary, resistivity, magnetization and specific heat have been measured in a Ru-based superconductor with of about 7.8 K. The temperature dependence of the normal state specific heat coefficient C/T deviates clearly from the Debye model, but shows the possible evidence of electron correlations. The superconducting transitions measured by both resistivity and specific heat self-consistently present the evidence of strong superconducting fluctuations, resembling that in the cuprates. The field induced quasiparticle density of states show a non-linear magnetic field dependence, which is argued as a gap anisotropy. Combining the novelties found both in the normal state and the superconducting state, we argue that the electron correlations may play an important role in the occurrence of superconductivity in .
Acknowledgements.
We appreciate the useful discussions with Jan Zaanen, Zidan Wang, Zlatko Tesanovic, Tao Xiang, Qianghua Wang, and Jianxin Li. This work is supported by the NSF of China (11034011), the Ministry of Science and Technology of China (973 projects: 2011CBA001002, 2012CB821403, 2010CB923000).⋆ hhwen@nju.edu.cn
References
- (1) J. G. Bednorz and K. A. Muller, Z. Physik B64, 189 (1986).
- (2) Y. Kamihara et al., J. Am. Chem. Soc. 130, 3296 (2008).
- (3) P. W. Anderson et al., J. Phys. Condens. Matter 16, R755 (2004).
- (4) D. J. Scalapino, Phys. Rep. 250, 329 (1995). T. Moriya and K. Ueda, Rep. Prog. Phys. 66, 1299(2003). P. Monthoux, D. Pines and G. Lonzarich, Nature 450, 20 (2007).
- (5) N. Ni et al., Phys. Rev. B78, 214515 (2008).
- (6) Q. M. Si and F. Steglich, Science 329, 1161 (2010).
- (7) M. Dressel et al., J. Phys. Cond. Matt. 23, 293201 (2011).
- (8) M. Escorne, A. Mauger, L. C. Gupta and C. Godart, Phys. Rev. B49, 12051 (1994).
- (9) H. C. Ku et al., Solid State Comm. 35, 91 (1980).
- (10) H. Barz, Mater. Res. Bull. PNAS 15, 1489 (1980); J. M. Vandenberg and H. Barz, ibid. 15, 1493 (1980).
- (11) C. Godart and L. C. Gupta, Phys. Lett. 120, 427 (1987).
- (12) U. Rauchschwalbe, W. Lieke and F. Steglich et al., Phys. Rev. B30, 444 (1984).
- (13) A. C. Larson, R. B. Von Dreele, General Structure Analysis System (GSAS), Los Alamos National Laboratory Report LAUR 86-748, 2000.
- (14) S. D. Wilson et al., PNAS 104, 15259 (2007).
- (15) H. v. Lhneysen, A. Rosch, M. Vojta and P. Wlfle, Rev. Mod. Phys. 79, 1015 (2007).
- (16) P. Blaha, K. Schwarz, G. Madsen, D. Kvasnicka, and J. Luitz, WIEN2k, An Augmented Plane Wave + Local Orbitals Program for Calculating Crystal Properties (Technical University of Vienna, Vienna, 2001).
- (17) J. P. Perdew, K. Burke, and M. Ernzerhof, Phys. Rev. Lett. 77, 3865 (1996)
- (18) D. J. Singh, M. H. Du, Phys. Rev. Lett. 100, 237003 (2008).
- (19) A. S. Sefat et al., Phys. Rev. Lett. 101, 117004 (2008).
- (20) S. L. Bud’ko, Ni Ni, P. C. Canfield, Phys. Rev. B79, 220516 (2009).