Instituto de Astrofísica de La Plata, CCT La Plata-CONICET-UNLP
Paseo del Bosque S/N (1900), La Plata, Argentina.
Impactor flux and cratering on Ceres and Vesta:
Implications for the early Solar System
Abstract
Context. The forthcoming arrival of the NASA’s Dawn spacecraft to Ceres and Vesta means that these unexplored worlds in the asteroid Main Belt are targets of several studies.
Aims. We study the impactor flux and cratering on Ceres and Vesta caused by the collisional and dynamical evolution of the asteroid Main Belt.
Methods. We develop a statistical code based on a well-tested model for the simultaneous evolution of the Main Belt and NEA size distributions. This code includes catastrophic collisions and noncollisional removal processes such as the Yarkovsky effect and the orbital resonances. It is worth noting that the model assumes that the dynamical depletion of the early Main Belt was very strong, and owing to that, most Main Belt comminution occurred when its dynamical structure was similar to the present one.
Results. Our results indicate that the number of 1 km Main Belt asteroids striking Ceres and Vesta over the Solar System history are approximately 4 600 and 1 100, respectively. Moreover, the largest Main Belt asteroids expected to have impacted Ceres and Vesta had a diameter of 71.7 for Ceres and 21.1 km for Vesta. As for the cratering, our simulations show that the surfaces of Ceres and Vesta present a wide variety of craters with different sizes. In fact, the number of 0.1 km craters on Ceres is 3.4 108 and 6.2 107 on Vesta. Moreover, the number of craters with 100 km are 47 on Ceres and 8 on Vesta. On the other hand, our study indicates that the 460 km crater observed on Vesta had to be formed by the impact of a 66.2 km projectile, which has a probability of occurr 30 % over the Solar System history.
Conclusions. If significant discrepancies between our results about the cratering on Ceres and Vesta and data obtained from the Dawn Mission were found, they should be linked to a higher degree of collisional evolution during the early Main Belt and/or the existence of the late heavy bombardment. An increase in the collisional activity in the early phase may be provided for an initial configuration of the giant planets consistent with, for example, the Nice model. From this, the Dawn Mission would be able to give us clues about the initial configuration of the early Solar System and its subsequent dynamical evolution.
Key Words.:
methods: numerical – Minor planets, asteroids: general1 Introduction
Ceres and Vesta are the largest and most massive members of a vast population of small bodies located between Mars and Jupiter commonly called the asteroid Main Belt. Several numerical models (e.g. Bottke et al. 2005a ; 2005b ; O’Brien & Greenberg OBrien2005 (2005); de Elía & Brunini deElia2007 (2007)) indicate that the size distribution of the Main Belt asteroids is determined primarily by collisional processes. In fact, these studies suggest that most of the largest objects ( 120 km) have never been disrupted, while many smaller asteroids are byproducts of fragmentation events among the largest bodies. While Ceres and Vesta have not been targets of catastrophic collisions, they have been exposed to cratering impacts over the age of the Solar System. In fact, the existence of the Vesta family (Binzel & Xu Binzel1993 (1993)) is clear evidence that this object has undergone large cratering impacts over time. Cratering is one of the most important processes that determine the morphology of the surface of a Solar System object. The understanding and quantification of the impactor source population onto an object and the observation of the object surface help for understanding the dynamical and physical history of both the impactor population and the target.
Launched in September 2007, NASA’s Dawn Mission was captured in orbit by Vesta on July 15, 2011, and it should reach the vicinities of Ceres in February 2015. The theoretical predictions of producing of craters may be compared with observations of Ceres and Vesta. This will help, on the one hand, for identifying the source of craters and, on the other hand, accounting for the geological processes that have acted on the surfaces of those bodies. Then, it is very important to study all the possible sources of crater production on Ceres and Vesta in order to estimate the total crater production and to contrast them with observations.
In this paper we evaluate the impactor flux and cratering on Vesta and Ceres due to the collisional and dynamical evolution of the asteroid Main Belt. To do this, we constructed a statistical code based on the collisional model developed by Bottke et al. (2005a ) with some dynamical considerations from Bottke et al. (2005b ). A comparison between our study and data obtained from the Dawn Mission may be relevant for the structure and evolution of the early Solar System.
2 The full model
Bottke et al. (2005a ) developed a collisional model capable of tracking the evolution of the asteroid Main Belt over the Solar System history. At each timestep, this statistical algorithm calculates the total number of catastrophic collisions between objects residing in different size bins, using parameters such as the mean impact velocity , the intrinsic collision probability , and the impact energy required for dispersal . From this, the code computes how many objects are catastrophically fragmented and removed from each size bin, as well as the number of fragments resulting from those collisions, which are distributed in the different bins according to their sizes. This model assumes that all breakups occur close to the catastrophic disruption threshold and neglects cratering events, which produce much less ejecta over time than catastrophic disruption events, and highly-energetic catastrophic disruption events, which are relatively uncommon.
The algorithm developed by Bottke et al. (2005a ) includes the effects of an intense period of collisional evolution in the early massive Main Belt. Using numerical simulations, the authors found that the net collisional activity in the Main Belt over its lifetime is the equivalent of 7.5 - 9.5 Gyr of collisional activity in the current Main Belt. This “pseudo-time approximation” means that the Main Belt population required 1.5 - 2 times the degree of comminution than it would have experienced if it were not initially much more massive. It is worth noting that this model assumes that the collisional history of the Main Belt has been dominated by the same intrinsic collision probabilities and impact velocities as are found in the current Main Belt. Based on Petit et al. (Petit2001 (2001, 2002)), Bottke et al. (2005a ) consider that the dynamical removal phase of the Main Belt was short and owing to that the high velocity impacts did not play an important role in the collisional history of the Main Belt. From this, the collisional model from Bottke et al. (2005a ) uses the current values of and throughout the whole simulation.
This model is able to fit a wide range of observational constraints such as the Main Belt size distribution, the number of large asteroid families produced by the disruption of 100 km parent bodies over the past 3 to 4 Gyr, the existence of a = 460 km crater on the intact basaltic crust of Vesta, and the relatively constant crater production rate of the Earth and Moon over the last 3 Gyr.
Later, Bottke et al. (2005b ) performed a study aimed at linking the collisional history of the asteroid Main Belt to its dynamical excitation and depletion. This work combines the collisional evolution code created by Bottke et al. (2005a ) with dynamical results from Petit et al. (Petit2001 (2001)), as well as the removal of bodies from the Main Belt due to the action of resonances and the Yarkovsky effect, which enter the near-Earth asteroid (NEA) population. This collisional and dynamical evolution code also satisfies the above constraints and successfully reproduces the observed NEA size distribution. It is worth noting that Bottke et al. (2005b ) validate the pseudo-time approximation proposed by Bottke et al. (2005a ).
2.1 Simulation parameters
Here, we construct a collisional model based on the one described in Bottke et al. (2005a ) with some dynamical considerations taken from Bottke et al. (2005b ). From this, we track the simultaneous evolution of both the NEA and Main Belt populations by simulating the effects of an intense collisional evolution in the early massive Main Belt from the pseudo-time approximation proposed by those authors.
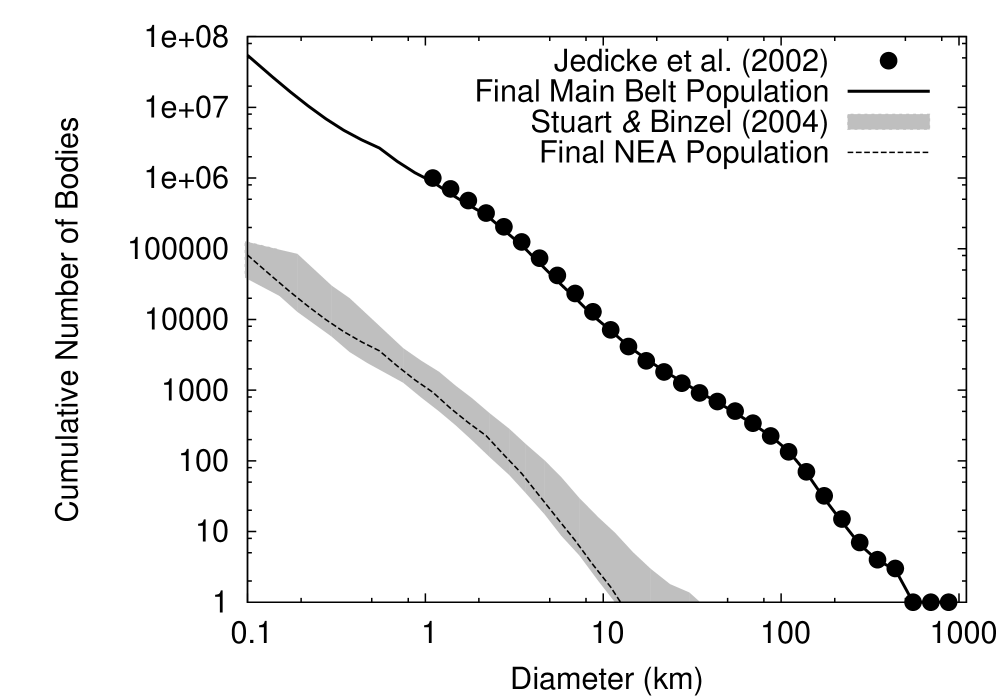
The initial population used here follows the idea proposed by Bottke et al. (2005a ; 2005b ). In fact, our starting size distribution for 200 km uses the number of observed Main Belt asteroids, with a few objects added in, to account for the Eos and Themis parent bodies. For 120 200 km, the population follows an incremental power-law index of -4.5, while for 120 km an incremental power-law index of -1.2 is assigned. On the other hand, the NEA population always starts with no bodies. Figure 1 shows the initial Main Belt size distribution used in our simulations, the observed Main Belt size distribution from Bottke et al. (2005a ), which is based on Jedicke et al. (Jedicke2002 (2002)) with a few changes, and the observed NEA size distribution from Stuart & Binzel (Stuart2004 (2004)). Jedicke et al. (Jedicke2002 (2002)) analyzed the absolute magnitude distribution of the Main Belt in the range 5.0 18.5. To transform the Jedicke et al. (Jedicke2002 (2002)) distribution into a size distribution, Bottke et al. (2005a ) assume a visual geometric albedo = 0.092. Moreover, they include the observed asteroids for 300 km using the IRAS/color-albedo-derived diameters cited in Farinella & Davis (Farinella1992 (1992)).

For collisions between Main Belt asteroids, the value adopted in the collisional algorithm for the intrinsic collision probability is 2.86 10 -18 km -2 yr -1 and the mean impact velocity is 5.3 km s-1 (Bottke et al. Bottke1994 (1994)). To compute impacts on Ceres and Vesta, we use the particular values of derived by O’Brien et al. (OBrien2011 (2011)) for each of these bodies. The values adopted for are 3.70 10-18 km-2 yr-1 for Ceres and 2.97 10-18 km -2 yr -1 for Vesta. As for the disruption law, we use the impact energy required for dispersal derived by Benz & Asphaug (Benz1999 (1999)) for basalt at 3 km s -1. While the mean impact velocity for collisions between Main Belt asteroids is 5.3 km s-1, we adopt the law for 3 km s-1 since Bottke et al. (2005a ) show that it produces very good fits to the observational constraints.
The differential fragment size distribution (FSD) produced by each catastrophic disruption event is represented by
| (1) |
where is the diameter, is the number of fragments in the size range (,), is a constant, and is the power-law index. The FSDs used here are based on those observed in asteroid families like Themis or Flora (Bottke et al. 2005a ). According to Tanga et al. (Tanga1999 (1999)), the Themis family was produced by the super-catastrophic breakup of a 369 km body, while the Flora family was created by the barely-catastrophic breakup of a 164 km body. Bottke et al. (2005a ) show that FSDs resulting from super-catastrophic disruption events are represented well by a single value, although this is not true for FSDs produced by barely-catastrophic breakups. From this, Bottke et al. (2005a ) developed two different FSDs to describe the possible outcomes of a catastrophic collision. On the one hand, for 150 km disruption events, the diameter of the largest remnant is assumed to be 50 % the diameter of the parent body. Moreover, the power-law index of the differential FSD between the largest remnant and 1/60 the diameter of the parent body is -3.5, while the value is -1.5 for smaller fragments. On the other hand, for disruption events among 150 km bodies, the largest remnant is 80 % the diameter of the parent body. Moreover, the power-law index of the differential FSD between the largest remnant and 1/3 the diameter of the parent body is -2.3. In this case, the FSD has a second break at 1/40 the diameter of the parent body. The value between 1/3 and 1/40 the diameter of the parent body is -4, while is assumed to be -2 for smaller fragments.
On the other hand, since the NEA population is several orders of magnitude smaller than the Main Belt population, we neglect collisions between NEAs and between NEAs and Main Belt asteroids. In fact, we consider that the NEA population is sustained by the input of material from the Main Belt via orbital resonances and the Yarkovsky effect. Here, we use the non-collisional removal rate of asteroids from the Main Belt proposed by Bottke et al. (2005b ). Thus, bodies removed from the Main Belt by noncollisional processes are placed in the NEA population, which is assumed to decay with a mean dynamical lifetime of 5 Myr.
| 3.25 | 980.9 | 1.0 | - |
| 3.75 | 779.2 | 0.0 | - |
| 4.25 | 618.9 | 0.0 | - |
| 4.75 | 491.6 | 2.0 | - |
| 5.25 | 390.5 | 1.0 | 1 |
| 5.75 | 310.2 | 3.0 | 1 |
| 6.25 | 246.4 | 8.0 | 1 |
| 6.75 | 195.7 | 17.0 | 5 |
| 7.25 | 155.5 | 38.0 | 5 |
| 7.75 | 123.5 | 64.0 | 5 |
| 8.25 | 98.1 | 91.0 | - |
| 8.75 | 77.9 | 116.0 | - |
| 9.25 | 61.9 | 164.0 | - |
| 9.75 | 49.2 | 185.0 | - |
| 10.25 | 39.1 | 224.0 | - |
| 10.75 | 31.0 | 338.0 | - |
| 11.25 | 24.6 | 554.0 | - |
| 11.75 | 19.6 | 789.7 | - |
| 12.25 | 15.6 | 1548.0 | - |
| 12.75 | 12.4 | 2992.3 | - |
| 13.25 | 9.81 | 5671.8 | - |
| 13.75 | 7.79 | 10463.9 | - |
| 14.25 | 6.19 | 18630.7 | - |
| 14.75 | 4.92 | 31739.6 | - |
| 15.25 | 3.91 | 51398.5 | - |
| 15.75 | 3.10 | 78939.8 | - |
| 16.25 | 2.46 | 115400.3 | - |
| 16.75 | 1.96 | 162026.4 | - |
| 17.25 | 1.55 | 221080.1 | - |
| 17.75 | 1.23 | 296503.1 | - |
| 18.25 | 0.98 | 394278.9 | - |
is the absolute magnitude, the central diameter (in kilometers) of the bin for a visual geometric albedo 0.092, the incremental number of asteroids in each bin based on Jedicke et al. (Jedicke2002 (2002)) with a few modifications (see Sect. 2.2), and the number of observed asteroid families in each bin.
2.2 Runs
We perform our numerical simulations using a pseudo-time of 9.5 Gyr. In addition, since the range of 7.5 to 9.5 Gyr is what is found by Bottke et al. (2005a ) to give the best fits, we decide to carry out numerical simulations for a pseudo-time of 7.5 Gyr in order to test the sensitivity of our results to this parameter. This point is referred in Sect. 3.
On the other hand, to simulate the disruption events in the asteroid Main Belt in a more realistic manner, our algorithm works stochastically treating the breakups as Poisson random events (Press et al. Press1989 (1989)). A stochastic code produces different results using different seeds for the random number generator. Thus, we develop a large number of runs using different random seeds and then interpret the results statistically.
To obtain a quantitative measure of how good a run reproduces observational data, we follow the procedure described by Bottke et al. (2005a ). First, the metric used to determine the goodness of fit between the observed Main Belt size distribution () and the model results () is given by
| (2) |
where the summation extends over 1 1 000 km size bins. Second, a standard test is used to compare the number of breakups produced in each 100 km size bin over the last 3.5 Gyr to the observed number of asteroid families in the 100 400 km size bins. Table 1 summarizes the observed Main Belt model parameters necessary to develop these tests (Bottke et al. 2005a ). Following Bottke et al. (2005b ), we assume that a run produces a positive match if and (i.e., probability 5 ).
Given the stochastic nature of our code, we carried out 10 000 numerical simulations using a pseudo-time of 9.5 Gyr, 533 of which show positive matches. From such simulations, we calculated the flux of Main Belt asteroids of different sizes onto Ceres and Vesta. Besides using a suitable expression we also computed the crater diameters produced by Main Belt asteroids on such bodies. Below, we discuss the algorithms that relate crater diameter to impactor diameter.
2.3 Cratering laws on Ceres and Vesta
Cratering processes have been extensively study through impact and explosion experiments (e.g. Schmidt & Housen SH87 (1987)). In a recent work interpreting the observations of the Deep Impact event, Holsapple & Housen (HH07 (2007)) have updated the crater scaling laws for different materials. The impact cratering scaling laws depend in general on two exponents and and a constant that characterize the different materials. The diameter of a crater produced by an impactor of diameter can be obtained from Holsapple & Housen (HH07 (2007)) from the equation:
| (3) |
where is the target density, its superficial gravity, its strength, the density of the impactor, and the impactor velocity.
To calculate the craters on Ceres and Vesta, we have to take their composition and superficial characteristics into account. Table 2 shows the values of several physical parameters for Ceres and Vesta. We have no direct information on the surfaces of those asteroids. For Ceres, observations from their reflectance spectra plus theoretical analysis are consistent with a rocky surface (Zolotov Z09 (2009)). The low density of Ceres implies that it contains low-density compounds. The internal structure and the amounts of water in Ceres have already been modeled and studied (McCord & Sotin MS05 (2005), Zolotov Z09 (2009)), but there is no unique, generally accepted model for Ceres interior. Those models may really be tested with the observations of the Dawn Mission in 2015. Vesta has a basaltic surface and is considered a differentiated body (McCord et al. Mc70 (1970)). Then, Ceres and Vesta can be assimilated to the cratering law that corresponds to wet soils and rock. For this material , , and . Then, replacing these values in Eq. (3) we can obtain the final diameter of the crater for a given impactor diameter.
Equation (3) gives a general law for impacts, and it is a convenient empirical smoothing function to span the transition between the gravity regime and the strength regime (Holsapple Holsapple1993 (1993)). We use this general form, since in the low gravity of asteroids the strength regime can be important for the smaller craters. The strength of the target is a value that have many measures for a geological material. Housen & Holsapple (HH03 (2003)) show that the crater size law depends on the average of the tensile and compressive strength. Then, we adopt a value of the strength corresponding to soft rocks of 3 MPa as in Holsapple & Housen (HH07 (2007)).
Obtained from Eq. (3), is the diameter of a simple crater, but for a large crater, gravitational forces modify the crater form leading to complex craters. The transition from simple to complex craters is an observable quantity unique for each world. Schenk et al. (Schenk2004 (2004)) summarize results for the single-to-complex transition diameters for silicate planets and icy satellites. From this, an inverse correlation between transition diameter and surface gravity is evident, with icy satellites offset toward lower transition diameters. Since the surface gravities of Ceres and Vesta are comparable (Table 2), extrapolation of the values associated with the silicate planets leads to a transition diameter for those objects of 50 km. When we use the diameter of the complex crater from McKinnon et al. (McKinnon2003 (2003)), then the final crater diameter is given by
| for | ||||||
| for | (4) |
3 Results
We present here our main results for the impactor flux and cratering onto Ceres and Vesta caused by the collisional and dynamical evolution of the asteroid Main Belt.
The statistical analysis developed in this section is based on the 533 runs that produce positive matches with the observational data. In fact, Figure 2 shows our estimates of the Main Belt and NEA cumulative size distributions for a pseudo-time of 9.5 Gyr, obtained from the 533 runs mentioned above. The results obtained from the simulations using a pseudo-time of 7.5 Gyr do not show any significant changes in the Main Belt and NEA size distributions and the formation of the large asteroid families. As for the impactor flux on Ceres and Vesta, the number of impacts on each of these bodies estimated using a pseudo-time of 7.5 Gyr is 70 to 80 % what is obtained with a pseudo-time of 9.5 Gyr.
3.1 Impactor flux onto Ceres and Vesta
Figure 3 shows the total number of Main Belt asteroid impacts onto Ceres and Vesta as a function of impactor diameter obtained using a pseudo-time of 9.5 Gyr. These curves are computed from a simple average of the 533 runs that produce positive matches with the observational data. Over the age of the Solar System, our results indicate that the number of 1 km Main Belt asteroids striking Ceres is 4 631 and 1 096 for Vesta. Moreover, the largest Main Belt asteroids expected to have impacted Ceres and Vesta over the history of the Solar System have had diameters of 71.7 and 21.1 km.
3.2 Cratering on Ceres and Vesta
Using these impactor fluxes, it is possible to obtain the number of craters on Ceres and Vesta as a function of crater diameter. To do this, we make use of Eqs. (3) and (4) with the values of the parameters , , , , and specified in Section 2.4, and the physical data shown in Table 2. Moreover, a density 2.7 g cm-3 is assumed for the impactors, which is consistent with the densities of several S-type asteroids (e.g. Belton et al. Belton1995 (1995), Veverka et al. Veverka2000 (2000)). On the other hand, the impactor velocity is given by
| (5) |
where is the hyperbolic encounter velocity, which is equal to the mean impact velocity , and the escape velocity of the target. O’Brien et al. (OBrien2011 (2011)) derived particular values of equal to 4.79 km s -1 for Ceres and 4.74 km s-1 for Vesta. According to the physical data shown in Table 2, Ceres and Vesta have escape velocities of 0.51 km s-1 and 0.37 km s-1. Using these values in Eq. (5), the impactor velocities used for Ceres is 4.82 km s-1 and 4.75 km s-1 for Vesta.

Figure 4 shows the total number of craters on Ceres and Vesta produced by Main Belt asteroids as a function of crater diameter obtained using a pseudo-time of 9.5 Gyr. Moreover, Table 3 presents a quantitative summary of our results concerning the craters formed on Ceres and Vesta. From this, the surfaces of these objects should show impact structures with a wide range of sizes. On the one hand, our results indicate that the number of 0.1 km craters on Ceres and Vesta are 3.4 108 and 6.2 107. On the other hand, our simulations show that 47 craters with 100 km are present on Ceres and 8 on Vesta.
Hubble Space Telescope (HST) observations of Vesta have revealed a singular crater with a diameter of about 460 km near the south pole (Thomas et al. 1997a ). Using a two-dimensional hydrocode, Asphaug (Asphaug1997 (1997)) studied the impact origin of Vesta family and concluded that the 460 km crater was formed by an impactor of 42 km in diameter at 5.4 km s-1. Recently, Ivanov et al. (Ivanov2011 (2011)) have analyzed the formation of the south pole impact crater on Vesta from projectiles with an impact velocity of 5.5 km s-1 and sizes ranging from 40 to 96 km in diameter. Their results suggest the possibility that the projectile diameter may be larger than 40 km.
Using Eqs. (3) from Holsapple & Housen (HH07 (2007)) and (4) from McKinnon et al. (McKinnon2003 (2003)), the transition diameter specified for Vesta in Section 2.4, and the physical data shown in Table 2, we conclude that a = 42 km impactor produces a transient crater of 217 km and a final complex crater of 307 km on Vesta111 It is worth noting that, since the 460 km singular crater is comparable to the Vesta diameter, the cratering laws used here may break down in this regime.. From this, the transient crater diameter is 0.7 of the final crater diameter. Several works such as those by Grieve et al. (Grieve1981 (1981)), Melosh (Melosh1982 (1982)), and Croft (Croft1985 (1985)), suggest that the transient crater diameter is estimated at 0.5 to 0.65 of the final crater diameter. However, these studies are based on lunar and terrestrial impact structures so we think that it would not be appropriate to compare them with our analysis relative to Vesta.
Taking Eq. (4) from McKinnon et al. (McKinnon2003 (2003)) into account for complex craters, a final crater with a diameter of 460 km is formed by a 42 km projectile if the transition diameter is of 2.2 km, which is a typical value for Venus and Mars. However, from Schenk et al. (Schenk2004 (2004)), we consider this value of the transition diameter to be too small for Vesta. Either way, the Dawn Mission data will be crucial for estimating the transition diameter for asteroid-sized objects.

Using the most appropriate value of 50 km for the transition diameter , our study indicates that the 460 km crater observed on Vesta’s surface had to be formed by a projectile of 66.2 km in diameter, which is consistent with suggesting by Ivanov et al. (Ivanov2011 (2011)). Our results indicate that such an event has a probability of occurring of 30 % over the Solar System history. We discuss this in the next section.
| Ceres | Vesta | |
|---|---|---|
| km) | 3.37 108 | 6.24 107 |
| km) | 576 178 | 112 653 |
| km) | 6 291 | 1 216 |
| km) | 47 | 8 |
4 Discussion
Bottke et al. (2005a ) created a numerical model capable of tracking how the Main Belt population was affected by collisional evolution from the end of accretion among 1000 km objects to the present time. These authors find that the net collisional activity in the Main Belt over its lifetime is the equivalent of 7.5 - 9.5 Gyr of collisional activity in the current Main Belt. In fact, the extra comminution had to come from a collisional phase occurring early in Solar System history when there were many more 1000 km objects in the primordial Main Belt than in the current population. Finally, the extra material in this population would have been primarily removed by dynamical processes rather than collisional evolution.
It is worth noting that there are some caveats and limitations to the model that should be mentioned. Bottke et al. (2005a ) assume that most Main Belt comminution occurred when the intrinsic collision probability and the mean impact velocity were comparable to their current values. This result is based on the dynamical simulations of the early Main Belt from Petit et al. (Petit2001 (2001)). These authors developed a dynamical evolution model of the Main Belt, with Jupiter and Saturn on their current orbits. With this orbital configuration for the gas giant planets, Petit et al. (Petit2001 (2001)) show that the depletion of asteroid Main Belt was very strong, removing 90 % of the original population in less than 10 Myr after the formation of Jupiter. Based on this model, Bottke et al. (2005a ) assume that the dynamical removal phase of the Main Belt was short enough that its evolution has been dominated by the same collisional parameters as found in the current Main Belt. Later, Bottke et al. (2005b ) combined dynamical results from Petit et al. (Petit2001 (2001)) and the collisional code of Bottke et al. (2005a ) to model the evolution of the Main Belt over the age of the Solar System. Unlike Bottke et al. (2005a ), the algorithm developed by Bottke et al. (2005b ) incorporates time-varying collisional parameters such as the intrinsic collision probability and the mean impact velocity . From this model, Bottke et al. (2005b ) find that the number of breakups occurring over 4.5 Gyr of evolution is consistent with the results of Bottke et al. (2005a ) using the pseudo-time approximation. Moreover, they find that the high velocity impacts do not appear to have a dominant effect on Main Belt comminution, mainly because these velocities become important only after the excited population has been significantly depleted.
However, the depletion rate of the early asteroid Main Belt depends on the initial orbital configuration of the giant planets. The Nice model from Tsiganis et al. (Tsiganis2005 (2005)) strongly suggests that the initial system of outer planets had a more compact configuration (all within 15 AU of the Sun), with nearly circular and coplanar orbits. In the context of this model, O’Brien et al. (OBrien2007 (2007)) studied the primordial excitation and clearing of the asteroid Main Belt, assuming Jupiter and Saturn on initially circular orbits. A relevant result is that the excitation and depletion of the asteroid Main Belt derived from the Nice model are slower than those found by Petit et al. (Petit2001 (2001)) with Jupiter and Saturn on their current orbits. In fact, 90 % of the original population is removed from the Main Belt in 70 Myr. Since in this scenario the massive population of the primitive Main Belt is removed more slowly, the degree of collisional evolution may have been greater than derived from the model of Bottke et al. (2005a ). Therefore, the degree of collisional evolution of Ceres and Vesta could provide clues to the initial orbital configuration of the gas giant planets.
On the other hand, the model from Bottke et al. (2005a ) does not include the collisional effects of external impactors not belonging to the Main Belt. The so-called late heavy bombardment (LHB) is a period of timeh during which it is believed that a large number of objects from the outer Solar System impacted the terrestrial planets and the Main Belt asteroids about 3.9 Gyr ago. This event may have led to significant effects on the degree of collisional evolution suffered by the Main Belt. It is worth noting that the existence of the LHB is still being debated in the literature (Chapman et al. Chapman2007 (2007)).
In particular, we estimate that Vesta had a 30 % probability of being impacted by a 66.2 km projectile, which is capable of producing the singular crater of 460 km in diameter observed on its surface. A slower asteroid removal rate slower that is consistent with the Nice model and/or the existence of the LHB could lead to a higher degree of collisional evolution for the Main Belt increasing then the probability of producing the crater of 460 km on Vesta. However, a 30 % probability of occurrence does not allow us to discard the production of this crater in the present collisional evolution model. If the 460 km crater on Vesta formed during the early massive phase of the Main Belt, this would be consistent with studies developed by Bogard & Garrison (Bogard2003 (2003)), who propose that Vesta suffered such huge impact 4.48 Gyr ago.
According to the comments made in this section, we believe that, if significant discrepancies between our results concerning the collisional history of Ceres and Vesta and the observational data obtained from the Dawn Mission were found, they should be linked to a higher degree of collisional evolution in the Main Belt. An increase in the collisional activity may be due to
-
1-
a different initial configuration of the giant planets consistent with, for example, the Nice model, and/or
-
2-
the existence of the LHB.
If such discrepancies are eventually substantiated, future works should focus on accurately quantifying the degree of collisional evolution suffered by the early massive Main Belt as well as during the LHB, assuming that the outer planets had initial orbits similar to and substantially different from (e.g. Nice model) their current ones. From this, the Dawn Mission would be able to give us interesting clues about the initial configuration of the early Solar System and its subsequent dynamical evolution.
5 Conclusions
We have presented a study aimed at analyzing the impactor flux and cratering on Ceres and Vesta produced by Main Belt asteroids. To do this, we constructed a statistical code based on Bottke et al. (2005a ; 2005b ) that includes catastrophic collisions and noncollisional removal processes, such as the Yarkovsky effect and the orbital resonances. Assuming that the dynamical depletion of the early Main Belt was very strong, and owing to that, most Main Belt comminution occurred when the intrinsic collision probability and the mean impact velocity were comparable to their current values. Our main results are the following
-
•
The number of 1 km Main Belt asteroids striking Ceres and Vesta over the Solar System history is approximately 4 600 and 1 100.
-
•
The largest Main Belt asteroids expected to have impacted Ceres and Vesta had diameters of 71.7 and 21.1 km.
-
•
The surfaces of Ceres and Vesta should show a wide variety of craters with a wide range of sizes. On the one hand, the number of 0.1 km craters on Ceres and Vesta are 3.4 108 and 6.2 107. On the other hand, the surfaces of Ceres and Vesta present 47 and 8 craters with 100 km.
- •
-
•
Such an event has an occurrence probability 30 % over the Solar System history. Then, we cannot discard the production of this crater in the present collisional evolution model. An asteroid removal rate that is slower is consistent with the Nice model and/or the existence of the LHB which could lead to a higher degree of collisional evolution of the Main Belt thereby increasing the probability of producing the crater of 460 km on Vesta.
-
•
We suggest that, although the impact that formed the 460 km crater on Vesta cannot be discarded in the present collisional evolution model, it is more likely to have occurred in the early massive phase of Main Belt while it was being excited and depleted or during the LHB. This conclusion may become consistent with studies from Bogard & Garrison (Bogard2003 (2003)) who propose that such an impact occurred 4.48 Gyr ago.
-
•
We believe that if significant discrepancies between our results about the cratering on Ceres and Vesta and data obtained from the Dawn Mission were found, they should be linked to a higher degree of collisional evolution during the early massive phase of the Main Belt and/or the existence of the LHB. From this, the Dawn Mission could play an important role by providing information on the formation and evolution of the early Solar System.
Acknowledgements.
We acknowledge Francisco Azpilicueta for valuable discussions during this work. We also thank referee David P. O’Brien for his helpful and constructive reviews.References
- (1) Asphaug, E. 1997, Meteoritics & Planetary Science, 32, 965
- (2) Baer, J., & Chesley S. R. 2008, Celestial Mechanics and Dynamical Astronomy, 100, 27
- (3) Belton, M. J. S., Chapman, C. R., Thomas, P. C., et al. 1995, Nature, 374, 785
- (4) Benz, W., & Asphaug E. 1999, Icarus, 142, 5
- (5) Binzel, R. P., & Xu, S. 1993, Science, 260, 186
- (6) Bogard, D. D., & Garrison, D. H. 2003, Meteoritics & Planetary Science, 38, 669
- (7) Bottke, W. F., Nolan, M. C., Greenberg, R., & Kolvoord, R. A. 1994, Icarus, 107, 255
- (8) Bottke, W. F., Durda, D. D., Nesvorný, D., Jedicke, R., Morbidelli, A., et al. 2005a, Icarus, 175, 111
- (9) Bottke, W. F., Durda, D. D., Nesvorný, D., Jedicke, R., Morbidelli, A., et al. 2005b, Icarus, 179, 63
- (10) Chapman, C. R., Cohen, B. A., & Grinspoon, D. H. 2007, Icarus, 189, 233
- (11) Croft, S. K. 1985, Journal of Geophysical Research, 90, 828
- (12) de Elía, G. C., & Brunini, A. 2007, A&A, 475, 375
- (13) Farinella, P., & Davis, D. R. 1992, Icarus, 97, 111
- (14) Grieve, R. A. F., Robertson, P. B., & Dence, M. R. 1981, In: Multi-ring basins: Formation and evolution; Proceedings of the Lunar and Planetary Science Conference, Houston, TX. New York and Oxford, Pergamon Press, 37
- (15) Holsapple, K. A. 1993, Annu. Rev. Earth Planet. Sci., 21, 333
- (16) Holsapple, K. A., & Housen, K. R. 2007, Icarus187, 345
- (17) Housen, K. R., & Holsapple, K. A. 2003, Icarus163, 102
- (18) Ivanov, B. A., Melosh, H. J., & Pierazzo, E. 2011, 42nd Lunar and Planetary Science Conference, LPI Contribution N∘ 1608, 1717
- (19) Jedicke, R., Larsen, J., & Spahr, T. 2002, Asteroids III, Bottke, W. F., Cellino, A., Paolicchi, P., & Binzel, R. P. (Eds.), University of Arizona Press, Tucson, 71
- (20) McCord, T. B., Adams, J. B., & Johnson, T. V. 1970, Science, 168, 1445
- (21) McCord, T. B., & Sotin, C. 2005, Journal of Geophysical Research, 110, 5009
- (22) McKinnon, W. B., Schenk, P. M., & Moore, J. M. 2003, Impact Cratering: Bridging the Gap Between Modeling and Observations, 48
- (23) Melosh, H. J. 1982, Journal of Geophysical Research, 87, 371
- (24) O’Brien, D. P., & Greenberg, R. 2005, Icarus, 178, 179
- (25) O’Brien, D. P., Morbidelli, A., & Bottke, W. F. 2007, Icarus, 191, 434
- (26) O’Brien, D. P., Sykes, M. V., & Tricarico, P. 2011, 42nd Lunar and Planetary Science Conference, LPI Contribution N∘ 1608, 2665
- (27) Petit, J., Morbidelli, A., & Chambers, J. 2001, Icarus, 153, 338
- (28) Petit, J., Chambers, J., Franklin, F., & Nagasawa, M. 2002, Asteroids III, Bottke, W. F., Cellino, A., Paolicchi, P., & Binzel, R. P. (Eds.), University of Arizona Press, Tucson, 711
- (29) Press, W. H., Flannery, B. P., Teukolsky, S. A., & Vetterling, W. T. 1989, Numerical Recipies in Fortran. The Art of Scientific Computing. Cambridge Univ. Press, Cambridge.
- (30) Richardson, J. E. 2009, Icarus204, 697
- (31) Schenk, P. M., Chapman, C. R., Zahnle, K., & Moore, J. M. 2004, In: Jupiter. The planet, satellites and magnetosphere. Edited by Fran Bagenal, Timothy E. Dowling, William B. McKinnon. Cambridge planetary science, Vol. 1, Cambridge, UK: Cambridge University Press, 427
- (32) Schmidt, R. M., & Housen, K. R. 1987, Int. J. Impact Eng., 5, 543
- (33) Stuart, J. S., & Binzel, R. P. 2004, Icarus, 170, 295
- (34) Tanga, P., Cellino, A., Michel, P., et al. 1999, Icarus, 141, 65
- (35) Thomas, P. C., Binzel, R. P., Gaffey, M. J., et al. 1997, Science, 277, 1492
- (36) Thomas, P. C., Binzel, R. P., Gaffey, M. J., et al. 1997, Icarus, 128, 88
- (37) Thomas, P. C., Parker, J. Wm., McFadden, L. A., et al. 2005, Nature, 437, 224
- (38) Tsiganis, K., Gomes, R., Morbidelli, A., & Levison, H. F. 2005, Nature, 435, 459
- (39) Veverka, J., Robinson, M, Thomas, P., et al. 2000, Science, 289, 2088
- (40) Zolotov, M. Y. 2009, Icarus, 204, 183