Distance to G192.163.84Shiozaki et al.
masers—stars: formation—stars: individual(G192.163.84)
H2O maser motions and the distance of the star forming region G192.163.84
Abstract
We present the results of astrometic observations of H2O masers associated with the star forming region G192.163.84 with the VLBI Exploration of Radio Astrometry (VERA). The H2O masers seem to be associated with two young stellar objects (YSOs) separated by 1200 AU as reported in previous observations. In the present observations, we successfully detected an annual parallax of mas for the H2O masers, which corresponds to a distance to G192.163.84 of kpc from the Sun. The determined distance is shorter than the estimated kinematic distance. Using the annual parallax distance and the estimated parameters of the millimeter continuum emission, we estimate the mass of the disk plus circumstellar cloud in the southern young stellar object to be 10.0M⊙. We also estimate the galactocentric distance and the peculiar motion of G192.163.84, relative to a circular Galactic rotation: = 9.99 0.08 kpc, kpc, and [km s-1] respectively. The peculiar motion of G192.163.84 is within that typically found in recent VLBI astrometric results. The angular distribution and three-dimensional velocity field of H2O maser features associated with the northern YSO indicate the existence of a bipolar outflow with a major axis along the northeast–southwest direction.
1 Introduction
Measuring distances to astronomical objects with high accuracy allows us to unambiguously derive their physical parameters. Therefore, this is important especially for the legitimate identification of massive young stellar objects (MYSOs). Through a reliable estimation of the physical parameters of the MYSOs one enables to draw unambiguous conclusions about the most plausible scenarios for the formation of massive stars (see e.g., Cepheus A, [Patel et al. (2005), Moscadelli et al. (2009)]). To estimate the distances to star forming regions in the Galactic scale, the kinematic distance method has been commonly adopted. However, its accuracy significantly depends on how well we know the line-of-sight velocity of the source, as well as on the adopted Galactic constants and rotation curve (e.g., [Gómez et al. (2006)]). In addition, ambiguity between the near and far distance emerges for the observations towards the inner Galaxy. Furthermore, large deviations from a circular galactic rotation have been reported (e.g., [Xu et al. (2006), Reid et al. (2009), Baba et al. (2009)]). Thus, the estimated kinematic distances can be highly uncertain. The most straightforward method to determine the distance to astronomical objects is the trigonometric parallax method. Recent VLBI astrometric observations such as those carried out with, e.g., the Very Long Baseline Array (VLBA) and the VLBI Exploration of Radio Astrometry (VERA) have yielded trigonometric parallaxes on the kilo-parsec scale with errors less than 10%. The latter array is mostly dedicated for astrometry of Galactic maser sources (e.g., [Honma et al. (2007), Hirota et al. (2007), Nakagawa et al. (2008), Oh et al. (2010), Sato et al. (2010), Imai et al. (2011), Nagayama et al. (2011), Nakagawa et al. (2011)]).
| Reference | |||||||
|---|---|---|---|---|---|---|---|
| Date | VERA | velocity‡ | Beam§ | RMS noise | |||
| Epoch∗ | (yy/mm/dd) | telescopes† | (km s-1) | (mas, \arcdeg) | (Jy beam-1) | Nf∥ | |
| … | 2006/10/21 | MIZ,IRK,OGA,ISH | … | … | … | … | … |
| … | 2006/11/16 | MIZ,IRK,OGA,ISH | … | … | … | … | … |
| 1 | 2006/12/12 | MIZ,IRK,OGA,ISH | 11.8 | 1.260.73, | 41 | 0.1 | 5 |
| 2 | 2007/02/10 | MIZ,IRK,OGA,ISH | 11.8 | 2.240.65, | 52 | 0.7 | 5 |
| 3 | 2007/03/23 | MIZ,IRK,OGA,ISH | 11.8 | 1.430.79, | 45 | 0.4 | 9 |
| 4 | 2007/04/26 | MIZ,IRK,OGA,ISH | 11.8 | 1.910.67, | 53 | 1.0 | 7 |
| 5 | 2007/05/22 | MIZ,IRK,OGA,ISH | 11.8 | 1.470.76, | 45 | 0.5 | 8 |
| 6 | 2007/09/15 | MIZ,IRK,OGA,ISH | 11.8 | 1.990.63, | 44 | 1.4 | 6 |
| 7 | 2007/12/23 | MIZ,IRK,OGA,ISH | 11.8 | 1.270.92, | 41 | 0.2 | 5 |
| 8 | 2008/03/31 | MIZ,IRK,OGA,ISH | 1.7 | 1.310.90, | 43 | 0.1 | 11 |
| … | 2008/06/14 | IRK,OGA,ISH | … | … | … | … | … |
| … | 2008/06/21 | MIZ,OGA,ISH | 1.7 | 1.180.70, | 37 | 0.1 | … |
| 9 | 2008/07/07 | MIZ,IRK,OGA,ISH | 1.7 | 1.270.88, | 40 | 0.1 | 7 |
Numbering the epoch when the astrometric result was adopted to estimate an annual parallax and maser relative proper motions.
Telescopes participated in the observation. MIZ: VERA 20 m telescope at Mizusawa, Iwate, IRK: at Iriki, Kagoshima, OGA: at Ogasawara Islands, Tokyo, and ISH: at Ishigakijima, Okinawa.
Local-standard-of-rest velocity of the spectral channel used for the phase reference in data calibration.
Synthesized beam made with naturally weighted visibilities; major and minor axis lengths and position angle.
Number of detected maser features.
G192.163.84 (hereafter abbreviated as G192) is a widely studied object with a great potential to provide valuable insight in our understanding on the formation of intermediate and high mass stars. Based on the kinematic distance (2 kpc), it has been estimated that the ultracompact (UC) HII region in G192 contains a young star with a luminosity of and a spectral type B2. The existence of a giant bipolar outflow with Herbig-Haro objects and a possible circumstellar disk has been reported ([Devine et al. (1999)]; [Shepherd & Churchwell (1996)]; [Shepherd et al. (1998)], hereafter SWSC98; [Shepherd & Kurtz (1999)], hereafter SK99; [Shepherd, Claussen, & Kurtz (2001)], hereafter SCK01; [Indebetouw et al. (2003)]; [Shepherd et al. (2004)], hereafter SBCSK04). The H2O masers are roughly grouped into two clusters separated by 0.\arcsec6 in the north–south direction (SK99; SBCSK04; [Imai et al. (2006)], hereafter Paper I). The southern H2O maser cluster exhibits an alignment perpendicular to the outflow. Based on H2O maser and centimeter continuum observations, SK99 and SBCSK04 proposed that the southern H2O maser features are associated with a flattened rotating gas torus (1000 AU) around a B2 star, in which the maser velocities are roughly consistent with those in a Keplerian disk. Observations with the Japanese VLBI Network (JVN) revealed relative bulk motions of the two maser features in the southern cluster. Paper I demonstrated that the H2O maser features in the southern cluster are well explained by a model of an infalling-rotating disk with a radius of 1000 AU and a central stellar mass of 5–10 . Note that the size of the proposed rotating gas torus or disk is smaller than those detected so far around other early B stars (1700 AU around IRAS 201264104, [Cesaroni et al. (1999)]; 1800 AU around AFGL 5142, [Zhang et al. (2002)]). On the other hand, in the northern H2O maser cluster, the distribution of maser features is aligned with the major axis of an outflow traced by the 3.6 cm continuum emission (SK99).
In this paper we report the results of astrometric observations of the G192 H2O masers with VERA. Section 2 describes the VERA observation and the astrometric data analysis. Section 3 presents the obtained parallax distance and the secular motion of G192, yielded by tracing H2O masers in the northern cluster. The angular distribution and the 3D motions of the individual maser features are also presented in this Section. Section 4 discusses the physical parameters of G192 and the secular motion of G192 in the Galaxy.
2 Observations and data reduction
We have carried out VERA observations of the G192 H2O masers at 13 epochs from December 2006 to July 2008. Table 1 gives the summary of the observations. In the present study we have only used the data obtained in 9 epochs. In the rest of the observations, the weather conditions at some of the antennas sites were unfavorable. This resulted in much higher system noise temperatures at these antenna sites and the unsolved phase fluctuations in these observations degraded the image qualities of G192 in phase reference analyses. For each epoch, the observation duration was 8–10 hours, including scans on G192 and the calibrators (J053056.4133155, 3C 84 and DA 193). We observed the extragalactic quasar J060309.1174216 (hereafter J0603) simultaneously with G192 using VERA’s dual-beam system for the phase referencing (e.g., [Honma et al. (2003), Honma et al. (2008)]). The angular separation between G192 and J0603 is 1\arcdeg.66. The flux density of J0603 was 100 mJy with a small variation (20%). The coordinates of G192 and J0603 used as reference for the observation and the data correlation were set to (, ) (05h58m13.s53, 16∘31′58.′′9) and (, ) = (06h03m09130269, 17∘42′16.′′81070), respectively.
The received left-hand circular polarization signals were split into 16 base band channels with a band width of 16 MHz each and recorded at a rate of 1024 Mbit s-1. One of the base band channels was assigned to the observations of the maser source while the other fifteen were assigned to the reference source. The data correlation was carried out with the Mitaka FX correlator. The accumulation period of the correlation was set to 1 s. The correlation outputs consisted of 512 spectral channels, yielding a velocity spacing of 0.42 km s-1.
Most of the data reduction was carried out using the National Radio Astronomy Observatory’s Astronomical Image Processing System (AIPS) package. In order to obtain, the final maser image cubes with sensitivity and quality higher than those obtained in the phase-referencing technique (see below), we adopted the standard procedure (e.g., [Diamond (1995)]). This procedure consists of performing the fringe-fitting and self-calibration on the data of a Doppler-velocity channel that includes the brightest H2O maser spot (velocity channel component) in G192, which is used as a fringe-phase reference. Column 4 of Table 1 gives the line-of-sight velocity of the reference spectral channel with respect to the Local Standard of Rest (LSR) in each epoch. Thus, all maser spot positions were measured with respect to that of the reference spot. We found the location of each maser spot using the AIPS task SAD, which fits a two-dimensional Gaussian model to the brightness distribution in the map. The detection limit of a maser spot was typically 500 mJy beam-1 at a 7- noise level when no other bright maser was present in the same velocity channel map. The position of each H2O maser feature (a physical maser clump consisting of a cluster of maser spots or velocity components in a physical gas clump) was defined as the position calculated from an intensity-weighted mean of maser spot positions in the feature. We found that the typical spread of maser spot positions in each maser feature was 0.2 mas , which may give an upper limit to the wander of feature position determined by an intensity-weighted mean of spot positions. Column 7 of Table 1 gives the number of identified maser features in each epoch. Table 2 gives the list of all maser features detected in the observations.
In order to perform the maser source astrometry, some special procedures are needed (e.g., [Hirota et al. (2007), Imai et al. (2011)]). Firstly, the delay-tracking was reperformed for the correlated data by using better delay-tracking models obtained using software equivalent to the CALC9 package developed by the Goddard Space Flight Center/NASA VLBI group. Secondly, after the visibility amplitude calibration was made, independently for both the maser and reference source data, we used the scans on the phase-reference source J0603 to obtain the group delay and fringe-phase residuals of the fringe fitting using the AIPS task FRING. The solution interval was usually set to 1 min, sometimes to 2 or 3 min according to the number of available antennas and the system temperatures. Thirdly, in order to calibrate the visibility data of G192, we copied the calibration solutions table from the J0603 data into those of G192 using the AIPS task TACOP. Also, fringe phase and amplitude solutions obtained by self-calibration of the J0603 data were applied to the G192 data. As a result, we obtained the absolute positions of the bright spots at =1.7 – 12.6 km/s with respect to the reference source. We regarded detection of a maser spot as true when the spot was detected in more than 4 epochs. Note that no special correction for source parallactic angle rotation has been performed. The VERA’s receiving system is rotated so as to fix the fields of view with respect to the parallactic angles. In this case, it is expected that the difference in the linear polarization characteristics towards target and reference sources should be constant during a single observation session and the whole monitoring observations.
[t!]r@ r@lr@l@rrc
Parameters of the detected H2O maser features.
vLSR∗
Offset†(mas)
Feature
(km s-1)
(Jy beam-1)
(km s-1)
ID∥
R.A.
Dec.
\endfirsthead
vLSR∗
Offset†(mas)
Feature
(km s-1)
(Jy beam-1)
(km s-1)
ID∥
R.A.
Dec.
\endhead
∗∗{\ast} ∗∗{\ast} footnotemark: Local-standard-rest velocity at the intensity peak.
††{\dagger}††{\dagger}footnotemark: Position offset with respect to the brightest H2O maser spot whose Doppler-velocity channel was used for fringe fitting and self-calibration.
‡‡{\ddagger}‡‡{\ddagger}footnotemark: Peak intensity of the maser feature.
§§{\S}§§{\S}footnotemark: Full velocity width in which the maser emission was detected. The minimum value equals to the velocity spacing of a spectral channel (0.42 km s-1).
∥parallel-to{\parallel}∥parallel-to{\parallel}footnotemark: Ordinal number of the identification label for the maser features listed in Table 2. The ID is designated as G192:S2011-, where S2011 indicates that we are referring to the maser features found in the present work, and is the ordinal source number.
\endlastfoot2006 December 12
0.050 0.060 1.46 0.42 …
0.204 0.053 7.68 2.53 12
0.070 0.050 0.77 0.42 …
0.040 0.040 2.19 0.42 3
0.041 0.041 1.76 0.42 1
2007 February 10
0.134 0.022 22.21 2.95 12
0.220 0.100 4.85 0.42 …
0.056 0.059 1.37 0.84 10
0.090 0.070 0.91 0.42 …
0.050 0.040 1.40 0.42 1
2007 March 23
0.050 0.040 0.66 0.42 13
0.017 0.012 6.94 2.53 11
0.040 0.011 36.89 2.11 12
0.039 0.016 2.51 1.26 10
0.020 0.020 1.18 2.11 7
0.040 0.040 1.00 0.42 8
0.129 0.093 0.80 0.84 4
0.051 0.070 0.56 0.42 3
0.087 0.070 0.70 0.84 1
2007 April 26
0.080 0.080 1.20 0.42 13
0.026 0.017 42.06 2.95 12
0.045 0.045 8.31 1.26 10
0.010 0.063 5.93 1.27 7
0.050 0.080 3.07 0.42 8
0.040 0.040 2.83 0.84 4
0.152 0.072 1.97 1.26 3
2007 May 22
0.045 0.020 44.04 2.53 …
0.130 0.100 1.25 0.42 12
0.043 0.045 13.82 1.26 10
0.090 0.102 1.15 0.42 7
0.093 0.030 3.85 1.26 8
0.100 0.118 1.74 0.42 …
0.030 0.030 2.25 1.27 4
0.090 0.091 1.04 0.42 2
2007 September 15
0.026 0.063 27.29 1.69 12
0.050 0.060 3.64 0.42 11
0.050 0.050 5.08 0.42 …
0.020 0.066 10.27 1.26 10
0.040 0.040 3.93 0.42 …
0.060 0.090 2.00 0.42 …
2007 December 23
0.069 0.190 9.16 2.95 12
0.025 0.107 3.71 1.69 10
0.020 0.066 1.86 0.84 6
0.040 0.050 1.03 0.42 …
0.057 0.010 5.47 1.27 3
2008 March 31
0.027 0.095 4.55 2.11 12
0.117 0.074 1.67 1.26 10
0.125 0.010 4.40 1.26 5
0.080 0.090 0.85 0.42 9
0.060 0.102 1.14 0.42 …
0.050 0.131 1.06 0.84 6
0.050 0.074 0.85 0.42 …
0.023 0.001 97.51 2.53 3
0.129 0.030 1.40 0.84 …
0.070 0.060 0.61 0.42 …
0.040 0.080 2.63 0.42 …
2008 July 07
0.020 0.020 2.89 1.26 …
0.102 0.120 2.19 1.26 12
0.040 0.070 1.18 0.42 5
0.102 0.050 1.44 0.42 9
0.024 0.005 62.44 1.26 3
0.040 0.060 1.33 0.42 2
0.050 0.050 1.35 0.42 …
3 Results
3.1 Relative proper motions of the H2O masers
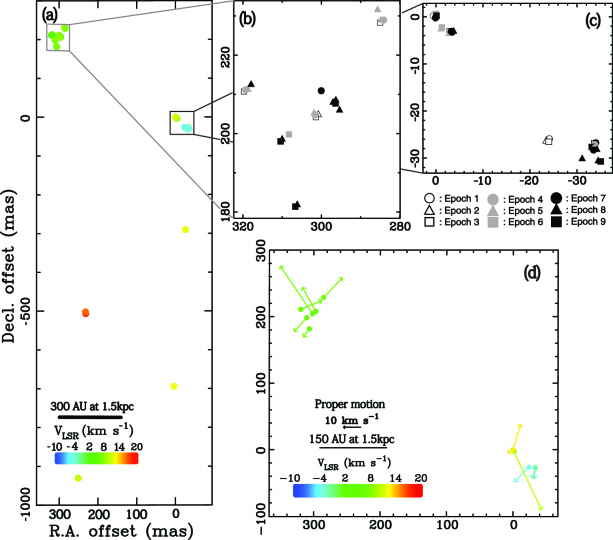
Panel (a) of Figure 1 shows the angular distribution of the H2O maser features in G192 found in this paper. They were located in an area of 0.\arcsec71.\arcsec3 and their spatial distribution of roughly reproduced those found in the previous VLA/VLBA/JVN observations (SK99; SBCSK04; Paper I). Towards the northern region, the maser features appear to be grouped in two clusters. The north-eastern cluster is redshifted with respect to the cluster located in the south-west direction. Panels (b) and (c) show the time variation of the angular distribution of the maser features in these clusters. Some of the maser features were detected in the southern region. Their velocity distribution is consistent with that proposed in the infalling-rotating disk model in Paper I. However, it is difficult to discuss the plausible velocity field in more detail in this paper due to a small number of the detected maser features and the lack of information of their relative proper motions.
For the northern clusters, we detected relative proper motions of twelve H2O maser features with respect to a reference feature labeled as G192:S2011-12 (see the footnote in Table 2 for the explanation of the nomenclature). The proper motions were measured from those maser features that were detected in at least two epochs and that showed a displacement of 10 mas within a velocity drifts of 1 km s-1. Table 2 gives the parameters of the proper motions of twelve maser features. To estimate the maser proper motions with respect to the northern YSO in G192 (associated with the norther maser clusters), we assume that from the reference in which the YSO is fixed the vectorial sum of the proper motions of all the maser features equals zero. In order to do this, first we obtained the average of the proper motions of the masers with respect to the reference feature: (, )=(0.360.14, 0.300.14) [mas yr-1]. Then, by subtracting it from (, ), we obtained the proper motions with respect to the reference frame that will move together with the G192 system. Panel (d) of Figure 1 shows the three-dimensional velocity field of the maser features with respect to the northern YSO. The average expansion velocity of the masers in the jet is around vexp17 km s-1 (considering a distance of kpc, see below), although there are a few of maser features that move as fast as 40 km s-1. As mentioned above, the proper motions of the southern maser features found in previous observations could not be reconfirmed by the present observations most probably due to their very short lifetimes.
| Maser feature∗ | Offset† | Proper motion† | Radial motion‡ | ||||||||||||||
| (G192:S2011-) | (mas) | (mas yr-1) | (km s-1) | Detection for 9 epochs§ | |||||||||||||
| R.A. | decl. | ∥ | 1 | 2 | 3 | 4 | 5 | 6 | 7 | 8 | 9 | ||||||
| 1 | 0.29 | 0.26 | 0.42 | ||||||||||||||
| 2 | 0.09 | 0.10 | 0.21 | ||||||||||||||
| 3 | 0.03 | 0.01 | 1.12 | ||||||||||||||
| 4 | 0.55 | 0.48 | 0.98 | ||||||||||||||
| 5 | 0.49 | 0.26 | 0.74 | ||||||||||||||
| 6 | 0.20 | 0.54 | 0.84 | ||||||||||||||
| 7 | 0.23 | 0.48 | 1.20 | ||||||||||||||
| 8 | 0.52 | 0.63 | 0.21 | ||||||||||||||
| 9 | 0.48 | 0.38 | 0.21 | ||||||||||||||
| 10 | 0.04 | 0.06 | 1.26 | ||||||||||||||
| 11 | 0.11 | 0.13 | 1.37 | ||||||||||||||
| 12♯ | 0.03 | 0.05 | 2.34 | ||||||||||||||
| 13 | 1.02 | 0.96 | 0.21 | ||||||||||||||
H2O maser features detected toward G192.163.84. The feature ID is designated as G192:S2011-, where S2011 indicates that we are referring to the maser features found in this work, and is the ordinal source ID number given in this column.
Relative value with respect to the motion of the position-reference maser feature G192.163.84: S2011 1.
Relative value with respect to the local standard of rest.
detection, negative detection.
Mean full velocity width of a maser feature at half intensity.
Reference feature for the relative proper motion measurement.
| Spot ID∗ | VLSR | Detection at 9 epochs§ | Parallax†(mas) | Absolute proper motion‡(mas yr-1) | ||||||||||||
| (km s-1) | ||||||||||||||||
| 1 | 2 | 3 | 4 | 5 | 6 | 7 | 8 | 9 | ||||||||
| 12a | 12.6 | 0.578 | 0.120 | 1.01 | 0.13 | 2.08 | 0.16 | |||||||||
| 12b | 12.2 | 0.632 | 0.108 | 1.02 | 0.13 | 2.00 | 0.16 | |||||||||
| 12c | 11.8 | 0.641 | 0.066 | 1.13 | 0.10 | 1.94 | 0.12 | |||||||||
| 12d | 11.4 | 0.667 | 0.100 | 1.06 | 0.10 | 1.69 | 0.12 | |||||||||
| 12e | 11.0 | 0.678 | 0.129 | 1.01 | 0.10 | 1.66 | 0.12 | |||||||||
| 12 Average [Standard deviation] | 1.05 | 0.26 [0.01] | 1.88 | 0.31 [0.17] | ||||||||||||
| 10a | 10.1 | 1.144 | 0.546 | 0.29 | 0.27 | 1.00 | 0.32 | |||||||||
| 10b | 9.7 | 0.683 | 0.071 | 0.31 | 0.15 | 1.28 | 0.18 | |||||||||
| 10c | 9.3 | 0.774 | 0.142 | 0.36 | 0.15 | 1.41 | 0.18 | |||||||||
| 10 Average [Standard deviation] | 0.32 | 0.34 [0.03] | 1.23 | 0.57 [0.17] | ||||||||||||
| 3a | 1.7 | 0.617 | 0.095 | 1.05 | 0.11 | 2.65 | 0.13 | |||||||||
| Combined fit | 0.659 | 0.036 | ||||||||||||||
ID of maser spot. A Greek letter ID is assigned to each spot in the feature designated in the feature ID. See the maser feature designation in Table 3.
Detected annual parallax.
Spot motion on the plane of sky in the R.A. and Decl directions, respectively. The results here were obtained by fitting with assuming an annual parallax of 0.66 mas.
3.2 Annual parallax of G192.163.84
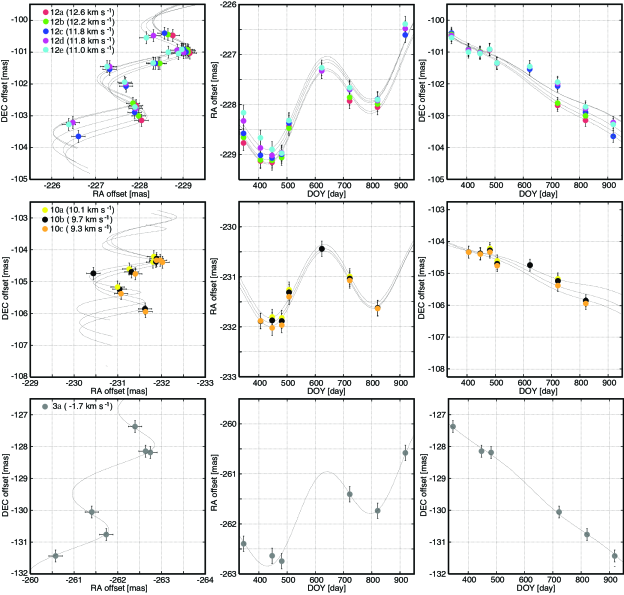
To measure the annual parallax of G192 we focused our attention on the motions of nine maser spots with respect to the position reference J0603. These maser spots are contained within the reference feature G192:S2011-12 as well as in the features G192:S2011-10 and -3 (see Table 4); they were successively detected during a period longer than a year, so they were suitable for the annual parallax measurement (see Figure 2). Table 3 shows the measured parallaxes and absolute proper motions of the individual spots. The adopted position errors were derived from the position uncertainties that rescaled so as to set the reduced value to unity in the least-squares fitting. This is necessary because the position errors that were originally determined by the Gaussian fits to the brightness distributions underestimate the true position uncertainty. The causes of the position uncertainty have been discussed in previous papers based on VERA astrometry. In the present work for a relatively near object, they are mainly attributed to the temporal variation of the brightness structure in the maser spots. The final position error resulted to be 0.15 mas in right ascension and 0.19 mas in declination. Figure 2 shows the best-fit model to the motion of each spot. Each color corresponds to a different maser spot (for which also a letter is assigned, see Table 3). The label number indicates the ordinal number of the maser feature to which the spot belongs. In addition, we performed a combined fit, in which a common annual parallax was estimated from all of the maser spot motions with different linear motion vectors. We adopted the result of the combined fit as the final one for the annual parallax determination, which gives a value mas, corresponding to a distance to G192 of kpc.
3.3 Motion of G192.163.84 in the Galaxy
We estimated the location and the three-dimensional motion of G192 in the Galaxy, based on its derived distance, proper motion, and radial velocity. The absolute systemic motion of G192 is derived from the the average absolute proper motion of the reference feature plus the relative systemic motion of G192 with respect to the reference feature (, )=() [mas yr-1]. The former motion is calculated as the average of the five maser spot motions in the reference feature, yielding a motion of (, ) = (1.050.05, 1.870.06) [mas yr-1]. Thus, we obtained the G192 motion of (, ) = (0.690.15, 1.570.15) [mas yr-1]. Here, we adopted the error values derived from the dispersion of the proper motions of the maser spots in reference feature as the uncertainty of the G192 motion. The mean Doppler velocity of about = 5.7 km s-1 is consistent within 1 km s-1 with that derived from the CO molecular outflow seen on a much larger scale (e.g., SK99). Therefore, we adopt = 5.7 km s-1 as the systemic velocity. The derived systemic motion vector is converted to (1.73,0.16) [mas yr-1] in galactic coordinates.
To find the systemic motion vector in the Galaxy, we adopted the solar motion vector, (, , )=(10.0 0.4, 5.2 0.6, 7.2 0.4) [km s-1] based on the HIPPARCOS satellite data (Dehnen & Binney, 1998). Here the axes point towards the galactic center, the direction of galactic rotation, and the northern galactic pole, respectively. We also adopted the IAU standard values for the galactic constants, = 8.5 kpc (the distance to the Sun from the Galactic center) and 220 km s-1 (the circular rotation speed of the LSR).
With the distance of = 1.520.08 kpc and the radial velocity of 5.7 km s-1 obtained in the present paper, we estimate the peculiar motion of G192 relative to a circular Galactic rotation as follows,
where is the distance to G192 from the galactic center and the distance to G192 from the galactic mid-plane. The uncertainty of peculiar motion is derived from those of the solar motion and the systemic motion of G192. These results suggest that G192 is located at the Perseus spiral arm, which is spread in the range of Galactocentric distance of 10–11 kpc in this direction (Reid et al., 2009; Oh et al., 2010). We also note that G192 is located 100 pc below the galactic mid-plane, which may give a lower limit to the thickness of the “thin disk” component as a site of recent star formation. The origin of the peculiar motion is discussed in the next section.
4 Discussion
4.1 Re-estimating the southern YSO’s mass
In this section, we adopt a value of 1.52 kpc as the distance to G192, which was determined from the annual parallax in substitution of the previous uncertain kinematic distance (2 kpc; Shepherd & Churchwell (1996)) to re-estimate the physical parameters of the southern YSO. Firstly, we re-scaled the stellar luminosity of G192 from (SWSC98) to . Therefore, the spectral type of G192 should be revised from B2 to spectral type B3. Secondly, we re-estimated the mass of the disk plus circumstellar envelope of the southern YSO, which was originally estimated by SK99 from observations of millimeter continuum emission. Using equation (1) of SK99 (see also Hildebrand (1983)), these authors mention that this value should be constrained within the range (c.f. SWSC98). Note that the estimated mass of the southern YSO is proportional to square of the distance, in this equation. By adopting the distance obtained from our work, we modified this value to be . We have also modified the mass value of the 7 mm continuum emission source from 6.7 to 3.9.
This suggests that the southern YSO is an intermediate-mass star but it is still consistent with the existence of a giant outflow and Herbig-Haro objects, as those actually observed, driven by such a YSO. On the other hand, it should be re-evaluated whether the centimeter emission originates from an HII region as seen in MYSOs. Thus, although it is difficult to explore G192 as a site of massive star formation, it is still an interesting source, which may directly exhibit the mass accretion onto a YSO that may be traced by H2O maser emission (Paper I).
4.2 The origin of the peculiar motion of G192.163.84
The slower galactic rotation velocity of G192 by 10 km s-1 with respect to the local standard of rest in the Perseus Arm is similar to the cases of S252 (Reid et al., 2009) and IRAS 06058+2138 (Oh et al., 2010), which are located at a similar Galactic longitude and in the Perseus arm. The new distance value for G192 is consistent with the existence of a ”dip profile” in the Galactic rotation curve as shown by previous observations (Fich et al. (1989); Honma & Sofue (1997); Demers & Battinelli (2007); Sofue et al. (2009); Oh et al. (2010)). The dip profile is seen from 8.5 to 11 kpc from the observations of the HI and CO molecular emission. The outer part of the rotation curve exhibits a flat profile. It is noteworthy to mention that G192 seems to be located in the ”down stream” of the density wave in the spiral arm, where newly-born stars are concentrated. However, such discussion is still based on a small sample of sources in a small portion of the Perseus arm. Therefore, more observations to several directions are necessary to examine the existence of a dip profile. Note that the peculiar motion of G192 with respect to the Galactic rotation still remains within those widely seen in other H2O maser sources. We note that the northern YSO is relatively approaching the southern YSO with a velocity of 12 km s-1, assuming that the latter follows a circular galactic rotation. We pondered whether this motion is explained by an orbital motion. First, we supposed the case in which the northern YSO and the southern one are gravitationally bound. Since the northern YSO in G192 has a lower mass than the southern YSO (SK99), we suppose that the former should be orbiting the latter according to Kepler’s law. Although the real separation between the YSOs is unknown, a minimum value of 900 AU is adopted (see Figure 2 of Paper I). Thus a lower limit to the enclosed mass is calculated to be 150 , which turns out to be much higher than that estimated in the previous section. Therefore, we conclude that the observed peculiar motion may be attributed to the Galactic dynamics rather than to the orbiting motion of the northern YSO around the southern one. However, the motion of the southern YSO should be directly measured to obtain an unambiguous conclusion.
4.3 The outflow development in the northern YSO
SBCK04 and Paper I suggest that there are two parallel outflows in G192, one of which is highly collimated and almost completely parallel to the maser jet. It is also expected that the northern and southern objects started their star-formation process from a common molecular cloud core and these outflows simultaneously started so as to have the same dynamical age. Thus, the evolution speed is surely different, but the elapsed time after the star formation starts in northern and southern objects is the same. Therefore, we can regard that the physical parameters of the outflows are similar even in the case that the mass of the objects are different. In addition, we adopt the extent of HH objects as the true size of the flow rather than the size of the distribution of the maser spot. Based on the 3D kinematical structure of the H2O masers that are associated with the outflow driven by the northern YSO, we estimated the dynamical ages of the bipolar outflows in G192. We estimated an upper limit of the lengths of these outflows projected on the sky to 5.7 pc from the existence of the Herbig-Haro objects HH 396/397 (Devine et al. (1999), see also the 12CO emission map of SWSC98). We also estimated the velocity of the outflows of 40 km s-1 from the motion of the blue-shifted maser feature G192:S2011-11, which is the one moving at the highest speed in the vicinity of the flow’s kinematical center (see figure 1). Assuming a constant velocity in the whole outflow, the dynamical age of the outflows is estimated to be yr. This value is shorter by a factor of 1.5 than that previously estimated value without any information of the 3-D flow velocity (2.0105 yr, Snell et al. (1990); SWSC98; Devine et al. (1999)). This suggests that G192 is either in the late stage of massive star formation (in the case that a MYSOs really exist) or in the phase of main mass accretion onto a lower mass YSO with the development of highly collimated outflows. We note that the derived time scale is comparable to the whole duration of H2O maser activity (Genzel & Downes, 1977) although it looks much longer than those of the outflows traced by H2O maser emission in other massive-star forming regions ( yr). The coexistence of H2O maser features in both the northern and southern YSOs with different stellar mass and evolutionary phases may support the time scale of yr.
5 Conclusions
We have measured an annual parallax of G192, mas, corresponding to a distance kpc from the Sun, using VLBI astrometric observations with VERA in a time span of nearly two years. We have also derived the angular distribution and three-dimensional velocity field of H2O masers in the northern YSO of G192. From the present observations, we have re-estimated the mass of the disk plus circumstellar cloud in the southern cluster and concluded that they may be an intermediate-mass YSO. The H2O masers trace a bipolar outflow with a major axis along the northeast–southwest direction and are located at the northern parts in G192. The outflow found in this region is well explained as to be driven by an intermediate-mass YSO as seen in Herbig-Haro objects. The dynamical age of the outflows is also estimated to be yr (shorter by a factor of 1.5 than those previously estimated), suggesting that this source may be in the phase of main mass accretion with development of highly collimated outflows. In addition, we have obtained the location and the peculiar motion of the object with respect to a circular Galactic rotation. The peculiar motion of G192 is likely to be within the typical values as those widely found in other MYSO H2O maser sources. However, it should be further explored for understanding the relation between the star formation process and the galactic motion. On the other hand, we could not detect internal motions in the southern maser clusters, which should be explored in future VLBI observations when the target maser components are visible.
HI has been financially supported by Grant-in-Aid for Young Scientists from the Ministry of Education, Culture, Sports, Science, and Technology (18740109) as well as by Grant-in-Aid for Scientific Research from Japan Society for Promotion Science (20540234). DT acknowledges support from the Japan Society for Promotion of Science (project ID: 22-00022)
References
- Baba et al. (2009) Baba, J., Asaki, Y., Makino, J., Miyoshi, M., Saitoh, T. R., & Wada, K., 2009, ApJ, 706, 471 Cesaroni, R., Felli, M., Jenness, T., Neri, R., Olmi, L., Robberto, M., Testi, L., & Walmsley, C. M. 1999, A&A, 345, 949
- Cesaroni et al. (1999) Cesaroni, R., Felli, M., Jenness, T., Neri, R., Olmi, L., Robberto, M., Testi, L., & Walmsley, C. M. 1999, A&A, 345, 949
- Dehnen & Binney (1998) Dehnen, W., & Binney, J. J. 1998, MNRAS, 298, 387
- Demers & Battinelli (2007) Demers, S., & Battinelli, P. 2007 A&A, 473, 143
- Devine et al. (1999) Devine, D., Bally, J., Reipurth, B., Shepherd, D. S., & Watson, A. M., 1999, AJ, 117, 2919
- Diamond (1995) Diamond, P. J., 1995, in ASP Conf. Ser. 82, VERY LONG BASELINE INTERFEROMETRY AND THE VLBA, ed., J. A. Zensus, P. J. Diamond, & P. J. Napier (San Francisco: ASP), p. 227
- Fich et al. (1989) Fich, M., Blitz, L., & Stark, A. A. 1989, ApJ, 342, 272
- Genzel & Downes (1977) Genzel, R., & Downes, D., 1977, A&AS, 30, 145
- Gómez et al. (2006) Gómez, G. C. 2006, AJ, 132, 2376
- Hildebrand (1983) Hildebrand, R. H. 1983, QJRAS, 24,267
- Hirota et al. (2007) Hirota, T., et al., 2007, PASJ, 59, 897
- Honma & Sofue (1997) Honma, M., & Sofue, Y. 1997, PASJ, 49, 453
- Honma et al. (2008) Honma, M., et al., 2008, PASJ, 60, 935
- Honma et al. (2003) Honma, M., et al., 2003, PASJ, 55, L57
- Honma et al. (2007) Honma, M., et al., 2007, PASJ, 59, 889
- Imai et al. (2011) Imai, H., et al., 2011, PASJ, 63, in press
- Imai et al. (2006) Imai, H., et al., 2006, PASJ, 58, 883 (Paper I)
- Indebetouw et al. (2003) Indebetouw, R., Watson, C., Johnson, K. E., Whintney, B., & Churchwell, E., 2003, ApJ, 596, L83
- Moscadelli et al. (2009) Moscadelli, L., Reid, M. J., Menten, K. M., Brunthaler, A., Zheng, X. W., & Xu, Y., 2009, ApJ, 693, 406
- Nagayama et al. (2011) Nagayama, T., et al., 2011, PASJ, 63, in press
- Nakagawa et al. (2011) Nakagawa, A., et al., 2011, PASJ, 63, in press
- Nakagawa et al. (2008) Nakagawa, A. et al., 2008, PASJ, 60, 1013
- Oh et al. (2010) Oh, C. -S., Kobayashi, H., Honma, M., Hirota, T., Sato, K., & Ueno, Y. 2010, PASJ, 62, 101
- Patel et al. (2005) Patel, N. A., et al., 2005, Nature, 437, 109
- Reid et al. (2009) Reid, M. J., Menten, K. M., Brunthaler, A., Zheng, X. W., & Xu, Y. 2009, ApJ, 693, 397
- Sato et al. (2010) Sato, M. et al., 2010, PASJ, 62, 287
- Shepherd et al. (2004) Shepherd, D. S., Borders, T., Claussen, M. J., Shirley, Y. & Kurtz, S. E. 2004, ApJ, 614, 211 (SBCSK04)
- Shepherd, Claussen, & Kurtz (2001) Shepherd, D. S., Claussen, M. J., & Kurtz, S. E. 2001, Science, 292, 1513
- Shepherd & Kurtz (1999) Shepherd, D. S., & Kurtz, S. E., 1999, ApJ, 523, 690 (SK99)
- Shepherd et al. (1998) Shepherd, D. S., Watson, A. M., Sargent, A. I., & Churchwell, E. 1998, ApJ, 507, 861 (SWSC98)
- Shepherd & Churchwell (1996) Shepherd, D. S., & Churchwell, E., 1996, ApJ, 472, 225
- Snell et al. (1990) Snell, R. L., Dickman, R. L., & Huang,Y.-L., 1990, ApJ, 352, 139
- Sofue et al. (2009) Sofue, Y., Honma, M., & Omodaka, T. 2009, PASJ, 61, 227
- Thompson (1984) Thompson, R. I. 1984, ApJ, 283, 165
- Xu et al. (2006) Xu, Y., Reid, M. J., Zheng, W. W., & Menten, K. M., 2006, Science, 311, 54
- Zhang et al. (2002) Zhang, Q., Hunter, T. R., Sridharan, T. K., & Ho, P. T. P., 2002, ApJ, 566, 982