Stellar Populations and the Star Formation Histories of LSB Galaxies: I. Optical and H Imaging
Abstract
This paper presents optical and H imaging for a large sample of LSB galaxies selected from the PSS-II catalogs (Schombert et al. 1992). As noted in previous work, LSB galaxies span a range of luminosities () and sizes (0.3 kpc 10 kpc), although they are consistent in their irregular morphology. Their H luminosities (L(H) range from 1036 to 1041 ergs s-1 (corresponding to a range in star formation, using canonical prescriptions, from 10-5 to 1 M☉ yr-1). Although their optical colors are at the extreme blue edge for galaxies, they are similar to the colors of dwarf galaxies (van Zee 2001) and gas-rich irregulars (Hunter & Elmegreen 2006). However, their star formation rates per unit stellar mass are a factor of ten less than other galaxies of the same baryonic mass, indicating that they are not simply quiescent versions of more active star forming galaxies. This paper presents the data, reduction techniques and new philosophy of data storage and presentation. Later papers in this series will explore the stellar population and star formation history of LSB galaxies using this dataset.
1 Introduction
The key to understanding the evolution of late-type galaxy systems is their star formation history. For while a majority of their stellar mass originates from the epoch of galaxy formation, their current visual appearance is driven by star formation over the last Gyr (Gallagher et al. 1984). Thus, studies of the characteristics of star forming galaxies is a glimpse into the process of star formation and, thus, a window into the conditions that played a role during the galaxy formation era.
Late-type galaxies come in a range of morphological appearances and their study has been, for decades, been dominated by the extremely bright, actively star forming examples such as NGC 4449 (Huchra et al. 1983). The advent of newer all-sky surveys in the 1980’s/90’s demonstrated the importance of low surface brightness (LSB) galaxies to the galaxy population, and opened up a wider range of irregular late-type galaxies for study. Although initial suggestions were that LSB galaxies dominate the total galaxy population of the Universe over their higher surface brightness (HSB) cousins, it was later found to be untrue (Rosenbaum & Bomans 2004, Hayward, Irwin & Bergman 2005). Nonetheless, LSB galaxies offer a new avenue for the study of galaxy evolution, having low stellar densities and recent star formation rates. Their study, as a class of galaxies, has merit for stellar population work.
Star formation in galaxies falls into three crude categories: 1) hyper-efficient, typically associated with tidal or merger events (Whitmore et al. 2005), 2) normal, associated spiral galaxies under density wave or stochastic processes (Young et al. 1996) and 3) bursts followed by long quiescent periods, typically associated with dwarf galaxies (Schombert et al. 2001). LSB galaxies, almost by definition, are found in the third category and are assumed to have had below average star formation rates for their entire lifetimes to explain their star-forming blue colors, yet low stellar densities.
This project is focused on obtaining optical and H imaging of a sample of LSB galaxies with known HI properties. For knowledge of the blue optical colors, H emission and HI gas mass provides constraints on the dominant stellar population for the last few Gyrs, the current star formation rate and the potential total star formation rate (i.e., the amount of material available to produce stars). Integrated values speak to the global history of star formation, but, in addition, spatial color and H information can distinguish between episodic bursts of star formation versus quasi-continuous modes (Gerola, Seiden & Schulmann 1980, van Zee 2001).
In this paper, we present color and H imaging for a large sample of LSB galaxies, not restricted by size or total luminosity. As these galaxies also have aperture HI measurements, this sample will comprise one of the largest sets of LSB galaxy data to date with complete stellar and gas observations. We will present the techniques, analysis and reduced data for , and H imaging and comparison to other samples, but will reserve interpretation and modeling for later papers. We will also present the data in a new format so that interested readers can extract the reduced values as well as the scripts that were used to convert the apparent values to astronomically meaningful values. This brings a new level of transparency to datasets where the individual can not only follow the corrections and transformations applied to the raw data, but substitute their own values and seamlessly produce their own final datasets.
2 Sample Selection and Observations
Our sample of LSB galaxies was primarily selected from the catalog of Schombert et al. (1992) and Schombert, Pildis & Eder (1997). Those project’s goals were to observe a large number of LSB dwarf galaxies to test biased galaxy formation scenarios. The resulting sample was by no means restricted to dwarf galaxies (LSB appearance does not correlate with galaxy mass, Pildis, Schombert & Eder 1997). A number of LSB galaxies from the original PSS-II catalog (Schombert & Bothun 1988) were also included. The basic criteria for the PSS-II catalog was to find objects that simply do not fit into the normal Hubble sequence, such as spirals or HSB irregulars, and were LSB in character (this visual selection was later determined to be approximately 23 mag arcsec-2).
Target selection for follow-up optical and H imaging used a combination of object morphology, redshift and position in the sky. Astrophysically, we wished to sample a range of sizes, luminosities and HI masses. Filter constraints for H imaging restricted the redshift range to less than 8,000 km/sec. All the objects are between 10 and 30 declination (the Arecibo window). Observing schedules restricted the right ascension window to between 23H and 4H in the fall, 8H and 13H in the spring. An effort was made to avoid galaxies with clear spiral patterns, as they have been studied by others (Kennicutt et al. 2008).
The final sample is given in Tables 1 and 2. The columns in Table 1 are as follows: 1) galaxy name, 2) run number (K, for KPNO, plus MMYY), 3) distance in Mpc (taken from NED), 4) absolute magnitude, 5) central surface brightness from exponential fit, 6) scalelength in kpc, also from an exponential fit, 7) mean color, 8) mean color and 9) axial ratio at the 25 mag arcsecs-2 isophote. The columns in Table 2 are as follows: 1) galaxy name, 2) H flux, 3) H luminosity, 4) stellar mass, following the prescription of Schombert et al. (2000), 5) HI gas mass, again from Schombert et al. (2000), 6) baryon mass (stellar plus gas), 7) the gas fraction and the birthrate function (SFR/).
We imaged 59 LSB dwarfs and disks plus the well-studied dwarfs DDO154 and DDO168 for comparison. The spiral galaxy UGC 128 was also imaged as a control HSB disk galaxy. Selection by morphology for the original catalog did not exclude luminous or large galaxies, however, selection for galaxies with redshifts less than 8,000 km/sec (to fit within the H filter set) eliminates the high redshift Malin cousins. We note that a late-type morphological criteria does select for galaxies with high HI/L ratios (Schombert, Pildis & Eder 1997). The final sample ranges from 19.5 to 12.5 and from 0.1 to 5 kpc in scale length.
The imaging for this project was obtained during three runs (two spring: K0308 & K0309, one fall: K1007) on the KPNO 2.1m. A series of narrow band filters were used to acquire ON/OFF H frames. The KPNO H filters used were 1391, 1494, 1563, 1564, 1565 and 1566. These filters are 70Å wide centered at 6620, 6658, 6573, 6618, 6653 and 6709Å respectfully. This gave us velocity coverage from 0 km/sec to 8,000 km/sec, which contains 80% of the Schombert LSB catalog. The ON filter was selected to match the galaxy velocity, the OFF filter was nearest filter either above or below in velocity space.
In addition, deep and frames were obtained for every galaxy in the sample during the same observing runs in order to perform two color surface photometry (). Typical exposure times were 3 sets of 150 sec frames, 3 sets of 300 sec frames and 6 pairs of 600 sec H ON/OFF frames (i.e. a total of one hour ON and one hour OFF). The plate scale is 0.61 arcsecs per pixel for a field of view of 10.4 arcmins. Note that 23 of these galaxies were also imaged in for a previous project (Pildis, Schombert & Eder 1997), this was done on a different detector and telescope and requires some processing to combine with the current sample.
3 Data Reduction
Data reduction followed the standard procedures for low readout noise CCD’s. Dark subtraction used overscan regions. Image flattening used dome flats and no large scale features are seen to the 0.1% level over the inner 80% of each frame. Calibration used Landolt (1992) standards for and , and Stone (1996) standards for the H filters. Standard KPNO airmass corrections were applied to all frames, although the greatest airmass observed was only 1.18. Multiple frames were registered using internal stars then clipped-summed to eliminate cosmic rays.
The frames were then registered, cleaned, then summed for ellipse and surface brightness fitting. Sky values were first determined by visually assigning sky boxes to regions free from other objects. These sky boxes were recorded and used to determine sky in the and H frames. Sky boxes are the most useful method of determining the true sky value for LSB galaxies as they register any large scale variations across the region around the galaxy as well as provide a measure of the random error ( within each box) and a measure of the error on the mean value (the between the means of each box). The error in the sky dominates most of the photometric values for LSB galaxies. The typical errors in the mean sky value were between 0.1 and 0.2%. This corresponds to a 1 sky error of 28.3 mags arcsecs-2.
The ellipse values for the frames are used to define apertures for colors and H values. Cleaning was an automatic process of the ellipse fitting routines (see ARCHANGEL, Schombert 2007). However, in a few cases of nearby bright stars or embedded stars, these objects were manually cleaned. Cleaned areas were re-filled using intensity values based on the averaged ellipse that passed through each pixel. This was only significant for cleaned stars with the main body of the galaxy and was never more than 4% the total luminosity of the galaxy.
Isophotal analysis begins with fitting ellipses to the cleaned image. Fitting. a best ellipse to a set intensity values in a 2D image is a relatively straight forward technique that has been pioneered by Cawson et al. (1987) and refined by Jedrzejewski (1987) (see also an excellent review by Milvang-Jensen & Jorgensen 1999). The core routine from these techniques (PROF) was eventually adopted by STSDAS IRAF (i.e. ELLIPSE). The primary fitting routine for this project follows the same techniques (in fact, uses much of the identical FORTRAN code from the original GASP package of Cawson) with some notable additions.
These codes start at some intermediate distance from the galaxy core with an estimated x-y center, position angle and eccentricity to sample the pixel data around the given ellipse. The variation in intensity values around the ellipse can be expressed as a Fourier series with small second order terms. Then, an iterative least-squares procedure adjusts the ellipse parameters searching for a best fit, i.e. minimized coefficients. There are several halting conditions, such as maximum number of iterations or minimal/extreme change in the coefficients, which then moves the ellipse outward for another round of iterations. Once a stopping condition is met (edge of the frame or sufficiently small change in the isophote intensity), the routine returns to the start radius and completes the inner portion of the galaxy. A best fit ellipse is always found in all the frames, although for the more irregular galaxies it is clear that an ellipse is a forced figure onto the isophotes. We will discuss the merit of this process in our structure paper.
Final fits were visually inspected for robustness, converted to 1D surface brightness profiles and fit to an exponential disk. A small number of objects had significant bulges, but r1/4 fits to the bulges did not significantly alter the disk fits due to the small bulge size. Both surface brightness profiles, aperture magnitudes and color profiles are based on these fits. For consistency, the ellipse fits were applied to the and H frames (after registration) to produce aperture luminosities and colors (i.e. the same pixels are integrated by aperture in all frames).
All the reduced values, single parameters (e.g., total luminosity) and array values (e.g., surface brightness profiles) are all stored in XML format and placed at the data website (http://abyss.uoregon.edu/js/lsb). In addition, the data website contains the scripts (written in the Python computer language) which are used to convert raw telescope values into astronomical meaningful parameters. These well commented scripts allow the user to follow all the details for data reduction, rather than attempting to extract the procedures from the published text. Many of the calibrating values (e.g. Galactic extinction, CMB distance) are obtained over the network (e.g. NED), and those scripts are also found at the website. In addition, we compare our values with galaxies in common from other studies. However, certain parameters, such as distance, have changed since the original studies were published. Thus, this script’s procedures contain all the information to convert other datasets into a common framework for comparison to our data.
An additional challenge is to visually present the data for a large range of galaxy sizes and morphology. For it is the spatial color and intensity information that will address many of the star formation issues. Structural information is summarized by surface brightness profiles, which are displayed for all the galaxies at the data website.
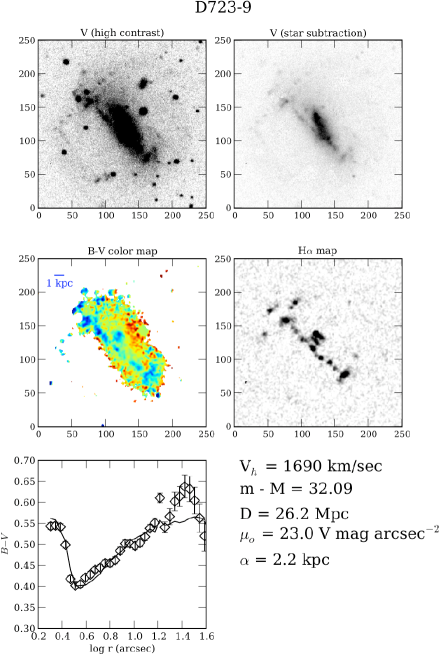
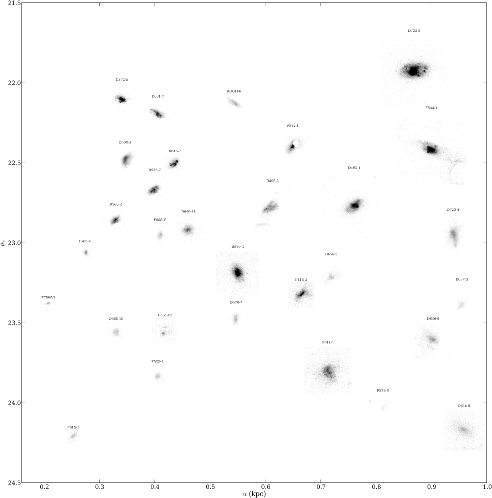
The image information (appearance, H and color maps) are summarized in a fashion shown in Figure 1 (with the whole sample found at the data website). This visual summary includes two grayscale images (on the left at high contrast, on the right at low contrast with nearby stars removed), a two color () map (blue is , red is ), a high contrast H map, the color profile and list of the galaxy’s structural parameters.
Note that absolute values are based on distances taken from NED (NASA’s Extragalactic Database) using the concordance model (i.e. NED’s cosmology-corrected distance). All redshifts were based on 21-cm HI measurements (Eder & Schombert 2000). For nearby objects in the Hunter & Elmegreen (2006) and van Zee (2001) samples, redshift independent distances (e.g. Cepheids) from NED were used where available.
3.1 Total Magnitudes/Colors
Total magnitudes and integrated colors used the cleaned frames where the cleaned areas are re-filled with estimated intensities from the fitted ellipses. While this is not perfectly accurate for irregularly shaped galaxies, the filled regions rarely contributed more than 4% the total light of a galaxy.
Total magnitudes were determined using asymptotic fits to the aperture photometry (see Schombert 2007). Rather than using curves of growth (which are ill-defined for LSB galaxies), these fits were made to (1) the raw pixel summed values, (2) the intensities calculated from the fitted ellipses, (3) extrapolation of luminosity from exponential fits to the surface photometry. For LSB galaxies, a larger fraction of their luminosity is found in their halo regions compared to HSB galaxies. Unfortunately, these outer pixels are also the closest to sky values and suffer from the highest errors. Thus, technique (1) frequently fails to converge due to noise at low levels. Likewise, technique (3) is error prone due to the sensitivity of exponential fits to noisy outer isophotes.
We found reasonably stable total luminosity values using technique (2) extrapolating the isophotal intensities. Here the apertures are integrated to a user specified point (typically the point where % ), then the mean intensities from the fitted ellipses are used to sum the remaining luminosity. For a majority of the galaxies imaged in this study, the total magnitudes converged using this technique with typical internal errors of 0.06 mags. They are listed in Table 1, errors are assigned based on the error in the sky value (which dominates the noise in LSB images).
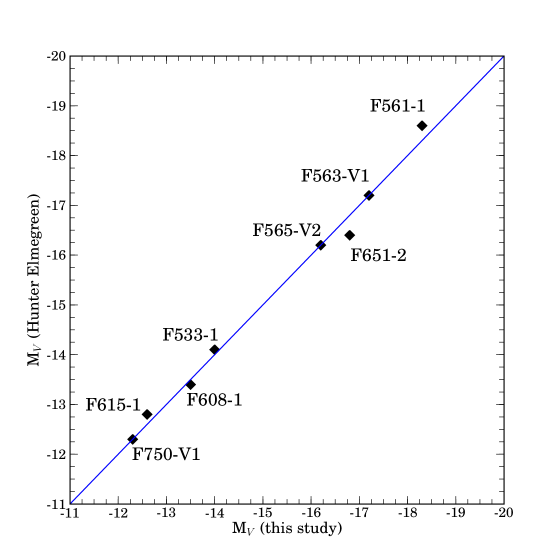
An external check to the integrated magnitudes is offered by comparison to the LSB sample from Hunter & Elmegreen (2006). There are eight objects in common with that study. Their identifications and apparent magnitudes (corrected for galactic extinction) are shown in Figure 2. The mean difference is only 0.01 mags, which is well within the formal errors of 0.06 mags.
Colors are calculated as integrated and differential colors using the fitted ellipses as apertures. A large percentage of the LSB galaxies in this sample have highly variable colors in the spatial sense. An integrated color does not capture the whole stellar population picture for many of these systems. Often a more accurate global color is one where the ellipses are used to determine differential color (the color of the annulus around each ellipse), then these annuli are averaged (weighted by the surface brightness of the annuli). It is these weighted colors (out to the 25 mag arcsecs-2 isophote) that is listed in Table 1 as and .
The full color information is obtained from pixel-by-pixel two color maps. These maps are made by registering to the frame then binning 3x3. An example of a spatial map is shown in Figure 1. It is also possible to plot spatial color versus surface brightness (i.e. pixel color versus that pixels surface brightness in ). An example of that type of analysis is shown in §3.5.
A subset of the sample had been previously imaged in (Pildis, Schombert & Eder 1997). While those colors are less accurate, their total values will be compared to the colors in §3.4 and are found listed in Table 1. Spatial color maps are made and re-pixeled to the same orientation and scale of the newer frames. This allows for a comparison of and not only in total colors and color profiles, put also on a pixel-by-pixel basis.
3.2 Scale Length () and Central Surface Brightness ()
Surface photometry was extracted from the ellipse fitting using the standard techniques outlined in Schombert (2007). Due to their typically irregular morphology, LSB galaxies are notoriously difficult to simplify into a 1D light profile. The procedure used herein is to convert the best fit ellipses into a surface brightness profile of intensity versus semi-major axis. A section of the surface brightness profile is selected in the outer regions of the galaxy with the most linear appearance. This region is then fit to a straight line, interpolating to the core to extract the central surface brightness () and exponential scale length (). Although the interiors of LSB galaxies are frequently poorly fit by an exponential profile, the exterior regions are often easily described by an exponential law. This is surprising given their irregular outer isophotes and is probably due to the fact that any high surface brightness lumps are restricted to their core regions.
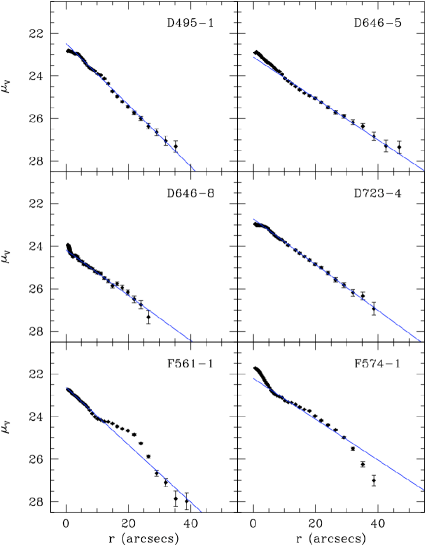
A series of example surface brightness fits are found in Figure 3. These profiles are a subset of the total sample demonstrating good and poor (e.g., F561-1) fits, as well as examples where an exponential fit may not be appropriate. The full set of surface brightness fits can be found at our data website. As can be seen from several of the surface brightness fits, the fitting technique can lead to a mismatch between the central surface brightness as described by a fit to the galaxy’s outer regions, versus a central surface brightness that actually represents the luminosity of the core regions. To fix this mismatch, the inner five arcsecs are also fit to extract a true central surface brightness (which we will designate as to distinguish it from from exponential fits) except in cases where there is a clear bulge-like central region (e.g., F574-1). No inclination corrections are applied to since the intrinsic 3D shape of LSB galaxies is unknown (some are rotators, others are not, so a thin or thick disk correction would vary from galaxy to galaxy).
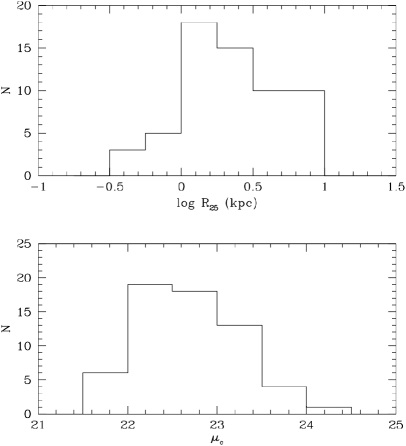
The range of size and central surface brightness is shown in Figure 4. Here size () is defined by the 25 mag arcsecs-1 isophote major axis in kpcs. Central surface brightness is the inner interpolation to zero radius (in the case of a bulge and disk, interpolation of the disk). Sizes range from 0.3 kpc to 10 kpc. LSB galaxies include both the smallest of dwarf galaxies up to medium sized disk galaxies. The central surface brightnesses are all fainter than the Freeman value (21 mag arcsecs-2), but do not include the extremely faint surface brightnesses ( 23 to 24 mags arcsecs-2) found in recent digital surveys (Zhong et al. 2008, Adami et al. 2006), primarily due to the limitations in the photographic medium used to discover the sample.
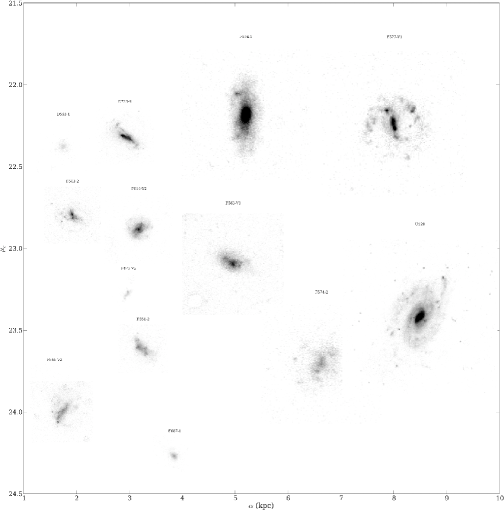
To further display the range in size and morphology, Figures 5 and 6 display a greyscale image of selected galaxies (stars removed) with respect to their central surface brightness and disk scale length. Irregular morphology is most common at small scale lengths, although it would be difficult to predict which galaxies were dwarfs simply from an estimate based on their appearance. LSB galaxies with smooth morphologies would probably be dE’s and their lack of HI gas for redshift determination would exclude them from our samples. Flocculate spiral patterns are evident at scale lengths greater than 1 kpc (note, UGC 128 is a HSB counter-example).
3.3 H Imaging
The most observationally intensive portion of this project was obtaining H images for the entire sample. The H emission for LSB galaxies is known to be below rates standard for late-type galaxies (McGaugh, Schombert & Bothun 1995). Thus, we anticipated that a majority of telescope time would be spent on ON/OFF exposures with narrow band filters. Indeed, we typically spent 60 mins total on each object in the sample and were rewarded with a 93% success rate for H detection (all but four of our original 60 targets, see Table 1).
The high detection rate was surprising since, given the low surface densities and previous H studies on this sample (McGaugh, Schombert & Bothun 1995), there was an expectation that a majority of LSB galaxies were in quiescent mode with no star formation in the last few Gyrs. H surveys of HI-rich galaxies (Meurer et al. 2006) and volume complete samples (Kennicutt et al. 2008) have high detection rates, thus our pessimism seemed unwarranted. We note that the H fluxes were extremely low (the mean is a factor of ten less than studies of gas-rich dwarfs, van Zee 2001), and the four objects with non-detections were the reddest galaxies in the sample (suggesting an elliptical-like history of an initial burst, but very little star formation after that).
Our observing technique was fairly standard. We used the KPNO H set, which cover the redshift range from zero to 10,000 km/sec with effective widths of 3,000 km/sec. Flattening used dome lamps. All the frames had noticeable curvature at the edges; however, all the sample galaxies occupied only the inner 20% of the chip. Calibration used Stone spectrophotometric standards (Stone 1996).
The distribution of H emission is typically irregular in galaxies, even for HSB spirals. The use of elliptical apertures would introduce needless sky noise, so we adopted a system of mask photometry to measure the H flux for each galaxy. For this sample, we use a boxcar smoothed H frame to define the initial mask. Peak H regions are located, then those regions are allowed to grow by 20%. All the masks are visually inspected and additional areas are added as needed (usually to capture diffuse emission areas). This technique has the advantage of minimizing sky noise and allowing us to directly compare the colors of the H pixels.
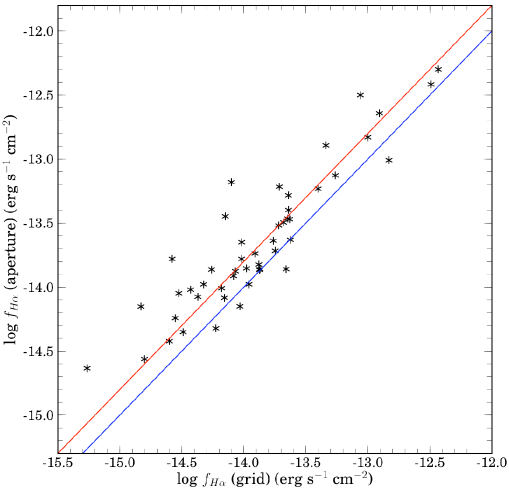
There is concern that diffuse H emission that is not visually detected would be excluded. To test for this effect we plot the aperture values versus the grid photometry values in Figure 7. The unity line is marked in blue, a linear fit with a fixed slope of one is shown in red. The difference between the aperture values and the grid values is 40%. This additional H luminosity is, presumingly, diffuse H emission that was too low in surface brightness per pixel to be detected by our growth algorithms.
We note that this 40% difference is nearly identical to the value for diffuse emission found by van Zee (2000) of 50%. Using the radii, the radius where the surface brightness profile drops to 25 mag arcsecs-2, as compared to the area of detected H emission, we find that visible H covers a range from 5 to 25% the total area of the galaxy, with a mean value for the sample of 10%. The diffuse H emits from this remaining 90% of the galaxy volume, presumably from the bluest regions. In order to capture all the H flux for star formation rate calculations, we have used our grid values (with the lowest errors) and increased them by 40% to account for the diffuse component.
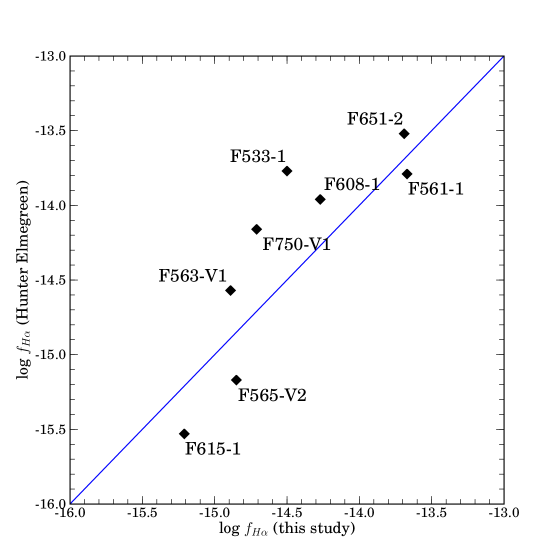
There are six galaxies in common, in terms of H fluxes, between our study and the work of Hunter & Elmegreen (2004). The Hunter & Elmegreen is plotted against our values in Figure 8. The average difference is 0.15 in log flux, the standard deviation for the eight galaxies is 0.4. There was no correlation between apparent H flux and the residuals between the two samples.
Since all our galaxies were imaged with the same number of ON/OFF exposures, we can estimate, based on the flatness H frames and integration times, that our upper limit for H detection is approximately 10-16 ergs s-1 cm-2. Since our exposure times were similar from galaxy to galaxy, and night sky conditions also were stable during the run, we consider this upper limit to be constant for this study. For the four galaxies without an H detection, this corresponds to log between 36 and 37, which would be on the faint side of our values.
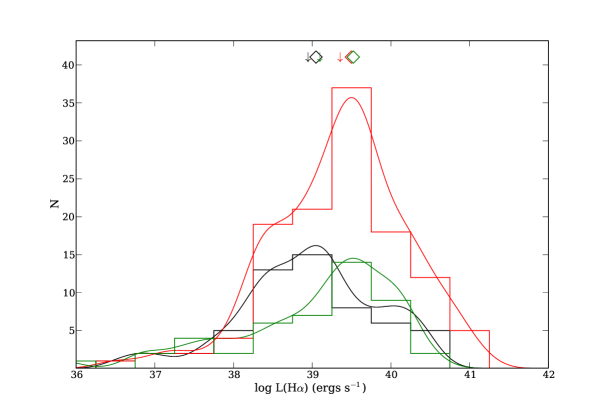
The total H fluxes and H luminosities are listed in Table 2. The H fluxes are corrected for an assumed [NII]6583+6548/H ratio of 0.1 (Hunter & Elmegreen 2004) and a factor of 40% to account for diffuse emission (see above). No corrections for dust extinction are made as LSB galaxies have very few far-IR detections and the appropriate corrections are unclear. The resulting fluxes are then converted to L(H) using the prescription given in van Zee (2001). A histogram of L(H) values is shown in Figure 9. For comparison, the bright dwarf sample of Hunter & Elmegreen (2004) and van Zee (2001) are also shown. The mean H luminosity of our sample is about a factor of 3 fainter than Hunter & Elmegreen, but similar to van Zee’s.
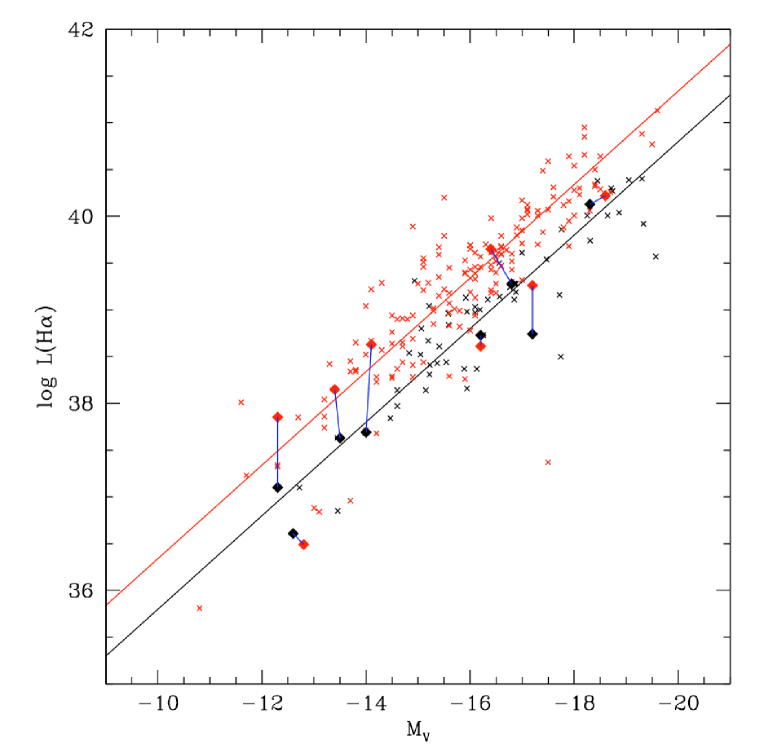
There is a strong correlation between absolute magnitude and L(H). As can be seen in Figure 10, the correlation between stellar luminosity (which measures stellar mass under an assumed IMF) and H luminosity is evident in both the van Zee and Hunter& Elmegreen samples (red symbols) and our LSB sample (black symbols). Neither H flux or apparent magnitude are correlated with distance, so we believe that distance effects are not responsible for the correlation seen in Figure 10. We note that there is a 0.5 shift in log L(H) between our samples and the dwarf irregular samples (lower H luminosities per stellar mass for the LSB galaxies). We have marked the eight galaxies in common with Hunter & Elmegreen, a bias flux calibration for our sample does not seem evident as the explanation for this shift in the zeropoint. There are numerous possibilities for this difference and we will reserve speculation until our analysis papers.
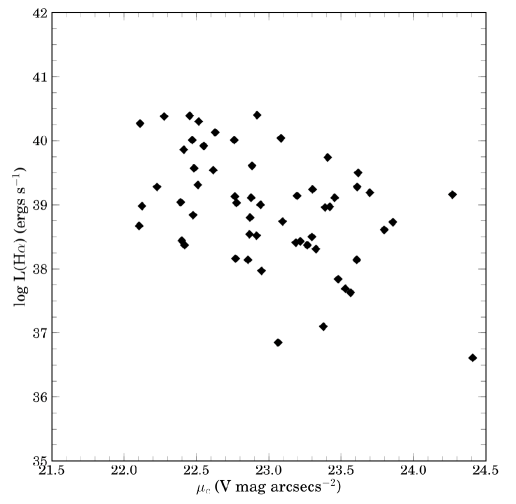
There is a weak correlation between central surface brightness () and H luminosity (see Figure 11) in the direction of weaker L(H) for fainter surface brightnesses. This is not detected in other studies (e.g., van Zee 2000); however, it is not unexpected as there are correlations between stellar density and HI surface density (de Blok, McGaugh & van der Hulst 1996). This would indicate that stellar and gas mass (roughly) follows star formation as evident by H emission, a local version of the Schmidt law (Kennicutt 1998); however, there are numerous avenues of speculation from an increased number of ionizing UV photons with higher stellar density to higher gas surface densities leading to higher star formation rates.
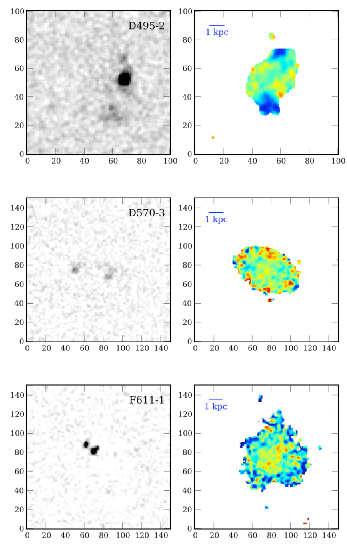
Three examples of the H spatial distribution (D495-2, D570-3, F611-1) are found in Figure 12 (all the images can be found at the data website). These three examples were selected primarily to display a common feature to LSB galaxies, the fact that H emission is frequently uncorrelated with local stellar density. While examples of stellar knots associated with H regions can be found (e.g., the brightest HII region in D495-2 corresponds with a stellar knot), typically the HII knots are not associated with any stellar enhancement (although there are frequently blue ‘bubbles’ in the color maps, see §3.5). These maps should be compared with the H image of UGC 128 (also found at the data website), to fully display the difference H morphology for normal spirals and LSB’s.
3.4 Total Colors
Total colors (and magnitudes) are extracted using elliptical apertures and asymptotic fits to the apertures as a function of radius (Schombert 2007). Mean colors, quoted in Table 1, are deduced from the color profiles where a surface brightness average is taken between one scale length () and the radius.
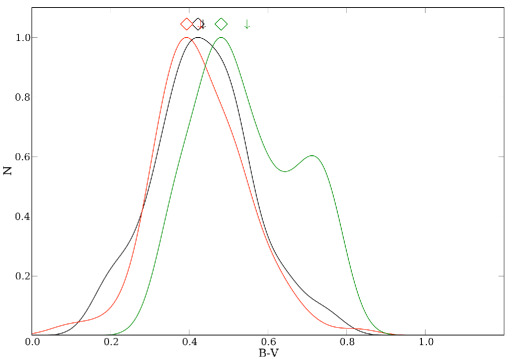
Our sample’s distribution of mean color is shown in Figure 13. Also shown is the distribution of colors from the RC3 for galaxies with morphological types later than Sc plus the combined samples from Hunter & Elmegreen (2006) and van Zee (2001) samples of star-forming dwarf irregulars. Our sample has a similar mean and range as the other dwarf galaxy samples (although we are not restricted to solely dwarf sized galaxies). All three dwarf samples are bluer than the late-type RC3 sample, probably reflecting the known reddening in these dust rich, HSB systems.
There is no correlation between surface brightness and color, this has been reported by other studies (McGaugh & de Blok 1997, van Zee 2000). There was also no correlation observed in for the same sample (Pildis, Schombert & Eder 1997). Other studies have larger ranges in central surface brightness, and it can be seen in Figure 13 that HSB RC3 galaxies are, on average, redder than LSB galaxies. Our suspicion here is that a combination of the limited range in surface brightness plus irregular morphology masks any expected global trends with respect to color.
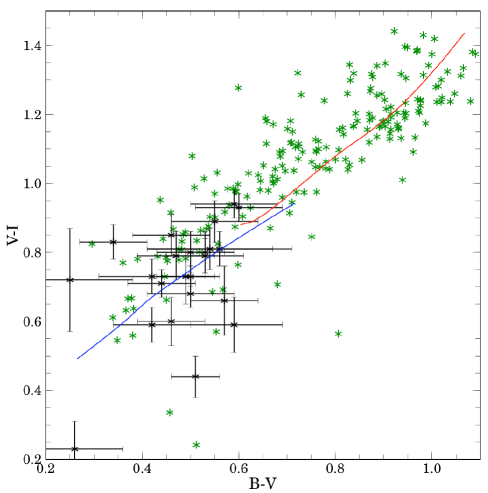
In addition to colors, 23 galaxies in our sample were also imaged in the band (Pildis, Schombert & Eder 1997). The versus color plane is shown in Figure 14 along with data from the RC3. While our LSB sample clearly occupies the bluest portion of the plane, it is also very much an extension of the color trend outlined by the RC3 galaxies and overlaps with the bluest galaxies in the RC3 sample. While there is some tendency for LSB galaxies to be bluer in compared to the RC3 trend, the mean values are equal between the RC3 and our sample.
Also shown in Figure 14 are two stellar population models tracks (instantaneous burst followed by passive evolution), one for a 13 Gyrs composite stellar population (with a standard chemical evolutionary scenario applied, see Schombert & Rakos 2009) and a 1 Gyr population ([Fe/H] varies from the red to the blue tip by +0.4 to -2.0). While this is a simplistic comparison for galaxies which clearly have some (although very little) current star formation, it does place LSB galaxies in the context of galaxy evolution.
The reddest RC3 galaxies are well explained by an old stellar population that ranges in metallicity (Schombert & Rakos 2009). Given that the mean metallicity of LSB galaxies is about [Fe/H] = -1.0 (McGaugh 1991), there is no old stellar population that fits their versus colors. This indicates that there must be a significant younger population in LSB galaxies, despite their low stellar density appearance. This, of course, is the core of the LSB dilemma, recent star formation to achieve blue optical colors without large numbers of bright OB stars to increase its luminosity density. We will explore a larger range of star formation models in a later paper.
3.5 Color Maps
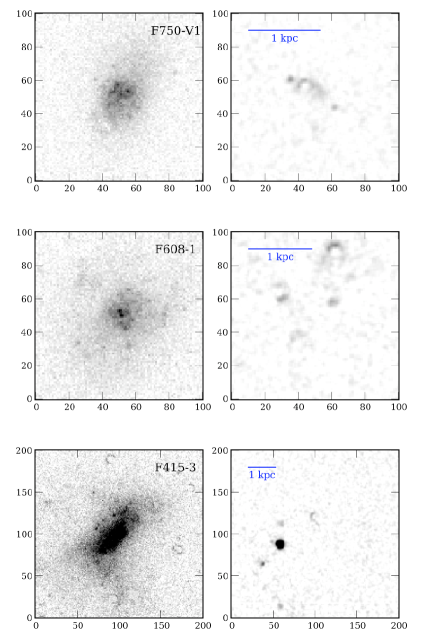
Deep and imaging allows, for the first time, a pixel-to-pixel examination of the color distribution in LSB galaxies. Three examples of this type of color map is seen in the left panel of Figure 15, their H emission is shown in right panel. There is no obvious correlation between color and H emission for these three galaxies. However, this should not be too surprising as there is little evidence for H emission in the images (the H emission is not visible in stellar luminosity density).
We also note there are several notable exceptions to the lack of color-H correlation. For example, there is a clear blue ridge in the color map of D564-9 that corresponds to a linear H feature (we note that D564-9 is one of the most active star-forming galaxies in this sample). In addition, there are blue ‘star bubble’ features associated with HII regions in galaxies D631-7, D646-5 and D646-7. Here the blue colors are spatially correlated with the diffuse emission around a HII region, rather than the core of the H emission itself. This might reflect the evolutionary development of the stellar complex or it might indicate that the stellar cores are obscured by dust (although LSB galaxies are not prolific far-IR sources, Schombert & Bothun 1988 and seem to contain very little dust O’Neil et al. 1998). These color features will be explored in a later paper.
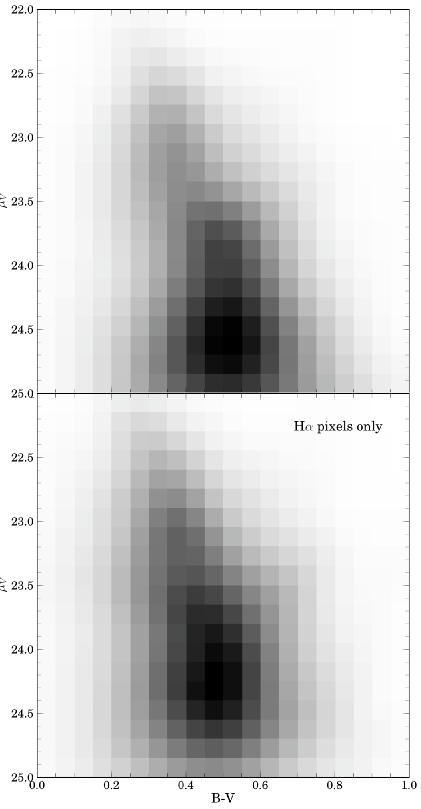
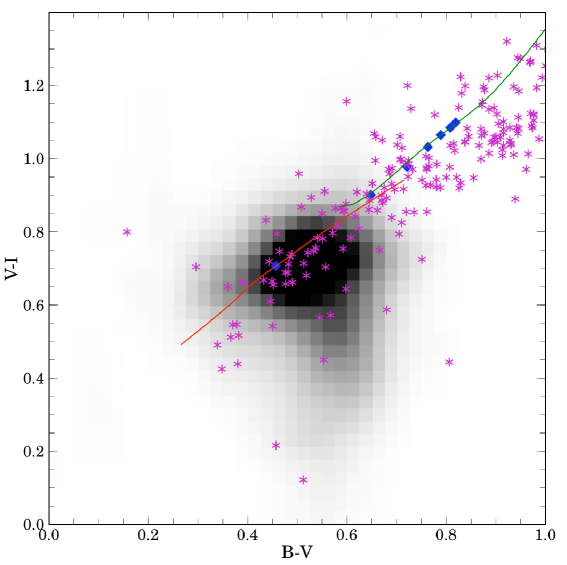
This dataset is also sufficiently high in S/N to allow us to compare the color of individual pixels with the pixel’s surface brightness. This is accomplished by assigning to each pixel a mean color and a surface brightness, based on its calibrated flux divided by pixel area. This plot, using 280,000 pixels above 25 mag arcsecs-2, is shown in top panel of Figure 16. Each color- data point is treated as a 2D gaussian with a standard deviation tied to the color and surface brightness error of the pixel. All the pixels are summed and binned to produce the density diagrams in Figure 16.
The bottom panel displays the same colors for but only for pixels with detectable H emission. Note that the brightest pixels (above 23.5 mag arcsecs-2) are the bluest pixels in either plot. H pixels can occur in regions of high and low surface brightness, with the same distribution of color as other pixels. And, while H pixels are associated with some high surface brightness areas, the reverse is not true and, therefore, it is difficult to isolate star formation regions just from band images as noted above.
The increasing spread of color with fainter surface brightness is reflecting increasing error at low S/N levels. Even with this spread there is a weak correlation between pixel color and surface brightness such that the brightest pixels are the bluest. While this is not surprising, and also true of normal spirals, it does, at least, tie star formation in LSB galaxies as a similar process to that in normal spirals (i.e. the bluest regions are associated with bright, high mass stars, not just lowest metallicities).
The same analysis can be performed on the color images for a subsample of galaxies with photometry. The two color pixel diagram is shown in Figure 17. The only clear difference between the pixel colors and the global galaxy colors in Figure 14 is a distinct tail of bluer colors at . These are fainter surface brightness pixels, but their origin is unclear as none of the simpler stellar population models occupy this portion of the plane for any combination of age and metallicity. We will discuss this problem in a later paper.
4 Summary
We present optical and H imaging for a sample of 61 LSB galaxies selected from the PSS-II LSB catalog (Schombert et al. 1992). Combined with previous HI measurements, this provides data for a comprehensive study of the gas fraction, current star formation rates, stellar population characteristics and mode of star formation. This paper presents only the core data. Analysis on the meaning of the data will be offered in the later papers of this series. A summary of the characteristics of the dataset are:
-
(1) The sample of LSB galaxies selected for our study was based on their morphology and redshift (less than 8,000 km/sec for the H filter set). No selection was made on luminosity, size or dynamical mass. The sample covers a range of galaxy characteristics that overlap with magnitude selected samples (e.g., RC3) and dwarf galaxy samples (van Zee 2000).
-
(2) Data analysis attempts to present the sample in both a visual way (see Figure 1) and using an XML data format that allows the user to follow the calibration and reduction process.
-
(3) Total magnitudes and colors are extracted using asymptotic fits and surface brightness averaged color isophotes. The resulting values are in agreement, within the errors, with galaxies in common from the Hunter & Elmegreen (2004) sample of dwarf irregulars.
-
(4) Central surface brightness and isophotal size are extracted from surface brightness profiles of each galaxy ( and RV25). Exponential fits are adequate for about 80% of the sample, providing disk scale length ( and central surface brightness ().
-
(5) H luminosities are extracted by grid photometry. Comparison to aperture values indicates that a 40% correction to account for diffuse emission is required (in agreement with van Zee 2000). Resulting L(H) values are in agreement, within the errors, with Hunter & Elmegreen. Our sample has a mean H luminosity about a factor of 10 lower than other dwarf or gas-rich galaxy studies (e.g. van Zee 2000).
-
(6) H maps confirm the sporadic nature of star formation in LSB galaxies. The HII regions are neither coherent to themselves (i.e. a density wave) or any optical features in the galaxy. The only correlation between a global property of an LSB and its star formation rate is total stellar mass and L(H).
-
(7) LSB color distributions in and are similar to dwarf irregular samples, but about 0.1 bluer in than late-type spirals. Two color diagrams place LSB galaxies at the extreme blue end of the color distribution of all galaxy types.
-
(8) Color maps display little correlation between color and H emission. However, several color features are found to associate with some HII regions (e.g. blue shells). Color gradients vary in direction and magnitude for the sample.
In general, this dataset presents an overall picture of LSB galaxies where they have some characteristics in common with dwarf galaxies and gas-rich irregulars, yet differ in significant ways that may provide the clue to their LSB nature. They cover a range of sizes and luminosities beyond the definition of dwarf galaxies, yet have SFR’s lower than galaxies of the comparable luminosity (i.e. stellar mass). In the later papers of this series, we will present an analysis of the complete dataset with the goal of outlining possible star formation histories for LSB galaxies.
References
- Adami et al. (2006) Adami, C., et al. 2006, A&A, 459, 679
- de Blok et al. (1996) de Blok, W. J. G., McGaugh, S. S., & van der Hulst, J. M. 1996, MNRAS, 283, 18
- Cawson et al. (1987) Cawson, M. G. M., Kibblewhite, E. J., Disney, M. J., & Phillipps, S. 1987, MNRAS, 224, 557
- Eder & Schombert (2000) Eder, J. A., & Schombert, J. M. 2000, ApJS, 131, 47
- Gerola et al. (1980) Gerola, H., Seiden, P. E., & Schulman, L. S. 1980, ApJ, 242, 517
- Gallagher et al. (1984) Gallagher, J. S., III, Hunter, D. A., & Tutukov, A. V. 1984, ApJ, 284, 544
- Hayward et al. (2005) Hayward, C. C., Irwin, J. A., & Bregman, J. N. 2005, ApJ, 635, 827
- Huchra et al. (1983) Huchra, J. P., Geller, M. J., Gallagher, J., Hunter, D., Hartmann, L., Fabbiano, G., & Aaronson, M. 1983, ApJ, 274, 125
- Hunter & Elmegreen (2004) Hunter, D. A., & Elmegreen, B. G. 2004, AJ, 128, 2170
- Hunter & Elmegreen (2006) Hunter, D. A., & Elmegreen, B. G. 2006, ApJS, 162, 49
- Jedrzejewski (1987) Jedrzejewski, R. I. 1987, MNRAS, 226, 747
- Kennicutt et al. (2008) Kennicutt, R. C., Jr., Lee, J. C., Funes, S. J., José G., Sakai, S., & Akiyama, S. 2008, ApJS, 178, 247
- Landolt (1992) Landolt, A. U. 1992, AJ, 104, 340
- Lee et al. (2009) Lee, J. C., et al. 2009, ApJ, 706, 599
- McGaugh (1991) McGaugh, S. S. 1991, ApJ, 380, 140
- McGaugh et al. (1995) McGaugh, S. S., Schombert, J. M., & Bothun, G. D. 1995, AJ, 109, 2019
- McGaugh & de Blok (1997) McGaugh, S. S., & de Blok, W. J. G. 1997, ApJ, 481, 689
- Milvang-Jensen & Jørgensen (1999) Milvang-Jensen, B., & Jørgensen, I. 1999, Baltic Astronomy, 8, 535
- O’Neil et al. (1998) O’Neil, K., Bothun, G. D., Impey, C. D., & McGaugh, S. 1998, AJ, 116, 657
- Pildis et al. (1997) Pildis, R. A., Schombert, J. M., & Eder, J. A. 1997, ApJ, 481, 157
- Rosenbaum & Bomans (2004) Rosenbaum, S. D., & Bomans, D. J. 2004, Baryons in Dark Matter Halos,
- Schombert et al. (1992) Schombert, J. M., Bothun, G. D., Schneider, S. E., & McGaugh, S. S. 1992, AJ, 103, 1107
- Schombert et al. (1997) Schombert, J. M., Pildis, R. A., & Eder, J. A. 1997, ApJS, 111, 233
- Schombert & Bothun (1988) Schombert, J. M., & Bothun, G. D. 1988, AJ, 95, 1389
- Schombert et al. (2001) Schombert, J. M., McGaugh, S. S., & Eder, J. A. 2001, AJ, 121, 2420
- Schombert (2007) Schombert, J. 2007, arXiv:astro-ph/0703646
- Schombert & Rakos (2009) Schombert, J., & Rakos, K. 2009, ApJ, 699, 1530
- Stone (1996) Stone, R. P. S. 1996, ApJS, 107, 423
- Zhong et al. (2008) Zhong, G. H., Liang, Y. C., Liu, F. S., Hammer, F., Hu, J. Y., Chen, X. Y., Deng, L. C., & Zhang, B. 2008, MNRAS, 391, 986
- van Zee (2000) van Zee, L. 2000, AJ, 119, 2757
- van Zee (2001) van Zee, L. 2001, AJ, 121, 2003
- Whitmore et al. (2005) Whitmore, B. C., et al. 2005, AJ, 130, 2104
- Young et al. (1996) Young, J. S., Allen, L., Kenney, J. D. P., Lesser, A., & Rownd, B. 1996, AJ, 112, 1903
| Object | run | D | ||||||
|---|---|---|---|---|---|---|---|---|
| (Mpc) | (V mag arcsec-2) | (kpc) | ||||||
| D495-1 | K0308 | 34.9 | -15.940.02 | 22.29 | 0.8 | 0.50 | 0.72 | 0.56 |
| D495-2 | K0308 | 33.4 | -15.920.03 | 21.90 | 0.6 | 0.42 | 0.58 | 0.58 |
| D500-3 | K0308 | 22.7 | -15.590.04 | 21.04 | 0.4 | 0.48 | 0.28 | 0.69 |
| D563-1 | K0309 | 61.6 | -16.850.06 | 22.68 | 1.1 | 0.44 | 0.69 | 0.81 |
| D564-9 | K0308 | 46.0 | -18.450.04 | 22.18 | 2.1 | 0.40 | 0.59 | 0.65 |
| D564-16 | K0308 | 100.0 | -17.740.09 | 23.00 | 2.4 | 0.39 | – | 0.50 |
| D565-10 | K0309 | 11.8 | -14.330.03 | 22.63 | 0.3 | 0.73 | 0.77 | 0.91 |
| D568-2 | K0309 | 21.3 | -14.600.02 | 21.67 | 0.3 | 0.42 | 0.66 | 0.50 |
| D570-3 | K0308 | 23.7 | -15.230.02 | 22.61 | 0.5 | 0.56 | 0.53 | 0.73 |
| D570-7 | K0308 | 15.6 | -14.470.07 | 22.99 | 0.5 | 0.44 | – | 0.48 |
| D572-2 | K0308 | 56.5 | -16.340.17 | 22.16 | 1.4 | 0.20 | 0.48 | 0.24 |
| D572-5 | K0309 | 18.0 | -15.200.02 | 21.51 | 0.3 | 0.40 | 0.48 | 0.69 |
| D575-2 | K0308 | 14.7 | -16.100.05 | 23.37 | 1.4 | 0.52 | 0.80 | 0.52 |
| D575-7 | K0309 | 18.1 | -15.060.02 | 21.73 | 0.4 | 0.40 | 0.61 | 0.59 |
| D631-7 | K0308 | 7.8 | -15.210.03 | 21.27 | 0.4 | 0.38 | – | 0.45 |
| D637-3 | K0308 | 35.2 | -15.580.15 | 23.27 | 1.0 | 0.34 | – | 0.61 |
| D646-5 | K0308 | 18.3 | -14.830.05 | 23.01 | 0.6 | 0.37 | 1.81 | 0.56 |
| D646-7 | K0308 | 7.2 | -14.930.03 | 22.43 | 0.4 | 0.39 | 0.73 | 0.66 |
| D646-8 | K0308 | 33.3 | -14.710.40 | 24.07 | 1.0 | 0.49 | – | 0.67 |
| D646-9 | K0308 | 29.4 | -15.150.14 | 23.57 | 0.9 | 0.32 | – | 0.59 |
| D646-11 | K0309 | 12.1 | -15.050.03 | 22.50 | 0.5 | 0.52 | 0.44 | 0.74 |
| D656-2 | K0309 | 15.9 | -15.370.12 | 23.09 | 0.7 | 0.33 | 0.55 | 0.77 |
| D723-4 | K0309 | 32.9 | -16.190.10 | 22.64 | 1.0 | 0.41 | 0.64 | 0.51 |
| D723-5 | K0309 | 27.7 | -16.880.02 | 21.97 | 0.9 | 0.53 | 0.72 | 0.54 |
| D723-9 | K0308 | 26.2 | -17.470.03 | 22.88 | 2.2 | 0.63 | 0.69 | 0.37 |
| D774-1 | K0309 | 72.0 | -19.570.01 | 22.29 | 2.2 | 0.52 | 0.61 | 0.74 |
| DDO154 | K0309 | 8.9 | -16.100.04 | 21.73 | 0.6 | 0.31 | – | 0.45 |
| DDO168 | K0309 | 5.2 | -15.940.12 | 21.06 | 0.5 | 0.35 | – | 0.36 |
| F415-3 | K1007 | 10.4 | -15.220.01 | 22.84 | 0.7 | 0.52 | – | 0.31 |
| F473-V2 | K1007 | 44.7 | -16.130.15 | 23.12 | 1.5 | 0.44 | – | 0.34 |
| F512-1 | K0309 | 14.1 | -15.540.07 | 22.40 | 0.6 | 0.19 | 0.79 | 0.55 |
| F533-1 | K1007 | 12.8 | -13.980.08 | 23.24 | 0.4 | 0.29 | – | 0.76 |
| F544-1 | K1007 | 28.5 | -15.890.08 | 22.52 | 0.9 | 0.26 | – | 0.60 |
| F561-1 | K0308 | 69.8 | -18.300.02 | 22.47 | 1.6 | 0.64 | – | 1.00 |
| F562-V1 | K0308 | 68.1 | -18.250.06 | 21.85 | 1.8 | 0.47 | 0.68 | 0.19 |
| F563-1 | K0308 | 52.2 | -17.760.05 | 22.36 | 1.5 | 0.37 | 0.82 | 0.65 |
| F563-V1 | K0308 | 57.6 | -17.200.06 | 23.08 | 2.0 | 0.20 | 0.79 | 0.47 |
| F564-V3 | K0309 | 10.4 | -14.050.04 | 23.43 | 0.4 | 0.64 | 0.88 | 0.81 |
| F565-V1 | K0308 | 10.8 | -13.460.08 | 22.84 | 0.3 | 0.21 | – | 0.70 |
| F565-V2 | K0309 | 55.1 | -16.250.32 | 23.42 | 1.6 | 0.41 | – | 0.50 |
| F568-1 | K0308 | 95.5 | -18.860.08 | 22.93 | 3.1 | 0.50 | – | 0.67 |
| F568-V1 | K0309 | 84.8 | -18.640.03 | 22.56 | 2.3 | 0.44 | – | 0.68 |
| F574-1 | K0309 | 100.0 | -19.050.11 | 22.12 | 3.2 | 0.48 | – | 0.36 |
| F574-2 | K0309 | 92.3 | -18.310.16 | 23.49 | 4.7 | 0.54 | – | 0.38 |
| F575-3 | K0308 | 9.8 | -14.310.09 | 23.80 | 0.8 | 0.26 | – | 0.30 |
| F577-V1 | K0309 | 113.0 | -18.740.06 | 21.98 | 2.0 | 0.48 | – | 0.20 |
| F579-V1 | K0309 | 90.5 | -19.330.02 | 21.94 | 2.1 | 0.64 | – | 0.95 |
| F583-2 | K0309 | 25.4 | -16.570.11 | 23.10 | 1.4 | 0.50 | – | 0.55 |
| F608-1 | K1007 | 9.0 | -13.450.05 | 23.74 | 0.4 | 0.50 | – | 0.86 |
| F608-V1 | K1007 | 20.3 | -14.600.12 | 22.47 | 0.4 | 0.38 | – | 0.72 |
| F611-1 | K1007 | 25.5 | -15.410.03 | 22.97 | 0.7 | 0.48 | – | 0.75 |
| F612-V3 | K1007 | 65.4 | -16.560.09 | 22.80 | 1.3 | 0.41 | – | 0.34 |
| F614-V2 | K1007 | 51.3 | -17.000.05 | 21.98 | 1.2 | 0.40 | – | 0.60 |
| F615-1 | K1007 | 8.2 | -12.600.06 | 23.14 | 0.3 | 0.34 | – | 0.45 |
| F651-2 | K0308 | 27.5 | -16.850.07 | 23.10 | 1.8 | 0.55 | – | 0.47 |
| F677-V2 | K1007 | 63.9 | -16.760.04 | 22.84 | 1.2 | 0.75 | – | 0.88 |
| F687-1 | K1007 | 47.5 | -17.720.04 | 23.98 | 3.9 | 0.48 | – | 0.64 |
| F750-2 | K1007 | 46.1 | -16.880.07 | 22.30 | 1.4 | 0.40 | – | 0.28 |
| F750-V1 | K1007 | 8.0 | -12.720.04 | 22.68 | 0.2 | 0.32 | – | 0.74 |
| U128 | K1007 | 58.5 | -19.300.03 | 22.60 | 3.6 | 0.57 | – | 0.53 |
| U5005 | K0309 | 57.1 | -18.710.01 | 22.36 | 2.2 | 0.32 | – | 0.38 |
| Object | log | log | log | log | log | b | |
|---|---|---|---|---|---|---|---|
| (ergs s-1 cm-2) | (ergs s-1) | () | () | () | |||
| D495-1 | -15.030.08 | 38.16 | 7.93 | 8.23 | 8.40 | 0.66 | -0.87 |
| D495-2 | -14.020.04 | 39.13 | 7.81 | 8.42 | 8.52 | 0.80 | 0.21 |
| D500-3 | -13.960.10 | 38.84 | 7.76 | 8.28 | 8.40 | 0.77 | -0.02 |
| D563-1 | -14.570.09 | 39.11 | 8.21 | 8.85 | 8.94 | 0.81 | -0.20 |
| D564-9 | -13.050.02 | 40.38 | 8.80 | 9.59 | 9.66 | 0.86 | 0.47 |
| D564-16 | -15.591.50 | 38.50 | 8.51 | 8.93 | 9.07 | 0.72 | -1.11 |
| D565-10 | none | none | 7.58 | 7.56 | 7.87 | 0.49 | 0.00 |
| D568-2 | -14.600.03 | 38.14 | 7.29 | 7.98 | 8.06 | 0.83 | -0.25 |
| D570-3 | -14.420.12 | 38.41 | 7.72 | 7.96 | 8.16 | 0.64 | -0.41 |
| D570-7 | -14.620.04 | 37.84 | 7.26 | 7.97 | 8.04 | 0.84 | -0.52 |
| D572-2 | -14.480.05 | 39.11 | 7.71 | 8.91 | 8.94 | 0.94 | 0.30 |
| D572-5 | -13.920.02 | 38.67 | 7.51 | 8.40 | 8.46 | 0.89 | 0.06 |
| D575-2 | -13.450.09 | 38.97 | 8.02 | 8.81 | 8.87 | 0.86 | -0.16 |
| D575-7 | -13.790.05 | 38.80 | 7.45 | 8.46 | 8.50 | 0.91 | 0.25 |
| D631-7 | -12.880.07 | 39.04 | 7.49 | 8.52 | 8.55 | 0.91 | 0.45 |
| D637-3 | -14.230.10 | 38.96 | 7.59 | 8.83 | 8.85 | 0.95 | 0.27 |
| D646-5 | -14.060.16 | 38.54 | 7.32 | 8.47 | 8.50 | 0.93 | 0.12 |
| D646-7 | -12.480.01 | 39.31 | 7.39 | 8.10 | 8.18 | 0.84 | 0.82 |
| D646-8 | none | none | 7.42 | 7.67 | 7.87 | 0.64 | 0.00 |
| D646-9 | -14.880.05 | 38.14 | 7.39 | 8.65 | 8.67 | 0.95 | -0.35 |
| D646-11 | -13.730.06 | 38.52 | 7.60 | 8.02 | 8.16 | 0.72 | -0.18 |
| D656-2 | -14.060.11 | 38.43 | 7.49 | 8.57 | 8.60 | 0.92 | -0.15 |
| D723-4 | -14.110.07 | 39.00 | 7.91 | 9.13 | 9.15 | 0.94 | -0.01 |
| D723-5 | -13.690.03 | 39.28 | 8.34 | 8.46 | 8.70 | 0.56 | -0.17 |
| D723-9 | -13.380.02 | 39.54 | 8.71 | 9.02 | 9.19 | 0.67 | -0.27 |
| D774-1 | -14.310.08 | 39.57 | 9.40 | 9.70 | 9.88 | 0.66 | -0.93 |
| DDO154 | -12.950.02 | 39.03 | 7.75 | 9.31 | 9.32 | 0.97 | 0.18 |
| DDO168 | -12.540.02 | 38.98 | 7.75 | 8.81 | 8.85 | 0.92 | 0.13 |
| F415-3 | -13.710.09 | 38.31 | 7.67 | 8.68 | 8.72 | 0.91 | -0.46 |
| F473-V2 | -14.920.78 | 38.37 | 7.93 | 8.98 | 9.02 | 0.92 | -0.65 |
| F512-1 | -13.940.03 | 38.44 | 7.37 | 8.23 | 8.28 | 0.88 | -0.04 |
| F533-1 | -14.500.04 | 37.69 | 6.87 | 8.14 | 8.16 | 0.95 | -0.29 |
| F544-1 | -14.540.02 | 38.37 | 7.60 | 9.11 | 9.12 | 0.97 | -0.33 |
| F561-1 | -13.670.06 | 40.13 | 9.06 | 9.29 | 9.49 | 0.63 | -0.03 |
| F562-V1 | -13.760.03 | 40.01 | 8.82 | 9.53 | 9.61 | 0.84 | 0.09 |
| F563-1 | -13.680.04 | 39.86 | 8.49 | 9.69 | 9.72 | 0.94 | 0.27 |
| F563-V1 | -14.890.12 | 38.74 | 8.05 | 8.97 | 9.02 | 0.89 | -0.42 |
| F564-V3 | none | none | 7.36 | 7.77 | 7.91 | 0.72 | 0.00 |
| F565-V1 | -15.310.30 | 36.85 | 6.57 | 7.03 | 7.16 | 0.74 | -0.82 |
| F565-V2 | -14.850.13 | 38.73 | 7.94 | 9.02 | 9.05 | 0.92 | -0.32 |
| F568-1 | -14.000.10 | 40.04 | 9.10 | 9.75 | 9.84 | 0.82 | -0.16 |
| F568-V1 | -13.930.02 | 40.01 | 8.94 | 9.74 | 9.80 | 0.86 | -0.02 |
| F574-1 | -13.690.02 | 40.39 | 9.16 | 9.76 | 9.86 | 0.80 | 0.14 |
| F574-2 | -14.270.06 | 39.74 | 8.93 | 9.32 | 9.47 | 0.71 | -0.30 |
| F575-3 | none | none | 6.97 | 8.07 | 8.11 | 0.93 | 0.00 |
| F577-V1 | -13.920.05 | 40.27 | 9.02 | 9.81 | 9.87 | 0.86 | 0.14 |
| F579-V1 | -14.080.06 | 39.92 | 9.47 | 9.52 | 9.79 | 0.53 | -0.65 |
| F583-2 | -13.760.04 | 39.14 | 8.18 | 9.02 | 9.08 | 0.88 | -0.14 |
| F608-1 | -14.270.06 | 37.63 | 6.93 | 7.76 | 7.82 | 0.87 | -0.40 |
| F608-V1 | -14.650.06 | 37.97 | 7.24 | 8.59 | 8.61 | 0.96 | -0.37 |
| F611-1 | -14.200.01 | 38.61 | 7.69 | 8.55 | 8.60 | 0.88 | -0.18 |
| F612-V3 | -14.130.02 | 39.50 | 8.07 | 9.09 | 9.13 | 0.91 | 0.34 |
| F614-V2 | -13.810.04 | 39.61 | 8.23 | 9.09 | 9.14 | 0.88 | 0.28 |
| F615-1 | -15.210.08 | 36.61 | 6.39 | 7.58 | 7.61 | 0.94 | -0.89 |
| F651-2 | -13.690.07 | 39.28 | 8.36 | 9.03 | 9.12 | 0.83 | -0.18 |
| F677-V2 | -14.370.03 | 39.24 | 8.58 | 8.88 | 9.05 | 0.67 | -0.44 |
| F687-1 | -14.200.04 | 39.16 | 8.62 | 9.35 | 9.42 | 0.84 | -0.56 |
| F750-2 | -14.150.07 | 39.19 | 8.18 | 9.31 | 9.34 | 0.93 | -0.10 |
| F750-V1 | -14.710.07 | 37.10 | 6.40 | 7.17 | 7.24 | 0.85 | -0.41 |
| U128 | -13.110.02 | 40.40 | 9.36 | 10.16 | 10.22 | 0.86 | -0.06 |
| U5005 | -13.310.06 | 40.30 | 8.80 | 9.87 | 9.91 | 0.92 | 0.39 |