Data on for masses
1960 to 2410 MeV/c2
A.V. Anisovichc, C.A. Bakerb, C.J. Battyb, D.V. Bugga, C. Hodda, V.A. Nikonovc, A.V. Sarantsevc, V.V. Sarantsevc, B.S. Zoua 111Now at IHEP, Beijing 100039, China
a Queen Mary and Westfield College, London E1 4NS, UK
b Rutherford Appleton Laboratory, Chilton, Didcot OX11 0QX,UK
c PNPI, Gatchina, St. Petersburg district, 188350, Russia
Abstract
Data on are presented at nine momenta from 600 to 1940 MeV/c. Strong S-wave production of is observed, requiring a resonance with mass MeV, MeV.
The first data are presented on in flight. These data were taken with the Crystal Barrel detector at LEAR. They are part of an extensive study of the , system in several channels. Data have been reported earlier on [1], and [2], and [3]. A comparison will be made here specifically with the data, and with a combined amplitude analysis of all the earlier data [4].
The experimental set-up has been reported in detail [5]. A beam from LEAR interacts in a liquid hydrogen target 4.4 cm long at the centre of the detector. Incident are counted by a coincidence between a scintillator of 5 mm diameter and a small multiwire proportional chamber, both positioned cm upstream of the target. Two veto counters 20 cm downstream of the target provide a trigger for interactions. The target is surrounded over 98% of the solid angle by a multiwire proportional chamber and a silicon vertex detector. These provide an on-line trigger for neutral final states. With a beam of /s, the trigger rate is /s.
The present channel is studied in events, where , . Photons are detected with high efficiency down to 20 MeV in a barrel of 1380 CsI crystals covering 98% of the solid angle; the geometry is such that crystals point towards the target. The crystals have a length of 16 radiation lengths and provide an angular resolution of mrad in azimuth and polar angle. The energy resolution is given by (GeV)1/4.
The general procedures for event reconstruction and selection have been described in several earlier publications, of which the most detailed concern the study of , and final states [1,2]. A Monte Carlo simulation of the detector is used to assess the efficiency for reconstruction of the final state and the levels of background from competing channels.

Events are first submitted to a kinematic fit to , requiring a confidence level . The best kinematic fit to is then selected, again with confidence level . At this step, the main background to comes from events. This background is suppressed strongly by rejecting any event passing a kinematic fit to with confidence level (or 0.1% at 600 MeV/c, where the background is more severe). Finally, those few events are rejected which fit with confidence level better than .
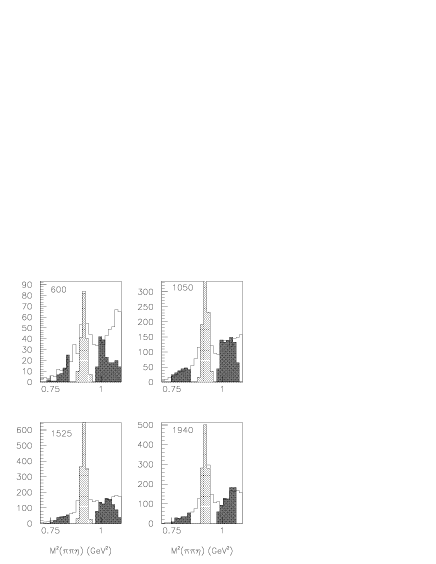
Fig. 1 illustrates at four beam momenta the mass distribution of surviving events in the mass range around the . There is a clear signal, agreeing in mass within MeV with the standard value at all momenta. It is superposed on a smooth background, whose magnitude is largest at low beam momenta. The Monte Carlo simulation estimates that the background comes approximately equally from 3 sources: (i) events, (ii) , after losing one photon, and (iii) without an . The predicted background agrees with that observed (within 10% of the prediction). Tighter cuts do not improve the signal/background ratio significantly, but simply cause loss of events.
Signal events are selected from the peak region of the by adjusting a mass cut around the peak at every individual momentum so as to optimise the signal/background ratio. Very rarely, two events fall within the window; in this case the one closer to the is accepted. Statistics of the data selection are shown in Table 1. In the maximum likelihood fit used for amplitude analysis, sidebins events shown shaded in Fig. 1 are used to subtract the background. The areas of sidebins are chosen so that each covers twice the range of mass squared which is used to select events; in this way, statistical errors on the background are small. A technicality is that the width of the mass cut is varied according to the accuracy with which the mass is reconstructed. This is the reason that sidebands have diffuse edges: the width of the sidebin likewise varies with the width of the mass cut. Technically, the way the subtraction is made is to include sidebin events into the fit with a weight times that of events selected in the signal region. Amplitudes are constructed with tensor expressions using the measured mass of each .


Fig. 2 shows the Dalitz plots at all momenta for events from the signal region. There is an obvious contribution due to , appearing at momenta MeV/c at the lower left edge of the plot. Fig. 3 shows the Dalitz plots for sidebin events. The distribution of background is not uniform, but peaks in the corners of the Dalitz plots. This peaking accounts for corresponding peaks observed in the corners of the Dalitz plots of Fig. 2. When the subtraction is made, the surviving signal outside the peak is nearly uniform within the available statistics. At 1940 MeV/c, there is also some weak in the background; we have checked that this is not due to signal spilling into the mass ranges used for the sidebins.
| Momentum | Data | BG | Signal | |
|---|---|---|---|---|
| (MeV/c) | (%) | |||
| 600 | 180 | 61 | 119 | 2.90 |
| 900 | 1017 | 399 | 618 | 4.61 |
| 1050 | 831 | 257 | 574 | 5.76 |
| 1200 | 2770 | 852 | 1918 | 6.33 |
| 1350 | 2296 | 595 | 1701 | 5.92 |
| 1525 | 1416 | 381 | 1035 | 5.06 |
| 1642 | 1530 | 330 | 1200 | 4.72 |
| 1800 | 1503 | 325 | 1178 | 4.57 |
| 1940 | 1063 | 240 | 823 | 4.34 |
There is no indication for the presence of . The expected contribution may be predicted from fits which have been made to in data [3]. The predicted contribution is only of , because of the small (0.53%) branching fraction of to . This contribution is included in the amplitude analysis using amplitudes fitted to the data, but is so small as to have negligible effect on conclusions. Fig. 4 shows projections at two beam momenta on to masses of and ; the latter is featureless. The histograms show results of the maximum likelihood fit described below.


We now turn to physics results. Data points on Fig. 5(a) show the integrated cross section after background subtraction and after scaling to allow for all other unobserved decay modes of , and . There is a peak around 2230 MeV, which is the nominal threshold for . The absolute normalisation is obtained using beam counts, target length and density, and correcting the observed number of signal events for the reconstruction efficiency shown in Table 1. A correction is applied for observed dependence of the cross section on beam rate, as described in detail in Ref. [1].


The amplitude analysis is made using (a) S and P-waves for , where stands for the S-wave amplitude, for which we use the parametrisation of Zou and Bugg [6], (b) S and P-waves for , and (c) a small, almost negligible contribution from , which helps marginally in fitting the mass distribution at the lowest three beam momenta. It is to be expected that higher partial waves for will be suppressed strongly by the centrifugal barrier in the final states. Contributions from D-waves have been tried in the fit, but are not required; indeed, the P-wave contribution is quite small. Likewise, contributions with are negligible.
We shall present amplitudes for in partial waves , and , and ; they will be compared with observed in data [3,4]. These two channels are related by the composition of the and in terms of strange and non-strange quarks:
| (1) | |||||
| (2) |
The coefficients 0.8 and 0.6 are derived from the well known pseudo-scalar mixing angle [7]. Our earlier analysis of , and [8] finds that almost all -channel resonances produced in interactions are consistent with small mixing angles between and . The naive prediction is therefore that amplitudes for and will be related by
| (3) |
The peak in the full curve of Fig. 5(a) requires a resonance in close to the mass of the peak. However, the mass spectrum from a simple resonance will be pushed upwards by the rapidly increasing phase space for the final state . This effect is visible in the dotted curve of Fig. 5(c), which shows the resonance contribution to fitted to ; this curve peaks above 2300 MeV because of the increasing phase space. In order to reproduce the integrated cross section of Fig. 5(a), the amplitude analysis requires a strong interfering background peaking below threshold. The interference is constructive at low masses, and is required to give a large cross section there, despite the limited phase space. Above the peak at 2230 MeV, the interference becomes destructive, and cuts off the cross section on the upper side of the resonance.
The motivation for including this background contribution at low masses arises from the new combined analysis [4] of data, together with those on , and . Results for from that analysis are shown in Fig. 5(b). That analysis requires a resonance at MeV. It appears there most clearly in with in the final state, shown by the chain curve in Fig.5(b). However, for the dominant channel, what one observes is a strong peak near 2 GeV, shown by the full curve. This comes mostly from , but partly from reported in an analysis of data on [9]. The intensities of contributions to the channel are shown in Fig. 5(b) from (i) all contributions (dotted curve) and (ii) the coherent sum of and (dashed curve); the latter two resonances are not well resolved by the data, because they lie close together near the threshold. The contribution from interferes destructively with and , so as to cut off the full curve at high masses.
In present data, the width of the is well determined by the width of the peak in Fig. 5(a): MeV. This determination is superior to that in data: MeV. The mass is somewhat less well determined, since the interference with the tails of the lower resonances may shift the peak by an amount which is sensitive to their widths. Using the best estimates for the widths from Ref. [8], the mass from the present data is MeV, in reasonable agreement with the value derived from data: MeV. The Argand diagram for the S-wave amplitude is shown in Fig. 5(d).
A striking feature of the signal is its large magnitude. The dashed curve on Fig. 5(a) shows the complete integrated cross section, multiplied by to allow for the expected inhibition of with respect to . It is surprising that the signal is nearly as strong as the dashed curve, bearing in mind the difference in available phase space for and . The peak in the cross section (full curve) is much larger than the small peak observed at the same mass in the cross section. Likewise, the S-wave peak due to , shown by the dotted curve in Fig. 5(c), is considerably stronger than that in in Fig. 5(b). If one takes into account the available phase space for and , the coupling constant for relative to that in is stronger than predicted by equn. (3) by a factor in amplitude.
Vandermeulen has remarked that annihilation usually favours high mass final states [10]. This may be understood as a form factor effect, arising from the sizes of the participating states. In present data, the final state has very low momentum. However, in the process , the momentum in the final state is MeV/c. The factor 5.2 would require a form factor in amplitude, with in GeV/c; if this arises from a source having a Gaussian distribution in , the form factor takes the well known form , and requires a radius of interaction fm. Such a form factor is surprisingly strong. For comparison, the Vandermeulen form factor approximates to .
A possibility is that is an state. However, strong production from is unlikely and in disagreement with results for , and [4].
The strong sub-threshold contribution to the S-wave is intriguing. A variety of explanations are possible, of which we mention one. In Ref. [9], evidence has been presented for three resonances in a mass range where only two are likely to be . Of these, is a candidate for a hybrid, because of its strong decay to , despite limited phase space. If that conjecture is correct, it should be accompanied by an partner at about 2100 MeV. Such an hybrid is expected to decay strongly to and . If it mixes into neighbouring states, it could help to explain the anomalously strong signal observed here.


We now consider other partial waves. The present data require a small but significant P-wave contribution. This could arise from initial states , , or . The amplitude analysis of Ref. [4] requires all of these contributions in data with a resonance at 2303 MeV, a resonance at MeV and resonances at 2240 and 2293 MeV. A good fit to present data may be obtained by fixing the relative magnitudes and phases of these partial waves from the fit to data. The absolute magnitude of the P-wave contribution is sensitive to the radius chosen for the Blatt-Weisskopf centrifugal barrier. This radius is therefore adjusted to give the best fit to the data, with the reasonable result fm.
The magnitudes of the contributions are then 3.5% for , for , for the resonance at 2240 MeV and 1.0% for the resonance at 2293 MeV; in the latter two, the ratios of amplitudes for and are taken from Ref. [4]. Without these amplitudes, log likelihood of the fit to is worse by 142 for only one parameter fitted to the overall magnitude; so the P-wave contribution is highly significant. [Our definition of log likelihood is such that it a change of 0.5 corresponds to one standard deviation change in one variable]. If instead the magnitudes and phases of these amplitudes are fitted freely, the fit changes very little. It is not possible from the present data to separate and , which need to be constrained in relative magnitude as determined in Ref. [4]. With this constraint, the freely fitted intensities are for , for and for , close to the contrained fit.
Figs. 6(a) and (b) show angular distributions for production of in the mass range GeV in terms of the centre of mass angle of the The distributions are uncorrected for acceptance, which is included in the maximum likelihood fit shown by the histograms. At high beam momenta, the acceptance for falls in the forward direction, where the separation of its decay products becomes less efficient. A check on the reconstruction procedure is that angular distributions are symmetric forward-backward in the centre of mass system within errors, after correction for acceptance; this symmetry is required by charge conjugation invariance.
We now turn to the contributions from the broad channel. From present data, the only firm conclusion which may be drawn is that contributions from both and initial states are required. At all momenta from 900 MeV/c upwards, the data require angular distributions of the form , as shown in Figs. 6(c) and (d). The data have been fitted including and resonances. Present data are fitted well by the same resonances. However, statistics are not sufficient to provide clear evidence of these resonances in present data. Fig. 6 shows that the fit to data is adequate.
In summary, the main feature of the data is a peak at 2230 MeV, requring a dominant contribution from the S-wave. The data require a resonance with mass MeV and width MeV; this result is closely consistent with an resonance observed in data. The S-wave amplitude is surprisingly strong compared with that for , even allowing for a form factor in the latter. Contributions from P-states are consistent with the amplitude analysis of the data.
1 Acknowledgement
We thank the Crystal Barrel Collaboration for allowing use of the data. We wish to thank the technical staff of the LEAR machine group and of all participating institutes for their invaluable contributions to the successful running of the experiment. We acknowledge financial support from the British Particle Physics and Astronomy Research Council (PPARC). The St. Petersburg group wishes to acknowledge financial support from PPARC and INTAS grant RFBR 95-0267.
References
- [1] A.V. Anisovich et al., Phys. Lett. B468 (1999) 304.
- [2] A.V. Anisovich et al., Phys. Lett. B468 (1999) 309.
- [3] A.V. Anisovich et al., Phys. Lett. B452 (1999) 180; Nucl. Phys. A651 (1999) 253.
- [4] A.V. Anisovich et al., , mesons from 1920 to 2410 MeV, submitted to Phys. Lett. B.
- [5] E. Aker et al., Nucl. Instr. A321 (1992) 69.
- [6] B.S. Zou and D.V. Bugg, Phys. Rev. D50 (1994) R3948.
- [7] C. Amsler et al., Phys. Lett. B294 (1992) 451.
- [8] A.V. Anisovich et al., Phys. Lett. B471 (1999) 271.
- [9] A.V. Anisovich et al., Phys. Lett. B477 (2000) 19.
- [10] J. Vandermeulen, Z. Phys. C37 (1988) 563.