Measurements of
Inclusive b–quark Production at 7 TeV
with the CMS Experiment
P. Bellan
on behalf of
the CMS Collaboration
Padova University and INFN – 35131 Padova, Italy
Abstract
Measurements performed by the CMS experiment of the cross section for inclusive b-quark production in proton-proton collisions at TeV are presented. The measurements are based on different methods, such as inclusive jet measurements with secondary vertex tagging or selecting a sample of events containing jets and at least one muon, where the transverse momentum of the muon with respect to the closest jet axis discriminates b events from the background. The results are compared with predictions based on perturbative QCD calculations at leading and next-to-leading order.
PRESENTED AT
Hadron 2011
Munich, Deutschland
June 13–17, 2011
1 Introduction
The study of heavy-quark production in high-energy hadronic interactions plays a key role in testing next-to-leading order (NLO) Quantum Chromodynamics (QCD) calculations. In the past, discrepancies were observed between experimental data and theoretical predictions, e.g. at Tevatron [1, 2, 3, 4] and HERA [5, 6, 7, 8]. Substantial progress has been achieved in the understanding of heavy-quark production at Tevatron energies [9], but large theoretical uncertainties still remain, mainly due to the dependence of the calculations on the renormalization and factorization scales. The observed large scale dependence of the NLO calculations is considered to be a symptom of large contributions from higher orders: small- effects [10, 11], where , are possibly relevant in the low transverse momentum () domain, while multiple-gluon radiation leads to large logarithms of and may be important at high [12]. The resummed logarithms of at next-to-leading-logarithmic accuracy have been matched to the fixed-order NLO calculation for massive quarks [13]. At the non-perturbative level, the b–hadron spectrum depends strongly on the parametrization of the fragmentation function [14]. The b-quark production cross section has also been studied in the general-mass variable-flavor-number scheme [15] and the factorization QCD approach [16, 17].
Measurements of b–hadron production at higher energies than before, provided by the Large Hadron Collider (LHC), represent an important test of the new theoretical calculations just mentioned. Measurements of inclusive b–quark production cross section require identification of inclusive events in which a b-quark has been produced in collisions. In results reported here, the discrimination of the heavy quark events has been achieved either exclusively, reconstructing the whole decay channel of a B meson, or inclusively, considering hard jets. In this context, two different tagging techniques have been applied: reconstruction of a displaced secondary vertex, and analysis of the transverse momentum spectrum of an energetic muon with respect to the closest jet.
2 The CMS detector
A detailed description of the CMS detector can be found elsewhere [18]. Some of the most relevant features for heavy flavor physics are summarized here.
The core CMS apparatus is a superconducting solenoid, of 6 m internal diameter, providing a magnetic field of 3.8 T. Within the field volume there are the silicon pixel and strip tracker, the crystal electromagnetic calorimeter and the brass/scintillator hadron calorimeter. Muons are detected by three types of gas-ionization detectors embedded in the steel return yoke: Drift Tubes (DT), Cathode Strip Chambers (CSC), and Resistive Plate Chambers (RPC). The muon detectors cover a pseudorapidity window , where , where the polar angle is measured from the -axis, which points along the counterclockwise beam direction. The silicon tracker is composed of pixel detectors (three barrel layers and two forward disks on each side of the detector, made of 66 million m2 pixels) followed by microstrip detectors (ten barrel layers plus three inner disks and nine forward disks on each side of the detector, with 10 million strips of pitch between 80 and 184 m). Thanks to the strong magnetic field and the high granularity of the silicon tracker, the transverse momentum, , of the muons matched to reconstructed tracks is measured with a resolution of about 1 % for the typical muons used in this analysis. The silicon tracker also provides the primary vertex position, with 20 m accuracy.
The first level (L1) of the CMS trigger system, composed of custom hardware processors, uses information from the calorimeters and muon detectors to select the most interesting events. The High Level Trigger (HLT) further decreases the rate before data storage.
3 Open beauty
b-‐jets play a key role in searches for new physics beyond the Standard Model. It took a while to fully establish a consistency between the Tevatron data and pQCD predictions for b–jet production cross section. Generally speaking, b–jets cross section measurements are highly non-trivial, and sizable uncertainties affect both theory and experiment: on one side, one has to deal with a typical multi–scale problem, in which the center–of–mass collision energy, mass of the b–quark and the factorization and re–normalization scales are entangled in a subtle way; on the other hand, excellent performance of the tracking is required, challenging the detector full potential.
The CMS Collaboration has published results, reviewed in the next sections, concerning two complementary measurements of b–jet production cross section. These results have made use of two different b–tagging techniques, were performed over nb-1 and nb-1 of 2010 data, respectively [19, 20], and were obtained using track or particle–flow jets. Typical values achieved by the CMS detector of the jet resolution and the energy scale uncertainty, at the time of these results were reported, were about %, and below %, respectively.
3.1 b–jets with muons
The measurement of the integrated and differential cross section of the reaction has been performed on jets coming from b–quarks. The production of a b–quark decaying semi–leptonically is deduced by the identification of a rather energetic muon inside a jet, where the transverse momentum relative to the jet axis is quite sizable. For a muon from a b–decay, the transverse momentum relative to the jet axis is on average larger than when the muon comes from light quarks; through this property it is hence possible to discriminate events in which b–quarks were produced.
A binned log-likelihood fit is performed on the spectrum of such a quantity, called “”, using template distributions provided by the simulation for and quarks, and derived from the data for gluons and lighter quarks. This latter distribution is dominated by hadrons misidentified as muons (mainly decay-in-flight), so they are reweighted by the misidentification rate measured in the data. Considering that the fit is not able to distinguish between light quark, gluon and charm components, these are merged together. The b–jet tag efficiency achieved with this technique is about % at GeV, and close to % above GeV, whereas the contamination is % in lowest bin, asymptotically decreasing towards % at high .
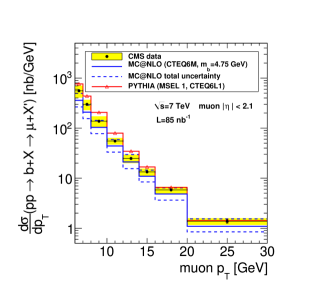
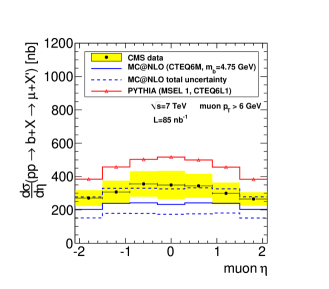
The result of the inclusive production cross section for b quarks decaying into muons within the kinematic range GeV and is:
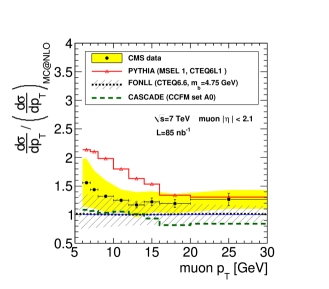
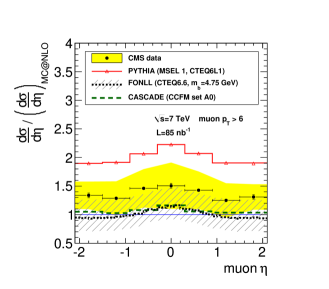
where the first uncertainty is statistical, the second is systematic, and the third is associated with the estimation of the integrated luminosity. Fig. 1 shows the measured value of the cross section for the reaction , as a function of the muon’s and . The result includes efficiency of trigger %, of muon reconstruction % and muon-jet association %.
The fit stability was tested against variation of the binning, repeating the fits on many simulated pseudo–experiments, cross–checking the results using jets from particle flow and performing the fits on the impact parameter distribution.
| source | cross section uncertainty (%) |
|---|---|
| Trigger efficiency | 5 |
| Muon reconstruction efficiency | 3 |
| Hadron tracking efficiency | 2 |
| b shape uncertainty | 21 |
| Background shape uncertainty | 2–14 |
| Background composition | 3–6 |
| Production mechanism | 2–5 |
| Fragmentation | 1–4 |
| Decay | 3 |
| Underlying event | 10 |
| Luminosity | 11 |
Table 1 summarizes the systematic uncertainties entailed in this measurement. The uncertainties dominating the measurement are those coming from the approximate knowledge of the signal and the background shape.
3.2 b–tagging with secondary vertices
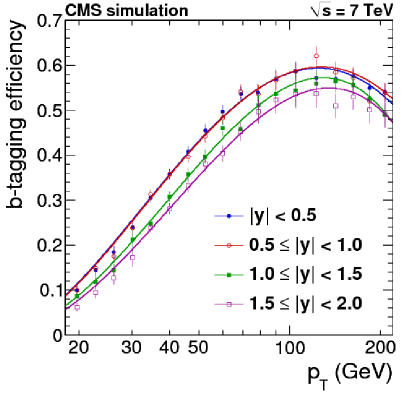
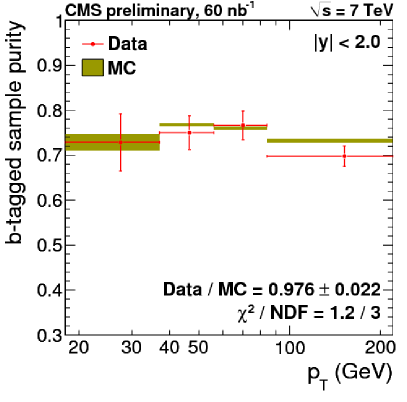
The identification of jets coming from the hadronization of b–quarks is possible also through the reconstruction of secondary vertices (SV). Once a displaced SV is reconstructed, different discriminators can be used to tag the jet as originating from a b–quark. In the analysis presented here, the discriminator adopted is a monotonic function of the 3D decay length. The decay length significance cut is chosen so that the corresponding tagging efficiency is about % at GeV, with a contamination of %. The b–tagging efficiency and the mistag rates from or light jets are evaluated from simulated events and constrained by a data/MC scale factor. The b–tagging efficiency with the selections used in this analysis is between 6% and 60% at GeV and . The efficiency rises at higher as the b–hadron proper-time increases. In order to evaluate the purity of the selected sample, a fit to the SV mass distribution is performed, taking the shapes from simulated events, and letting free the relative normalizations for c and b jets, with the (small) contribution from light quarks fixed to the Monte Carlo expectations (“template fit”). The efficiencies estimated from MC, and the estimates of b-tagged sample purity resulting from fits to secondary-vertex mass from data are shown in Fig. 3.
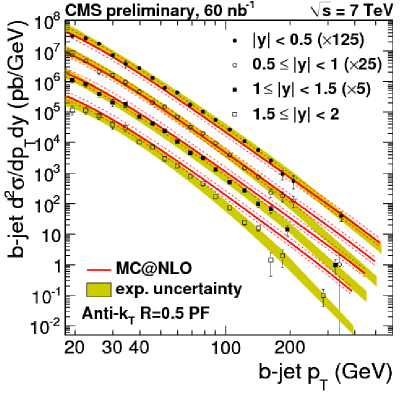
The data sample was collected using hadronic triggers with different thresholds of the jet . To merge them, the individual spectra of jets have been normalized with the luminosity of their data taking periods, and then combined into a single spectrum with the jet bins corresponding to intervals where the triggers were fully efficient. The overall transverse jet energy range goes from to GeV, and the measurements have been performed in four intervals. The jet energy corrections applied for rapidity dependence, and those for absolute scale and dependence, come from real data and simulated events, respectively.
The leading systematic uncertainties affecting the measurements are:
-
•
the jet energy scale of b–jets relatively to the inclusive ones (%);
-
•
data-driven constraints on b-tagging efficiency (%);
-
•
mistag rate for charm ( %) and for light jets ( –- %).
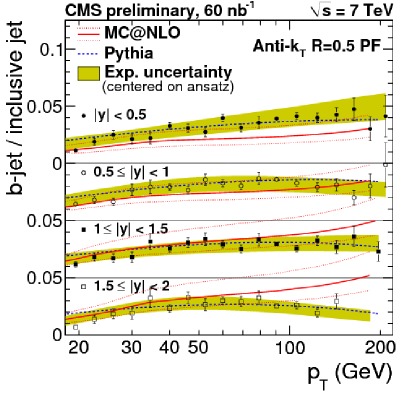
Fig. 4 shows the results for the production cross section measurements for b–jets as a function of the b–jet transverse momentum, compared with the MC@NLO predictions, and the ratio with the inclusive jets cross-section. While the agreement with Pythia and MC@NLO is reasonable, significant differences in shape are evident, the simulations predicting more b–jets at high than what is observed.
4 Conclusions
Recent results published by the CMS Collaboration on open beauty production have been summarized, all of them obtained analyzing the collision data at TeV collected in the year 2010. The studies made with two different techniques for b–tagging have been shown, together with the comparisons of the production cross section measured in the data with the predictions from the available theoretical models.
ACKNOWLEDGEMENTS
The involvement in this work was made possible by the founding of the INFN, sezione di Padova. I am grateful to Prof. U. Gasparini for all the sustaining and encouraging, and to the entire CMS Padova group for the fruitful collaboration.
References
- [1] D0 Collaboration, “Inclusive and b quark production cross-sections in collisions at TeV”, Phys. Rev. Lett. 74 (1995) 3548–3552.
- [2] D0 Collaboration, “The production cross section and angular correlations in collisions at TeV”, Phys. Lett. B487 (2000) 264–272.
- [3] CDF Collaboration, “Measurement of the bottom quark production cross section using semileptonic decay electrons in collisions at TeV”, Phys. Rev. Lett. 71 (1993) 500–504.
- [4] CDF Collaboration,“Measurement of the b-Hadron Production Cross Section Using Decays to Final States in Collisions at TeV”, Phys. Rev. D79 (2009) 092003.
- [5] H1 Collaboration, “Measurement of open beauty production at HERA”, Phys. Lett. B467 (1999) 156–164.
- [6] H1 Collaboration, “Measurement of beauty production at HERA using events with muons and jets”, Eur. Phys. J. C41 (2005) 453–467.
- [7] ZEUS Collaboration, “Measurement of beauty photoproduction using decays into muons in dijet events at HERA”, JHEP 04 (2009) 133.
- [8] ZEUS Collaboration, “Measurement of charm and beauty production in deep inelastic scattering from decays into muons at HERA”, Eur. Phys. J. C65 (2010) 65–79.
- [9] M. Cacciari, S. Frixione, M. L. Mangano et al., “QCD analysis of first b cross-section data at 1.96 TeV”, JHEP 0407 (2004) 033.
- [10] J.C. Collins and R.K. Ellis, “Heavy quark production in very high-energy hadron collisions”, Nucl. Phys. B 360 (1991) 3.
- [11] S. Catani, M. Ciafaloni and F. Hautmann, “High-energy factorization and small x heavy flavor production”, Nucl. Phys. B 366 (1991) 135.
- [12] M. Cacciari and M. Greco, “Large hadroproduction of heavy quarks”, Nucl. Phys. B 421 (1994) 530.
- [13] M. Cacciari, M. Greco and P. Nason, “The spectrum in heavy- avour hadroproduction”, JHEP 05 (1998) 007.
- [14] S. Frixione et al., “Heavy quark production”, Adv. Ser. Direct. High Energy Phys. 15 (1998) 609.
- [15] B.A. Kniehl, G. Kramer, I. Schienbein and H. Spiesberger, “Finite-mass effects on inclusive B–meson hadroproduction”, Phys. Rev. D 77 (2008) 014011.
- [16] M.G. Ryskin, A.G. Shuvaev and Y.M. Shabelski, “Comparison of factorization approach and QCD parton model for charm and beauty hadroproduction”, Phys. Atom. Nucl. 64 (2001) 1995.
- [17] H. Jung, “Heavy quark production at the Tevatron and HERA using factorization with CCFM evolution”, Phys. Rev. D 65 (2002) 034015.
- [18] CMS Collaboration, “The CMS experiment at the CERN LHC”, JINST 0803 (2008) S08004.
- [19] CMS Collaboration, “Inclusive b-hadron production cross section with muons in collisions at TeV”, Journal of High Energy Physics Volume 2011, Number 3, 90.
- [20] CMS Collaboration, “Inclusive b-jet production in pp collisions at TeV”, CMS-PAS-BPH-10-009.
- [21] T. Sjöstrand, S. Mrenna, P.Z. Skands, “PYTHIA 6.4 physics and manual”, J. High Energy Phys. 0605, 026 (2006).
- [22] H. Jung et al., “The CCFM Monte Carlo generator CASCADE”, Comput. Phys. Commun. 143 (2002) 100-111.
- [23] M. Cacciari, S. Frixione, P. Nason, “The spectrum in heavy flavor photoproduction”, J. High Energy Phys. 0103, 006 (2001).