Charged pion identification at high in ALICE using TPC
Abstract
The ALICE TPC provides excellent charged particle tracking for the study of pp and Pb–Pb collisions at LHC. The TPC also allows particle identification via the measurement of the specific ionisation . At high ( > 3 GeV) this is accomplished in the region of the relativistic rise of the energy loss. From the energy loss distributions the yields of charged pions, kaons, and protons can be determined in bins of and -spectra are constructed. Here we present the performance of such an analysis in pp collisions at 7 TeV for charged pions up to 10 GeV.
1 Introduction
Flow measurements and particle spectra from ultrarelativistic heavy ion collisions at RHIC and LHC have so far given many interesting results in the intermediate and high transverse momentum region GeV. In particular, measurements of elliptic flow [1] and high- suppression for identified particles [2] at RHIC have given insight in hadronisation mechanisms and the evolution of the quark gluon plasma.
This report presents a method for identifying charged particles at high with the TPC in ALICE. Performance results are shown for GeV.
2 The ALICE TPC
The ALICE Time Projection Chamber (TPC) is a gaseous tracking detector with full azimuthal acceptance, covering a pseudorapidity range of for full track length within the TPC volume [3]. It is a large (90 m3 gas volume) cylindrical barrel, with read-out at the two end caps. The drift field of 400 V/cm is generated by a central HV cathode. The end caps are segmented into 18 trapezoidal sectors each with Inner and Outer Read-Out Chambers (IROCs and OROCs), equipped with MultiWire Proportional Chambers (MWPCs). Here the signals are read out on 159 pad rows in the radial direction, for a total of about 560 000 pads. Such high read-out granularity is essential for tracking in the high-multiplicity environment of central heavy ion collisions, which is what ALICE is designed for. The front end electronics have on-board digital filters, allowing baseline restoration, cancellation of signal tails due to ion drift and data reduction via “zero-suppression”.
The TPC is used for tracking and measuring charged particle energy loss () and momentum , simultaneously. The latter two can be combined and used for particle identification (PID), as energy loss for a given charge follows a single curve in , being the particle mass. This curve can be well described by a Bethe-Bloch parametrisation, and the energy loss of each particle species will follow its own curve in . Figure 1 illustrates energy loss vs as measured by the ALICE TPC. Bethe-Bloch parametrisation curves for the different particle species are also drawn in the figure. The charge deposited on read-out pads along a track (charge clusters) follows a Landau-like distribution, with a tail of few instances of high-energy transfer. For this reason the energy loss is calculated as a truncated mean (the lowest 60%) of the distribution of track cluster charge. This is referred to as TPC signal in Fig. 1, or simply in the following.
The ALICE TPC resolution () is better than 5% for full length tracks, and the resolution as of December 2009 was at 10 GeV.

As is seen in this figure, in the low momentum region of a vs histogram, the particle species line up in bands according to their mass and charge. As and are both determined from the TPC there is no possibility for mismatches.
On the relativistic rise, GeV, the energy loss curves follow a logarithmically rising behaviour. Here the particle species curves are not separated enough for a unique particle identification on a track-by-track basis. Instead a statistical particle identification for the integrated yields is employed. This method will be described in the following.
3 Method
Event and track selection is carried out following the ALICE unidentified charged hadron spectra analysis [4]. An additional cut is applied to reject tracks crossing areas between the TPC read-out sectors which are not instrumented, since these tracks have worse resolution, due to the smaller number of ionisation measurements. This analysis focuses on high-momentum tracks, which are only bent a little by the magnetic field. With increasing rigidity, only tracks with an original angle pointing to the area between two sectors will be significantly affected.
The method is based on the energy loss, which is parametrised in . Final results are obtained from fits in . The main steps of the method are as follows:
-
1.
A 2D histogram is filled with vs , measured for each track in the TPC.
-
2.
This 2D histogram is fitted with a sum of three Gaussians (, K, p) for each bin, where the mean of each Gaussian follows a common parametrisation of the Bethe-Bloch curve. The d/d vs dependence is thus extracted in one simultaneous fit. The plateau is extracted using a clean electron sample in the low- region.
-
3.
For each interval, a 1D histogram is filled with d/d (for each track).
-
4.
The histograms are fitted with a sum of four Gaussians: one for each of the particle species p, K, and e. The yields are the only free parameters; the others (8 out of 12) are fixed in the following way:
-
-
The Bethe-Bloch fit extracted in (2) is used to fix the means.
-
-
The widths of the Gaussians are fixed to values determined using a clean sample of minimum ionising pions, from the observed relation that the relative width is found to be constant (the width scales with d/d).
-
-
-
5.
From the fits, particle yields as a function of transverse momentum are determined.
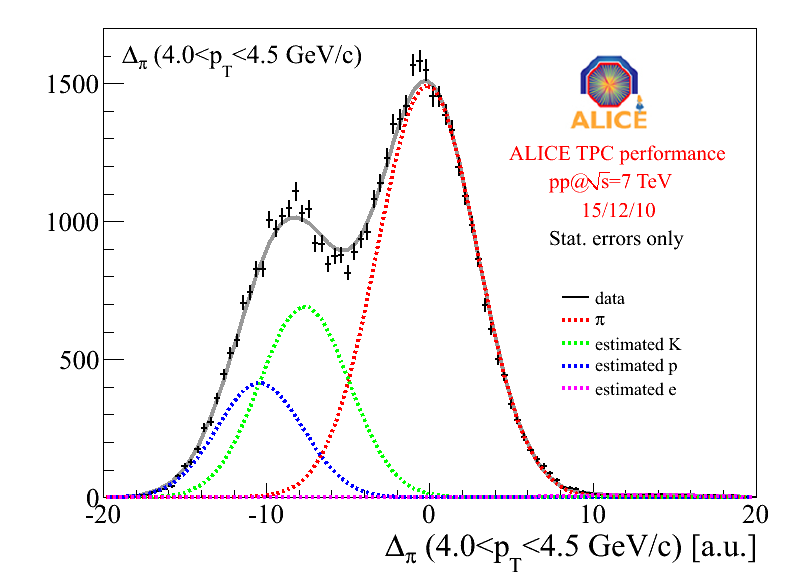
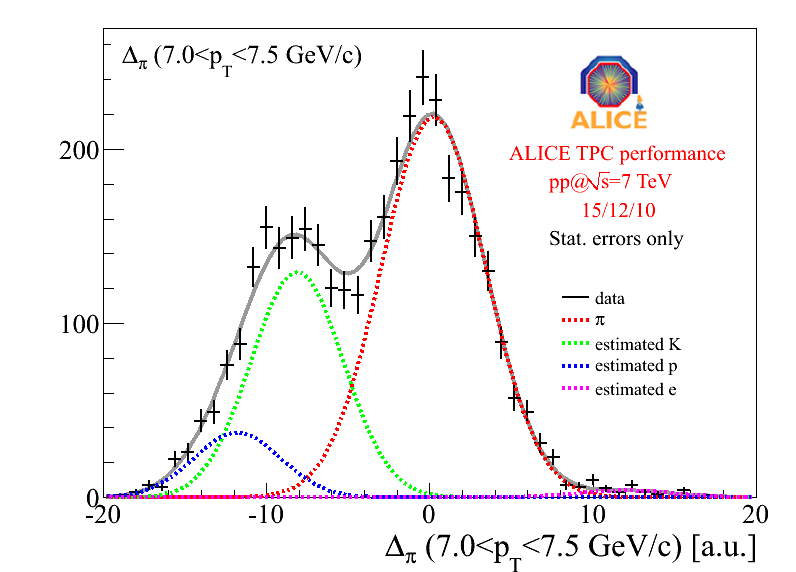
Examples of fits are shown for two bins in Fig. 2. Positive and negative particles are treated both together, to increase statistics, and separately, to enable the study of antiparticle-to-particle ratios (expected to be close to 1 at mid-rapidity at LHC).
4 Performance of the analysis
As was seen in the two example fits above, the fit to the peak is completely determined from the right-hand side, making these fit results very stable (since it is essentially a single Gaussian fit). Protons and kaons have smaller mass ratio than kaons and pions, giving smaller separation. The quality of the fit result for these species is thus harder to verify. For this reason, the remainder of this report focuses on the pions, even though identification of all three species is pursued.

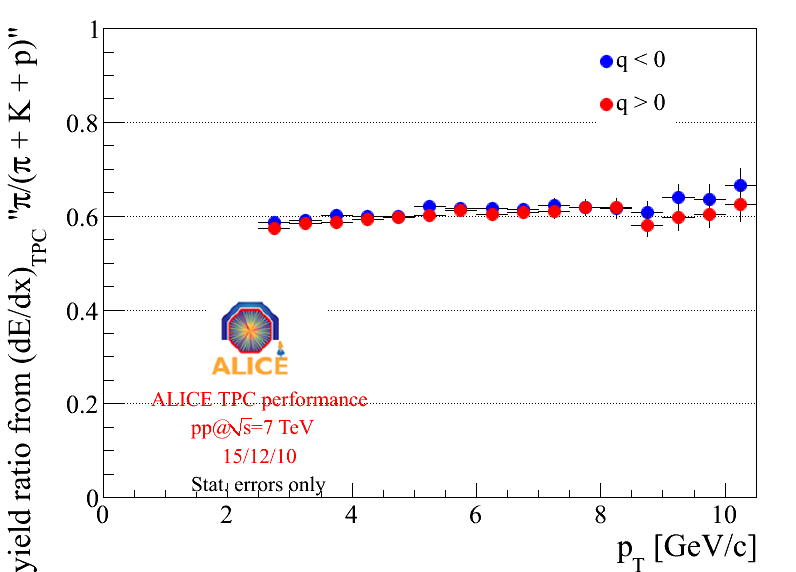
Apart from visually inspecting the fit results, a number of crosschecks are done to assess the performance of the method. This is illustrated in Fig. 3. One consistency check is to take the ratio of the estimated positive and negative pion yields. The raw yield ratio shown in Fig. 3(a) is consistent with the expected value of 1. Figure 3(b) shows the resulting raw yield fraction out of the total hadron yield, as a function of . Here it is seen that the obtained yield fractions of positive and negative pions, respectively, agree within statistical errors over the full range. The raw charged pion yield as a function of obtained with this method is shown in Fig. 4, without normalisation or other corrections.

5 Conclusion
A method using the TPC for identification and yield extraction of charged
particles at high has been presented. The very good
performance of the ALICE TPC, and the stable performance results of the method
presented here, are very promising for extracting in particular the charged
pion yields.
References
References
- [1] S. S. Adler et al (PHENIX Collaboration). Phys. Rev. Lett., 91:182301, 2003. arXiv:nucl-ex/0305013v2.
- [2] K. Adcox et al (PHENIX Collaboration). Phys. Rev. Lett., 88:022301, 2002. arXiv:nucl-ex/0109003v2.
- [3] J. Alme et al. Nucl. Instrum. Meth. A, 622:316–367, 2010. arXiv:1001.1950.
- [4] K. Aamodt et al (ALICE Collaboration). Phys. Lett. B, 693:53–68, 2010. arXiv:1007.0719.