Photometric AGN reverberation mapping – an efficient tool for BLR sizes, black hole masses and host-subtracted AGN luminosities
Photometric reverberation mapping employs a wide bandpass to measure the AGN continuum variations and a suitable band, usually a narrow band (NB), to trace the echo of an emission line in the broad line region (BLR). The narrow band catches both the emission line and the underlying continuum, and one needs to extract the pure emission line light curve. We performed a test on two local AGNs, PG0003+199 (=Mrk335) and Ark120, observing well-sampled broad- (, ) and narrow-band light curves with the robotic 15cm telescope VYSOS-6 on Cerro Armazones, Chile. In PG0003+199, H dominates the flux in the NB by 85%, allowing us to measure the time lag of H against without the need to correct for the continuum contribution. In Ark120, H contributes only 50% to the flux in the NB. The cross correlation of the and NB light curves shows two distinct peaks of similar strength, one at lag zero from the autocorrelated continuum and one from the emission line at = 47.5 3.4 days. We constructed a synthetic H light curve, by subtracting a scaled light curve, which traces the continuum, from the NB light curve. The cross correlation of this synthetic H light curve with the light curve shows only one major peak at = 48.0 3.3 days, while the peak from the autocorrelated continuum at lag zero is absent. We conclude that, as long as the emission line contributes at least 50% to the bandpass, the pure emission line light curve can be reconstructed from photometric monitoring data so that the time lag can be measured. For both objects the lags we find are consistent with spectroscopic reverberation results. While the dense sampling (median 2 days) enables us to determine with small (10%) formal errors, we caution that gaps in the light curves may lead to much larger systematic uncertainties. We calculated a virial black hole mass for both objects in agreement with literature values, by combining () from photometric monitoring with the velocity dispersion of a single contemporaneous spectrum. We applied the flux variation gradient method to estimate the host galaxy contribution in the apertures used and thus the host-subtracted restframe 5100Å luminosity during the time of our monitoring campaign. At the AGN/host contrast of our sources () the uncertainty of is 10%. For both sources, our differs significantly from previous estimates, placing both sources 50% closer to the relation. Our results suggest that the scatter in the current relation is largely caused by uncertainties in due to undersampled light curves and by uncertainties in the host-subtracted AGN luminosities inferred so far. If the scatter can be reduced sufficiently, then two quasar samples matching in should match also in intrinsic , independent of redshift, thus offering the prospect to probe cosmological models. Photometric reverberation mapping opens the door to efficiently measure hundreds of BLR sizes and host-subtracted AGN luminosities even with small telescopes, but also routinely with upcoming large survey telescopes like the LSST.
Key Words.:
galaxies: nuclei – quasars: emission lines – galaxies: distances and redshifts – distance scale – dark energy.1 Introduction
Reverberation mapping (Blandford & McKee 1982) has revolutionised our understanding of active galactic nuclei (AGN) during the past decades. Spectroscopic monitoring measures the mean time lag between brightness changes of the triggering optical-ultraviolet continuum (from the compact accretion disk around the black hole) and the emission line brightness echo of the BLR gas clouds further out; the mean BLR size is then , where is the speed of light. The BLR size as measured by the centroid of the cross correlation of light curves represents a luminosity-weighted average (Koratkar & Gaskell 1991, Penston 1991). Evidence exist that the BLR clouds are essentially in virialised motion around the central black hole (Peterson et al. 2004 and references therein). Combining with velocity dispersion of the emission line, the virial black hole mass can be estimated as , where is a scaling factor in the order of unity to account for the geometry of the BLR and is the gravitational constant.
Reverberation based BLR sizes and black hole masses have been determined so far for only about 45 low- and intermediate-luminous AGN (Wandel et al. 1999, Kaspi et al. 2000, Peterson et al. 2004, Bentz et al. 2010). Six years of reverberation mapping of six luminous high-redshift () quasars, using the 9.2 m Hobby-Eberly-Telescope in Texas, resulted in a tentative determination of only one quasar, while in the other five sources the existence of pronounced variation patterns could be established (Kaspi et al. 2007).
Reverberation spectra usually require observations with at least a 2 m-class telescope. The BLR sizes range between a few and several hundred light days and the time spans become even longer in the observer’s frame due to the time dilation factor . To match distinct echo features, light curves over a few months to several years are needed. Consequently, spectroscopic reverberation mapping is resource expensive and it becomes prohibitive at high redshift. Therefore, more efficient observing strategies are desired.
Another issue with respect to the BLR size – AGN luminosity relationship is how to determine the AGN luminosity free of host galaxy contributions. While high spatial resolution images have been invoked to model and subtract the host contribution from the total fluxes (e.g. Bentz et al. 2009), the flux variation gradient method (Choloniewski 1981) provides an efficient approach which we will inspect here as well.
We here revisit photometric reverberation mapping. It employs wide pass bands to trace the AGN continuum and suitable narrow-bands to trace the echo of the BLR lines. The advantage is that photometric monitoring can be obtained much faster and with small telescopes. Furthermore, while long-slit spectroscopic monitoring allows for simultaneous measurement of typically one or two calibration stars placed accurately on the spectrograph slit, one may expect that the large number of non-variable calibration stars on the same images and of similar brightness as the AGN facilitates to attain photometric monitoring with high precision.
About 40 years ago, narrow-band AGN monitoring of emission lines has been performed, for instance for NGC 3516 and NGC 4151 (Cherepashchuk & Lyutyi 1973). Despite the coarse (10 days) time sampling, these observations discovered a lag between H and the continuum of 25 and 30 days for NGC 3516 and NGC 4151, respectively. However, spectroscopic monitoring with better time sampling finds a lag of days for NGC 3516 (Peterson et al. 2004) and days for NGC 4151 (Bentz et al. 2006). The discrepancy between the photometrically and spectroscopically determined lags is most likely due to insufficient time sampling of the early photometric monitoring.
To explore the capability and achievable accuracy of photometric reverberation mapping, we selected two local AGNs, the relatively clear-cut case PG0003+199 (Mrk 335) at redshift and the more challenging case Ark 120 at . Spectroscopic reverberation results are available for comparison (Peterson et al. 1998a, 2004).
2 Data
We performed a monitoring campaign between August 2009 and March 2010 using the robotic 15 cm telescope VYSOS-6 of the Universitätssternwarte Bochum on Cerro Armazones, the future location of the ESO Extremely Large Telescope in Chile. VYSOS-6 is equipped with a pixel CCD yielding a field-of-view of , and seven broad- and narrow-band filters.111Since August 2010, VYSOS-6 consists of two 15 cm telescopes on the same mount, equipped with 14 broad- and narrow-band filters.
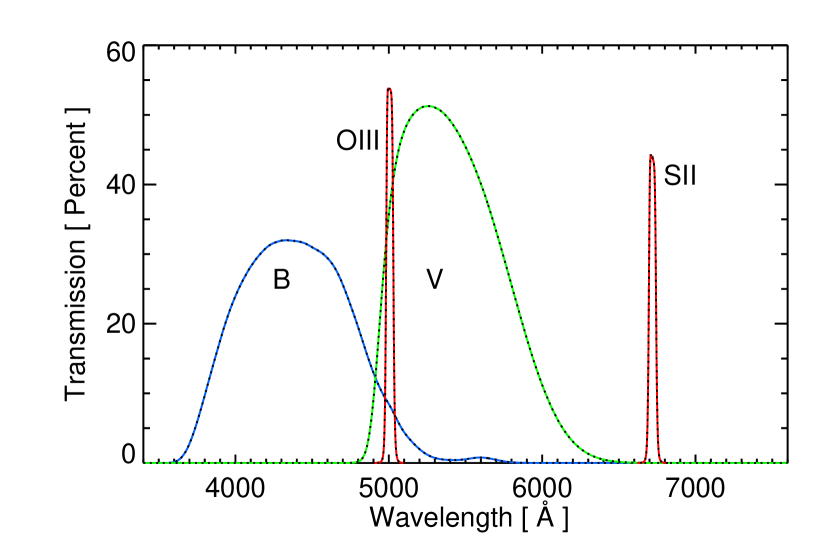
We obtained light curves with a median sampling of 2 days in the -band (Johnson, Å), the redshifted H (NB Å at ) and H lines (NB Å at ). For Ark 120 we also obtained a light curve in the -band (Johnson, Å). In addition, we observed PG0003+199 in both and on July 25th 2010 and June 26th 2011. Figure 1 shows the effective transmission of the filters used here. To perform absolute photometric calibration, each night we observed standard stars in the fields SA092, SA095, SA111 from Landoldt (2009). For both targets, a single contemporaneous spectrum was obtained with CAFOS at the 2.2 m telescope on Calar Alto, Spain, with a slit width of 154.
We reduced all data in a standard manner, using IRAF and custom written tools. Because the flux calibration using the standard star fields introduces additional errors in the light curves, we created relative light curves (in normalised flux units) using 20-30 non-variable stars located on the same images within 30 around the AGN and of similar brightness as the AGN. For the analysis of time lags we used the mean and standard deviation of these relative light curves. For the photometric analysis (to obtain the AGN luminosities), we kept the shape of the mean light curves fixed and calibrated them by a least-squares fit to the photometry derived from the standard star fields. Source parameters and photometry results are summarized in Table 1.
3 Results
3.1 Results on PG0003+199
PG0003+199 is essentially a point-like low-luminosity quasar (Narrow Line Seyfert-1) without a bright extended host. The H line is strong and well covered by the narrow-band filter. This makes PG0003+199 a clear-cut test case.
3.1.1 Spectrum
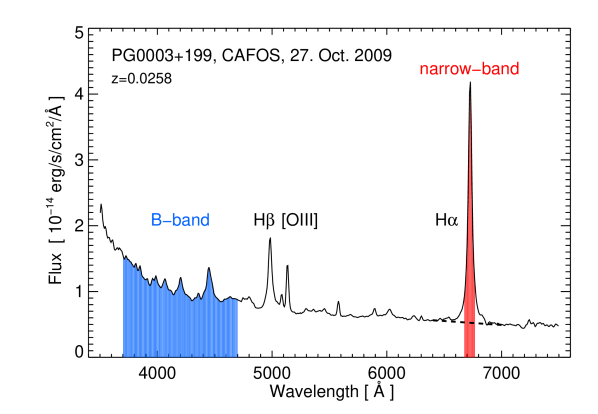
Fig. 2 shows the spectrum of PG0003+199. The contribution of higher order Balmer lines (and that of the host galaxy) to the -band is negligible, thus the -band is dominated by the AGN continuum. Taking into account the spectral resolution, the observed H line dispersion km/s reduces to an intrinsic value km/s. The narrow-band filter effectively covers the line between velocities km/s and km/s, so that at least 95% of the line flux is contained in the band pass, as we determined after line profile deconvolution.
The contribution of both the [N II] 6583 Å and narrow-line H flux is predicted to be smaller than 40% of the [O III] 5007 Å emission (Bennert et al. 2006), hence negligible (). The continuum underneath the emission line is small, contributing to only 15% of the total flux in the band pass. Therefore, the narrow-band light curves will be dominated by the H echo of the BLR gas clouds. Comparison with simulated line profiles of echo models (Welsh & Horne 1991, Horne et al. 2004) ascertains that the 5% line flux outside the band pass has only a marginal effect (%) on the BLR size determination: The narrow-band echo may miss only a small fraction (%) of the innermost part of the BLR, namely that part which exhibits the fastest line-of-sight velocity, while the innermost gas clouds moving closer along the sky plane exhibit a modest line-of-sight velocity and are therefore contained in the narrow-band.
3.1.2 Light curves and BLR size
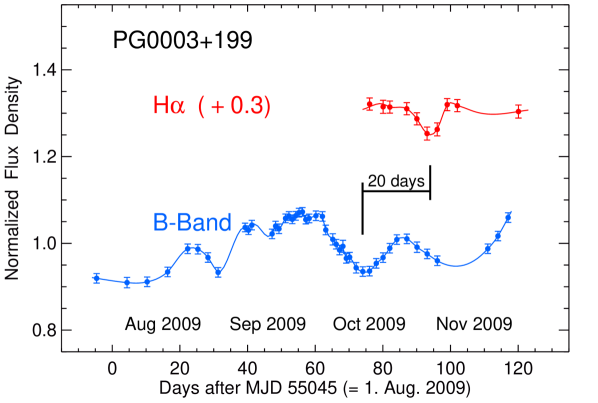
Fig. 3 depicts the light curves of PG0003+199. The AGN continuum as traced by the -band increases gradually from August 2009 to a peak around end of September, followed by a steep trough by 20% at MJD 55118 (= 55045 + 73). Also the H light curve has a steep 10% trough with a delay of about 20 days.
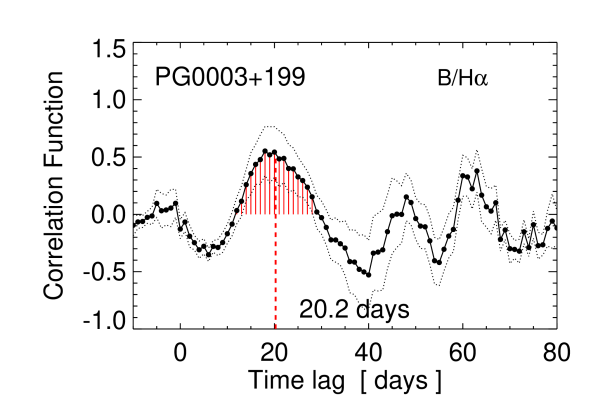
We used the discrete correlation function (DCF, Edelson & Krolik 1988) to cross correlate the H and -band light curves. The cross correlation shows a major peak with a lag of 20.2 days as defined by the centroid (Fig. 4). Two smaller correlation peaks around lag 50 days and 65 days are present; they are caused by the -band troughs at begin and mid of September 2009 (Fig. 3). We here do not consider these two lags further, because spectroscopic reverberation predicts a lag of less than 30 days (Peterson et al. 2004).
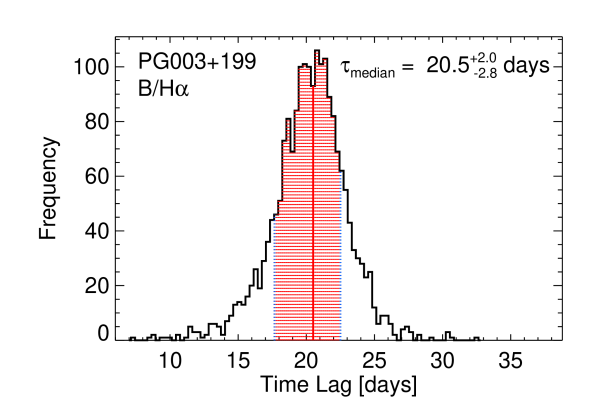
To determine the lag uncertainty, we applied the flux randomization and random subset selection method (FR/RSS, Peterson et al. 1998b). From the observed light curves we created 2000 randomly selected subset light curves, each containing 63% of the original data points, and randomly altering the flux value of each data point consistent with its (normal-distributed) measurement error. Then we cross correlated the 2000 pairs of subset light curves and computed the centroid . Fig. 5 shows the distribution of the 2000 values which yields the median lag and the 68% confidence range. From this distribution we obtain a lag = 20.5 days. Thus, the mean of positive and negative uncertainty of is about 12% (2.4/20.5).222The observed H light curve has only 10 data points, three of which are in the trough. While a subset of exactly 63% data points would require to take 6.3 data points, we selected 7 random data points. This 10% larger number of data points may bias the errors to somewhat smaller values. On the other hand, we find the largest errors for those randomly selected subset light curves, where all three data points in the trough are omitted. In this case the information about the existence of a trough is completely lost. To counterbalance this effect, we selected 7 instead of 6.3 data points. Correcting for the time dilation (factor at ) yields a rest frame lag of 20.0 days.
We did not find H lags of PG0003+199 in the literature, but we can compare our result with that of the H line for which spectroscopic reverberation mapping found a rest-frame lag of days averaged over several epochs (Peterson et al. 2004, Bentz et al. 2009). This H lag is 30% smaller than our H lag of 20.0 days. One possible explanation could be that the BLR size is smaller for higher excitation emission lines. Kaspi et al. (2000) found in the spectroscopic reverberation data of 17 PG quasars with a scaling factor , but a high uncertainty of . On the other hand, Kollatschny (2003a) provides clear evidence for the BLR stratification of Mrk 110 (, his Table 1). Recently, the Lick AGN Monitoring Program of 11 low-luminosity AGN found (Bentz et al. 2010). It could be that the BLR stratification and the scaling factor depends on the luminosity. The luminosity of PG0003+199 is similar to that of Mrk 110. If the value of Mrk 110 holds for PG0003+199, then the H lag of PG0003+199 translates to an H lag of 15.7 1.37 = 21.5 days, hence agrees within 8% with the restframe H lag of 20.0 days from our measurement.
3.1.3 Black hole mass
Next we try to determine the mass of the central black hole. While spectroscopic reverberation data enable one to use the velocity information from the rms spectra, i.e. from the variable portion of the emission lines, several attempts have been performed to determine the mass of the central black hole using single epoch spectra (e.g. Vestergaard 2002, Woo et al. 2007, Denney et al. 2009a). Thereby the reported uncertainties of the velocity dispersion range between 15% and 25%. Combining for PG0003+199 the intrinsic line dispersion from our single spectrum ( km/s, with 25% uncertainty adopted) and the time delay (20.0 2.4 days) yields a virial black hole mass , in agreement with the value of M⊙ derived via spectroscopic reverberation mapping by Peterson et al. (2004).
3.1.4 Host-subtracted AGN luminosity
To determine the AGN luminosity free of host galaxy contributions, we applied the flux variation gradient (FVG) method proposed by Choloniewski (1981). In this method the and data points obtained in the same night through the same apertures are plotted in a -flux versus -flux diagram. Note that fluxes (e.g. in units of mJy) are plotted and not magitudes. The important feature is that the flux variations follow a linear relation with a slope given by the host-free AGN continuum (e.g. Choloniewski 1981, Winkler et al. 1992, Winkler 1997).
In the flux-flux diagram the host galaxy – including the contribution of line emission from the narrow line region (NLR) – lies on the AGN slope somewhere toward its fainter end. This has been demonstrated for a sample of 11 nearby AGN (neither containing PG0003+199 nor Ark120) by Sakata et al. (2010), using monitoring data in combination with Hubble Space Telescope and multi-band ground-based images from the MAGNUM telescope. For 83 aperture, they derived host galaxy colours in the range 0.8 1.1 (their Table 6), which agree with the typical colours of a bulge or an elliptical galaxy. This colour range corresponds to a host slope in the range . The contribution of the NLR emission lines to the and bands is less than 10% of the host flux and has a similar color as the host galaxy (cf. Tables 6 and 8 of Sakata et al. 2010). We note that dust enshrouded nuclear starbursts, which often accompany the AGN phenomenon, have red colors (). They would be unresolved on HST images and could explain the small deviations of the host position from the AGN slope found in three cases by Sakata et al. (2010). Therefore, by host we here denote the host galaxy including NLR AGN lines and starbursts.
The host slopes pass through the origin. Because the host slopes are flatter than typical AGN slopes (), the intersection of the two slopes should occur in a well defined range. Winkler et al. (1992) showed for NGC 3783 that this intersection range allows one to determine the host flux contribution and to calculate a host-subtracted AGN luminosity at the time of the monitoring campaign – even without the need for high spatial resolution images. Next (and in Sect. 3.2.4) we test this procedure on our data. Table 2 summarizes the results of the FVG diagnostics, which are derived as follows:

During our monitoring campaign of PG0003+199 in Aug-Nov 2009, we obtained only fluxes, but we have three data points at hand for the versus flux-flux diagram as shown in Fig. 6. All data are corrected for galactic foreground extinction (Tab. 1). The fact that PG0003+199 was much brighter in 1979 (McAlary et al. 1983) than in 2009-2011 allows us to achieve a linear least-squares fit to the data points with sufficient accuracy. The fit yields an AGN slope . This slope is at the steep end, but within the range determined by Winkler et al. (1992) for other type-1 AGN.
To check the slope of PG0003+199 further, we searched in the NASA Extragalactic Database (NED) and found two more and data points taken with comparable apertures, one with 157 by McAlary et al. (1983) and one with 140 by Elvis et al. (1994). These (extinction corrected) data points are displaced to the right of the 78 slope in Fig. 6, because they contain additional host emission from the extended disk which is redder than the AGN emission. These two data points yield a slope . The consistency of derived from two independent data sets corrobborates the steep AGN slope of PG0003+199.
The range of host slopes () is taken from Sakata et al. (2010). The intersection area of the AGN and host slopes defines the host flux. Averaging over the intersection area yields a mean host flux of 2.16 0.29 mJy in and 4.56 0.30 mJy in .
During our monitoring campaign, the total fluxes lie in the range between 5.69 mJy and 6.78 mJy with a mean of 6.24 0.31 mJy. To derive the contemporaneous 5100Å AGN luminosity, which is widely used in reverberation studies, we tried to extrapolate the host-subtracted fluxes to restframe 5100Å fluxes, using a power-law spectral shape () with being constrained by . But this extrapolation results in large uncertainties, because depends sensitively on errors in . Therefore we applied the following procedure, inferring in a first step the flux range.
During our monitoring campaign, the fluxes should lie in the intersection area of the flux range with the AGN slope (blue shaded area in Fig. 6). The fact that the data point from June 2011 lies in this area supports our suggestion. From this area we infer the fluxes during the monitoring campaign, yielding a mean = 7.95 0.31 mJy.
Then, during our monitoring campaign the host-subtracted AGN fluxes are in the range 4.08 0.43 mJy in and 3.39 0.40 mJy in . From this range we interpolate the host-subtracted AGN flux of PG0003+199 at restframe 5100Å = 3.52 0.41 mJy, adopting for the interpolation that the AGN has a power law spectral energy distribution (). To determine the errors on , we interpolated between and as well as between and . At the distance of 112.6 Mpc this yields a host-subtracted AGN luminosity . Note that the 12% uncertainty includes the measurement errors, the uncertainty of the AGN and host slopes, and the AGN variations.
The AGN luminosity during our campaign derived with the FVG method is about a factor two smaller than the value derived with host galaxy modelling by Bentz et al. (2009) for the data of the spectroscopic monitoring campaign (Peterson et al. 1998a). To understand this difference, we compared the numbers given in Bentz et al. (their Tables 7-9) with ours. Our aperture area ( in diameter) is only 25% larger than that of Peterson’s campaign (), and the additional flux from the outer region is negligible (Fig. 3 in Bentz et al. 2009). The total observed (not extinction corrected) fluxes are similar, being for our campaign and for Peterson’s campaign. The main difference, however, lies in the estimate of the host contribution. Already in the early stage of the HST image decomposition with GALFIT, Bentz et al.’s host flux () corresponds after extinction correction to , which is more than a factor two smaller than our .
As illustrated in Fig. 6, it is hard to bring the small host flux from GALFIT modelling into agreement with the available FVG data. Firstly, we consider whether the discrepancy may be caused by failures of the FVG method. We find: 1) Altering the assumptions on the host slope does not bring the host contributions into agreement. 2) Although the AGN slope is determined by only a few data points, the large flux range, which allows for a good slope determination, and the consistency between the AGN slope determined with apertures of 78 and 15 argues in favour of a steep AGN slope. 3) The correction for galactic foreground extinction may introduce errors in the AGN slope. However, the foreground extinction is relatively small (Table 1) and even without correcting for foreground extinction the AGN slope remains steep () resulting in , hence about twice the GALFIT host value. 4) If the host flux from GALFIT modelling were correct, then at low luminosity the AGN slope (of PG0003+199) would show a strong curvature towards redder colours, in contradiction to the results by Sakata et al. (2010) where the host galaxy lies on the linear extension of the AGN slope. These four arguments lead us to conclude that the discrepancy between GALFIT and FVG host fluxes is not caused by errors in the FVG method alone. On the other hand, looking for potential error sources in the GALFIT method, it could be that a large fraction of the bulge and/or nuclear starbursts of PG0003+199 is unresolved on the HST images and therefore underestimated by the GALFIT modelling. Future data may clarify this issue.
3.2 Results on Ark 120
3.2.1 Implications from the spectrum
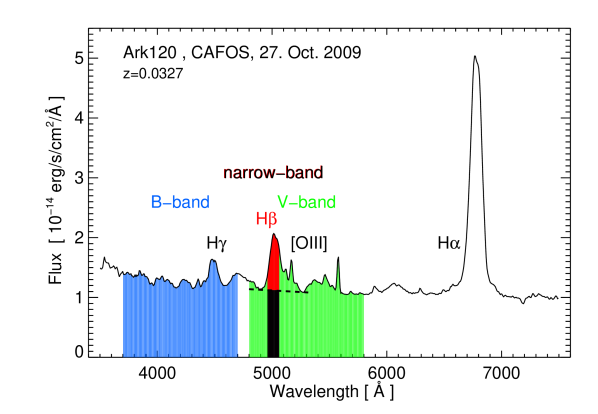
Ark120 lies at redshift so that the H line falls into the NB Å filter. Compared to the case of PG0003+199, the observations of Ark 120 are more challenging: Firstly, compared to H, the H line is fainter contributing only to 50% of the flux in the NB band pass (Fig. 7). In order to measure the continuum variations underneath the H line, light curves using neighbouring off-line intermediate-bands would be ideal but such bands were not available. While the -band covers H and the Fe complex, it is dominated to 83% 3% by the AGN and host continuum (calculated using the transmission curve of filter and CCD shown in Fig. 1) and therefore we used the -band, in addition to -band and NB 5007 Å. The second challenge is that (after accounting for the spectral resolution) the H line is broader than the narrow bandpass, so that the broadest line wings, carrying about % of the line flux, escape detection in the NB. Despite of these handicaps, the results are promising.
3.2.2 Light curves and BLR size
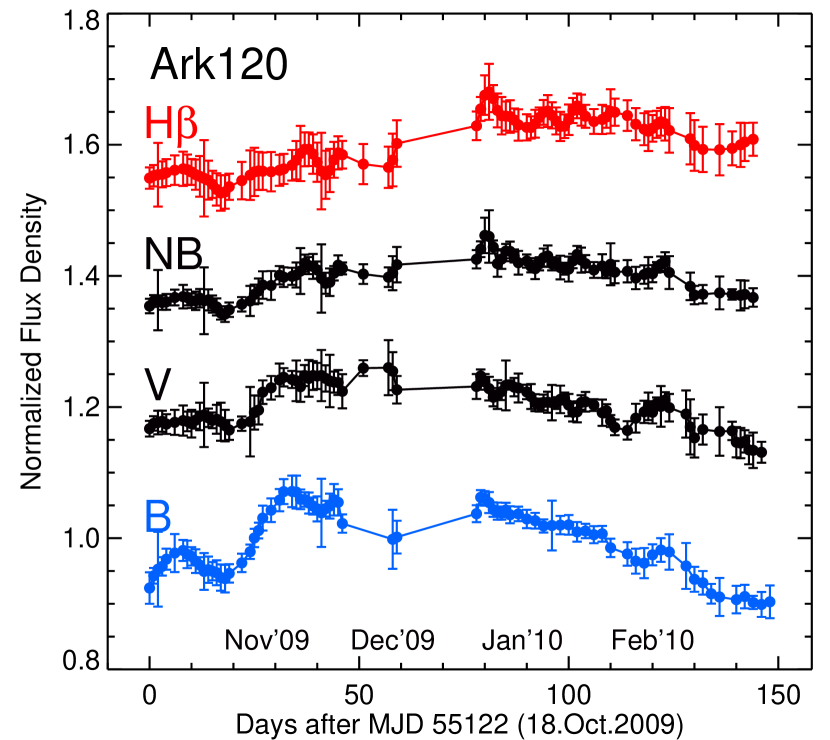
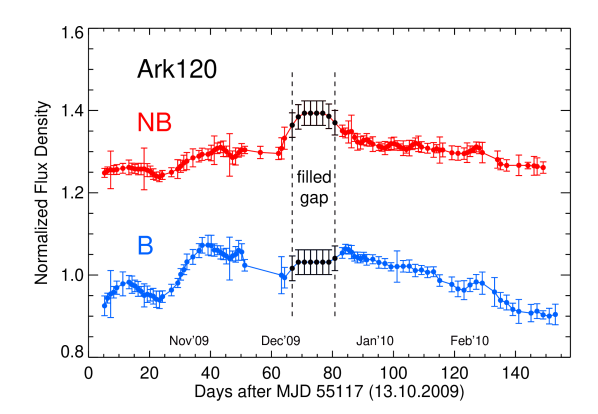
Fig. 8 depicts the light curves of Ark 120. The dense time sampling clearly outlines the variations. The -band steeply increases during ten days November 2009 by about 17% with a sharp peak at end of November 2009; from January to March 2010 it declines gradually by about 17%. In November the and NB light curves are similar to that of the -band, but with smaller amplitude ( 10%, NB 7%). In contrast to the steep band flux increase, the NB flux increase is stretched until January 2010 with an amplitude of 12-15% between begin of November and January. The possible influence of the missing data in December 2009 is discussed in Section 4.
The NB contains about 50% continuum and 50% H (Fig. 7). In order to remove the continuum, we computed a synthetic H light curve by subtracting a scaled curve from the NB curve: H = NB 0.5 ( scaling factor = 0.5). Alternating the scaling factors between 0.4 and 0.6 yields similar results. The synthetic H curve still has a remaining variability pattern in Oct-Nov which we suggest to arise from the relicts of the continuum. However, the important result is that compared to November the 10% higher flux level in January becomes more pronounced. While the subtraction of a scaled curve from the NB curve turns out to be a successful approach to recover a pure H light curve, we discuss potential refinements in Section 4.
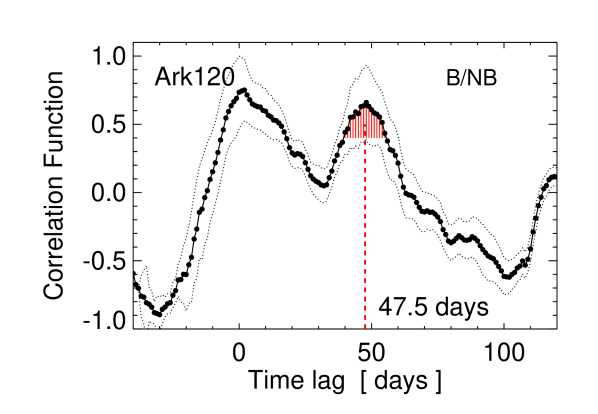
Fig. 9 shows the cross correlation results applying in a first step the DCF to the entire light curves. The DCF of and NB exhibits two distinct major peaks, one at a lag of 47.5 days and one at a lag of about zero days. Because the cross correlation of and yields a lag of 1.2 days consistent with lag zero, we conclude that the lag zero peak in the DCF of and NB comes from the continuum contribution contained in the NB. This contribution appears here quasi in autocorrelation, while the lag of 47.5 days is due to the line echo. This is further corroborated by the DCF of the and synthetic curves, where the peak at lag 47.7 days dominates, while the continuum caused contribution at lag zero is much reduced. This shows that the subtraction of a scaled light curve from the narrow-band light curve, in fact, largely removes the interferring continuum emission, allowing us to measure the lag of the emission line.
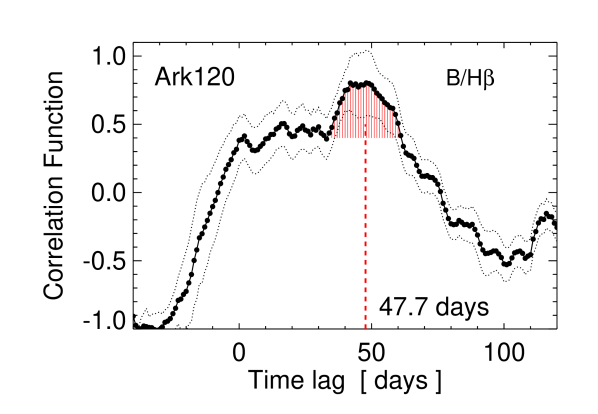
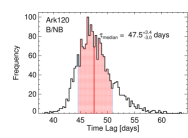
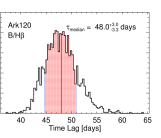
To determine the lag uncertainties, we applied the FR/RSS method, again creating 2000 randomly selected subset light curves, each containing 63% of the original data points, and randomly altering the flux value of each data point consistent with its (normal-distributed) measurement error. Then we cross correlated the 2000 pairs of subset light curves and computed the centroid . As shown in Fig. 10, the resulting median lag is = 47.5 days for the DCF of and NB, and = 48.0 days for the DCF of and synthetic H. For short, the lag uncertainty is about 7%. Correcting 48.0 days for the time dilation factor (1.0327) we obtain a rest frame lag of 46.5 3.25 days, consistent with the lag found by spectroscopic monitoring ( days by Peterson et al. 1998a, 2004, and in the range 34-54 days by Doroshenko et al. 1999).
3.2.3 Black hole mass
From our single epoch spectrum we determined an intrinsic H line dispersion km/s, in agreement with the value by Peterson et al. (2004). To get rid of the red wing of the H line, we mirrored the blue side of the H line profile to the red, and calculated the line dispersion of this synthetic profile. The shape and the dispersion of this profile are consistent with what we derived for H ( km/s) and H ( km/s). Combining line dispersion (with 25% uncertainty adopted) and the time delay (46.5 3.25 days) yields a virial M⊙, consistent with the value of M⊙ derived via spectroscopic reverberation mapping by Peterson et al. (2004).
Already in the 1970s and 1980s numerous studies revealed that the H line profile of Ark120 is strongly variable and exhibits two peaks in the rms spectra and a prominent red wing, which is neither present in H nor in H (Fig. 7). As discussed by Doroshenko et al. (1999), the BLR of Ark120 may show accretion inflows in addition to the virialised motion, and therefore any black hole mass estimates should be considered with some reservation.
3.2.4 Host-subtracted AGN luminosity
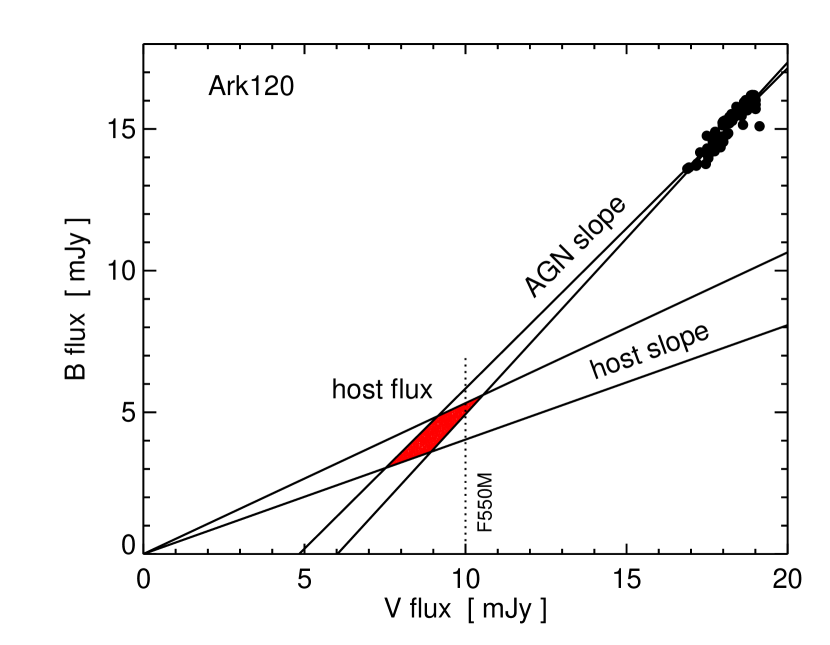
To separate AGN and host luminosity contributions, we applied the flux variation gradient method (Choloniewski 1981). Fig. 11 shows the versus fluxes of Ark 120, corrected for galactic foreground extinction (Schlegel et al. 1998). Table 2 summarizes the results. A linear least-squares fit to the flux variations yields , consistent with found by Winkler et al. (1992, using 20 aperture and adopting ) and with found by Doroshenko et al. (2008, after correcting the values in their Table 3 for extinction; note that due to a typo the value in this Table should be , in order to be consistent with the plotted values in their Fig. 4). The range of host slopes is taken from Sakata et al. (2010). The intersection area of the AGN and host slopes defines the host contribution. Averaging over the intersection area yields a mean host flux of = 4.26 0.59 mJy and = 9.02 0.62 mJy. Our host fluxes (in a 75 aperture) are consistent, albeit a bit high, when compared with the values and (in a 15 aperture) from a FVG analysis of data (Doroshenko et al. 2008). Subtracting our host fluxes from the total fluxes, we obtain the host-subtracted and fluxes and then by power-law interpolation the rest-frame AGN flux . At the distance of 141.8 Mpc, this yields a host-subtracted AGN luminosity . The uncertainty of the AGN luminosity is less than 10%.
The AGN luminosity during our campaign as derived with the FVG method is about 50% higher than the mean value derived with host galaxy modelling by Bentz et al. (2009) for the data of the spectroscopic monitoring campaign (Peterson et al. 1998a). A detailed comparison of the parameters yields that our aperture area ( in diameter) is only 16% larger than that of Peterson’s campaign (), and the band host fluxes agree within the uncertainties as shown in Fig. 11 (extinction corrected: from our data and from the HST/spectroscopic data base). However, the total observed (not extinction corrected) fluxes differ significantly, being for our campaign and lying in the range during Peterson’s eight years campaign, hence are 30% – 70% larger at our campaign. This leads us to conclude that the AGN luminosity is 50% higher during our campaign.
4 Discussion
The tests on PG0003+199 and Ark120 demonstrate the feasibility of photometric reverberation mapping to measure the BLR size. The case of Ark120 demonstrates that the continuum contribution (50%) to the narrow-band NB can successfully be estimated and corrected (H = NB – 0.5 ), while the uncorrected cross correlation (/NB) shows two distinct peaks, one peak from the autocorrelation of the continuum and one peak from the emission line at lag consistent with the literature data. In the case of Ark120, it turns out that the host contribution to the band is 50% and the AGN+host continuum contribution to the NB is about 50%, too. Therefore, due to this coincidence, the scaling factor of 0.5 works well. The general procedure, to recover a pure H light curve, depends on the AGN/host contrast in the filters used and the AGN/line ratio in the NB. Thus, a proper treatment of the relevant filter light curves would be:
-
Remove the constant host emission from the light curves: To this end, estimate the host contribution in each filter, for instance via FVG analysis. Subtract the host contribution from the light curves. Now the (renormalized) light curves measure the AGN continuum and in the NB also the line emission.
-
Extract the line light curve from the NB light curve: To this end, estimate the AGN continuum contribution to the NB, for instance from a spectrum also taking aperture differences into account. Then, using a suitable filter next to the NB, e.g. for H, subtract the AGN continuum light curve from the NB light curve.
This procedure requires good signal/noise data. Applying the procedure on Ark120 for a range of and parameters, we obtained cross correlation results in agreement with those of the straight forward method (H = NB – 0.5 ). This indicates that the lag determination is quite robust against parameter choice to remove the host and AGN continuum. A more detailed simulation of these issues would be interesting, but is beyond the scope of this paper.
We now discuss the accuracies achieved for the two objects, the importance of good time sampling, and the improvement potential for the relationship.
The BLR sizes determined by photometric monitoring agree within a few percent with those from spectroscopic reverberation mapping. The measurement accuracy we derived from the FR/RSS method is 12% for the short light curve of PG0003+199 and 7% for the longer monitored Ark120, while the uncertainty of the black hole mass (35%) is mainly due to the adopted 25% uncertainty of the velocity dispersion from single epoch spectra.
Our measurement accuracy appears exceptionally high compared with typical errors (30%) reported so far from spectroscopic reverberation data. Adopting that the determination of the emission line lag via spectroscopic monitoring is more precise than via photometric monitoring, the difference in the error ranges may be explained by two effects. Firstly, compared to our photometric campaign, most of the available spectroscopic campaigns were performed with lower sampling rate, but over longer time spans. Thus they catch several variability events and implicitly determine an average lag. Then the reported errors include not only the formal measurement errors, but also the possible scatter of the intrinsic lags. On the other hand, a low sampling rate might limit the potential to reach small errors. Then our high measurement accuracy might be favoured by the high sampling rate (median 2 days) of the light curves.
To check the influence of the sampling rate on the errors, we performed the following test. From the entire light curves of Ark120 we created three regular subsets with a median sampling of 4, 8, and 16 days and determined for each subset and its errors using the FR/RSS analysis. It turns out that poorer sampling results in substantially increased errors. Even worse, for the poorest data set (sampled with median 16 days) could not be recovered. The reason is that the two cross correlation peaks seen in Fig. 9 were not anymore separated. Therefore, in order to quantify the error dependence from the sampling, we applied a constraint in FR/RSS analysis. We excluded those values outside the range 30–70 days. This enables us to determine even in the poorly sampled data set. The result of this procedure is shown in Fig. 12. The test confirms that the sampling rate plays a crucial role to achieve small errors. More important, if the continuum contributes significantly to the narrow-band, then photometric reverberation mapping requires well sampled light curves, because otherwise the cross correlation may fail to disentangle the line echo from the autocorrelated continuum contribution.

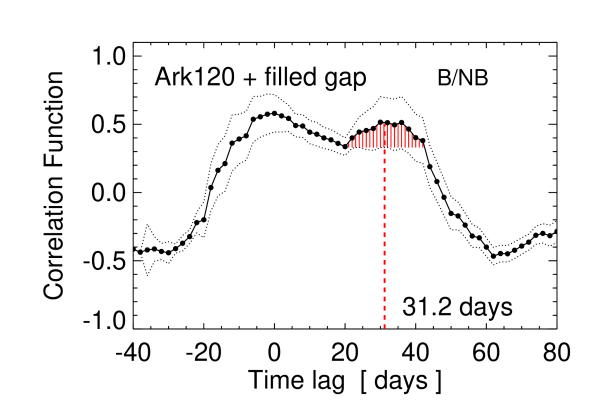
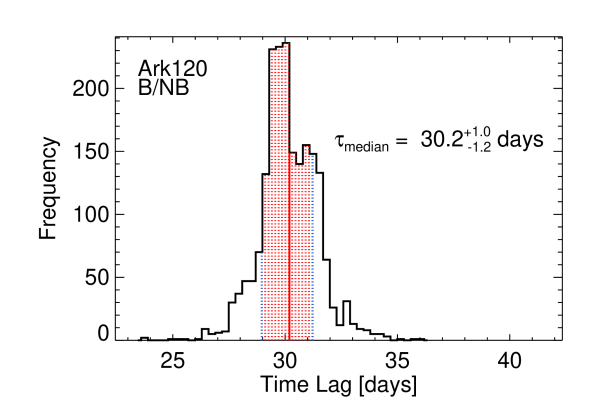
We caution that the formal errors from the FR/RSS analysis do not account for potential systematic errors caused, for instance, by gaps in the observed light curves. We illustrate this with the light curves of Ark120. Despite the dense median sampling of the light curves by 2 days, the light curves of Ark120 have a gap of 18 days in December 2009 (Fig. 8). While the continuum brightening occurred in November, the line brightening, as far as we can see it, is delayed to January 2010, yielding the measured lag of . However, because of the observational gap we do not know whether the line brightening occurred already in December 2009. To test the effect, if there were a strong line echo in December 2009, we took the and NB light curves and filled the gap with the artificial bump in the NB light curve as shown in Fig. 13. The bump may be somewhat strong, but it was chosen to better illustrates the potential effects here. One can see already in the light curves that the lag between the band increase in November and the NB increase in December is about 30 days. The cross correlation of these artificial light curves shows two major peaks, one from the autocorrelated continuum at lag zero and one from the line at lag 31 days (Fig. 14). The FR/RSS analysis yields days. The difference between this lag and days derived from the original light curves is 18 days which is just about the size of the gap. From this example we conclude that in case of a large observational gap one should take a potential systematic error of into account, which is about the size of the gap. In this example the light curve is short in the sense that it covers only one pronounced continnum event and one subsequent line echo. Therefore the missing information during the gap cannot be filled. But in long lasting light curves which cover several variability events one may expect that on average the effective gaps are smaller. These considerations about systematic errors hold for both photometric and spectroscopic reverberation data. Therefore, they do not question the successful applicability of photometric reverberation mapping.
Reverberation mapping, in general, relies on the time resolution, and therefore it is vital that the light curves are sufficiently well sampled. Reminding Nyquist’s Theorem, the sampling rate SR of the feature of interest, i.e. the lag, must be SR = . In the observational practice, data points are lost due to poor weather or technical problems, hence one should aim at SR 3. So far, however, many BLR sizes have been derived from sparsely sampled light curves (SR 3) with a limited potential to reach better than 30% accuracy. It could be that for undersampled data any quoted uncertainties of 30% are too optimistic. For example, the recent spectroscopic reverberation campaign with improved daily sampling on NGC 4051 revealed that its BLR size is actually a factor 3 smaller than inferred from earlier undersampled data (Denney et al. 2009b). Therefore, we suggest that some more of the BLR sizes measured so far can be improved with well sampled reverberation data.
Applying the flux variation gradient (FVG) method to and band data and adopting a host colour range determined for other local AGN, we find that for both objects PG0003+199 and Ark120 the host-subtracted AGN luminosity differs significantly from previous measurements. While for PG0003+199 we find a stronger host contribution leading to 50% lower AGN luminosity, for Ark120 our host estimate is consistent with others but the AGN was in a 50% brighter state during our campaign. The AGN/host luminosity contrast of both objects is relatively low, for the apertures used. The uncertainties of are 9% and 12% in Ark120 and PG0003+199. These uncertainties include the measurement errors, the AGN variations and the uncertainty of the host flux. For , the errors are dominated by the uncertainty of the host flux. It depends on the error of the AGN slope and the range adopted for the host slope. If improved image quality allows us to use smaller photometric apertures containing less host flux, the uncertainty caused by the range of host slopes may be reduced. Also, applying the FVG method to more than one filter pair, for instance from monitoring data, allows one to construct several independent AGN slopes and thus to determine the host contribution in a consistent manner, largely independent of the adopted range of host slopes. For powerful AGN with the uncertainty of the host contribution plays a minor role.
An important result from spectroscopic reverberation mapping is the relationship between the BLR size and the nuclear luminosity with a predicted slope = 0.5 (Netzer 1990; Netzer & Marziani 2010). This relationship allows one to derive the virial black hole mass for high redshift AGN from single epoch spectra by inferring from (e.g. Vestergaard 2002; Netzer 2003, McLure & Dunlop 2004). While early observations indicated (Kaspi et al. 2000, 2005), for H line and 5100 Å luminosity a recent analysis including host galaxy subtraction yields (Bentz et al. 2009). Note that the slope of the current relationship depends on the adopted cosmology, because the more luminous sources are at higher redshift than the low-luminosity AGN.
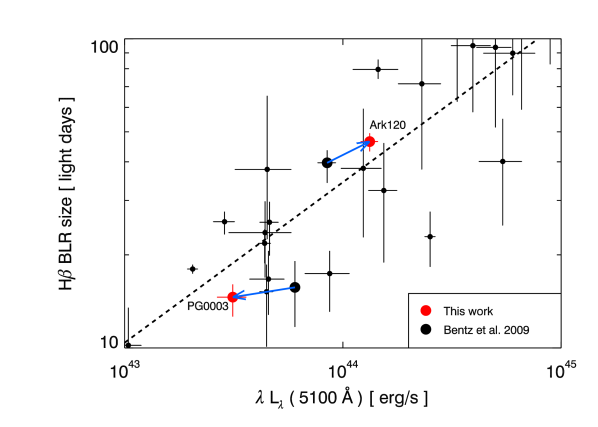
The current relationship exhibits a large scatter over an order of magnitude in both and , and many objects have large error bars (Fig. 15). The new photometric reverberation measurements shift the position of PG0003+199 and Ark120 in this diagram outside the quoted error range of the previous positions. Notably the shift is larger in than in . The new positions are about 50% closer to the relationship fitted by Bentz et al. (dashed line in Fig. 15). This suggests that well sampled reverberation data and improved host-free AGN luminosities may significantly reduce the scatter of the relationship. Certainly, a true scatter may remain, simply because AGN are complicated objects and the determination depends on the continuum variability pattern and the geometry of the BLR which produces the line echo. Future data will show how far the scatter can be reduced.
5 Outlook
While spectroscopic reverberation mapping is the only way to explore the details of the innermost AGN structure and the geometry of the BLR (e.g. Kollatschny 2003a, 2003b; Kollatschny & Zetzl 2010), the advantage of photometric reverberation mapping with suitable filters is to efficiently measure BLR sizes and host-subtracted luminosities for large AGN and quasar samples – even with small telescopes. Photometric broad- and narrow-band monitoring of a sample of 100 quasars () can be performed with 1-m telescopes in an equivalent of 3 years observing time.
In the case of Ark120 the H line contributes to only 50% of the flux in the narrow-bandpass we used. This suggests that photometric reverberation mapping of emission line lags works even for broader bands, as long as the line contributes at least 50% to the bandpass. Also, it is worthwhile to test the method even for weaker emission lines contributing less than 50% to the bandpass. The upcoming Large Synoptic Survey Telescope (LSST) is equipped with six broad band filters and will discover thousands of variable AGN. The H line is shifted into the and bands at and , respectively and may be strong enough, contributing about 50% to these broad bands. While an approximate photometric redshift may be sufficient to determine the filter which contains the H line, it is desirable to take a spectrum of the AGN, in order to measure an accurate redshift, also for luminosity determination, and the line dispersion for black hole mass estimates. In order to determine the H line lag, the neighbouring filters, which are largely free of line emission, may be used to interpolate and remove the continuum variations underneath the H line, in analogy to what we did for Ark120. Recently, an interesting statistical alternative to our method has been proposed by Chelouche & Daniel (2011), which is specifically designed for large samples of AGN light curves expected to be obtained with the LSST. Consider AGN light curves in two bandpasses, curve X (tracing the continuum largely free of emission lines) and curve Y (tracing the emission line with underlying continuum): While our approach aimed to remove the continuum contribution from curve Y by subtracting a scaled X curve, Chelouche & Daniel propose to use the light curves X and Y unchanged, and to subtract the autocorrelation of X from the cross correlation of X and Y, in order to determine the line lag. Numerical simulations with synthetic AGN light curves and the treatment of four archival PG quasar light curves yield lags which are (in three of four cases) consistent with spectroscopic results. However, the reported lag uncertainties of individual AGN are large (50%) and only for averages of large ensembles of several hundred AGN the obtained lags appear satisfying. Future optimisations, combining our approach with that of Chelouche & Daniel, would be intriguing.
Finally we outline a modification of the proposals by Elvis & Karovska (2002) and Horne et al. (2003) to determine quasar distances from reverberation data and thus to probe dark energy. The luminosity difference between the open Einstein – de Sitter cosmology () and the concordance cosmology () is 20%–30% at redshift (Riess et al. 1998). From the relationship we conclude that two quasar samples with the same distribution, one sample at low redshift and one sample at high redshift, should have the same intrinsic distribution. Thus one may constrain the luminosity for different cosmologies by measuring the BLR size and the host-subtracted brightness of quasar samples at different redshift. If for objects matching in the true scatter in can be reduced to about a factor 2 (= 200%), the mean luminosity of 1000 quasars may be determined with a statistical accuracy of 200%/ = 6%, enabling a 3–5 detection of a cosmological 20%–30% luminosity difference.
| Object | Redshift | Date | |||||
|---|---|---|---|---|---|---|---|
| Mpc | mag | mag | mJy | mJy | |||
| PG0003+199 | 0.0258 | 112.6 | Aug. - Nov. 2009 | 14.65 14.84 | 5.69 6.78 | ||
| July 25th, 2010 | 14.92 0.037 | 14.45 0.022 | 5.29 0.18 | 7.07 0.14 | |||
| June 26th, 2011 | 14.78 0.036 | 14.33 0.033 | 6.01 0.20 | 7.93 0.24 | |||
| Aug 17th, 1979 (McAlary et al. 1983) | 13.71 0.029 | 13.56 0.021 | 16.10 0.45 | 16.17 0.31 | |||
| Ark 120 | 0.0327 | 141.8 | Oct. 2009 - March 2010 | 14.11 14.30 | 13.68 13.81 | 13.59 16.20 | 16.89 19.13 |
| 0.036 | 0.048 |
| Object | ext corr | |||||||||
|---|---|---|---|---|---|---|---|---|---|---|
| mJy | mJy | mJy | mJy | mJy | mJy | mJy | ||||
| PG0003+199 | 1.20 | 6.24 | 2.16 | 4.08 | 7.95 | 4.56 | 3.39 | 3.52 | 4.06 | 3.13 |
| 0.04 | 0.31 | 0.29 | 0.43 | 0.31 | 0.30 | 0.40 | 0.41 | 0.47 | 0.36 | |
| Ark 120 | 1.19 | 15.09 | 4.26 | 10.82 | 18.18 | 9.02 | 9.14 | 9.41 | 10.85 | 13.27 |
| 0.06 | 0.73 | 0.59 | 0.94 | 0.57 | 0.62 | 0.84 | 0.86 | 0.99 | 1.21 | |
References
- (1) Bennert, N.; et al., 2006, A&A, 459, 55
- (2) Bentz, M.C.; et al., 2006, ApJ, 651, 775
- (3) Bentz, M.C.; et al., 2009, ApJ, 697, 160
- (4) Bentz, M.C.; et al., 2010, ApJ, 716, 993
- (5) Blandford, R. D.; McKee, C. F., 1982, ApJ, 255, 419
- (6) Chelouche, D., Daniel, E., 2011, arXiv:1105.5312v1
- (7) Cherepashchuk, A. M.; Lyutyi, V. M., 1973, Ap. Letters 13, 165
- (8) Choloniewski, J., 1981, Acta Astronomica, 31, 293
- (9) Denney, K.D.; et al. 2009a, ApJ 692, 246
- (10) Denney, K.D.; et al. 2009b, ApJ 702, 1353
- (11) Doroshenko V.T., Sergeev S.G., Pronik V.I., Chuvaev K.K., 1999, Astronomy Letters 25, 569
- (12) Doroshenko V.T., Sergeev S.G., Pronik V.I., 2008, Astronomy Rep. 52, 167
- (13) Edelson, R. A.; Krolik, J. H., 1988, ApJ, 333, 646
- (14) Elvis, M.; et al. 1994, ApJS 95, 1
- (15) Elvis, M.; Karovska, M., 2002, ApJ Letters, 581, L67
- (16) Horne, K.; Korista, K. T.; Goad, M. R. 2003, MNRAS 339, 367
- (17) Horne, K.; Peterson, B. M.; Collier, S. J.; Netzer, H., 2004, PASP, 116, 465
- (18) Kaspi, S.; et al., 2000, ApJ, 533, 631
- (19) Kaspi, S.; et al., 2005, ApJ, 629, 61
- (20) Kaspi, S.; et al., 2007, ApJ, 659, 997
- (21) Kollatschny, W., 2003a, A&A, 407, 461
- (22) Kollatschny, W., 2003b, A&A, 412, L61
- (23) Kollatschny, W.; Zetzl, M., 2011, Nature, 470, L366
- (24) Koratkar, A.P.; Gaskell, C.M., 1991, ApJS, 75, 719
- (25) Korista, K.T., 1992, ApJS 79, 285
- (26) Landolt, A. U. 2009, AJ 137, 4186
- (27) McAlary, C.W., McLaren, R.A., McGonegal, R.J., 1983, ApJS 52, 341
- (28) McLure, R. J.; Dunlop, J. S., 2004, MNRAS, 352, 1390
- (29) Netzer, H., 1990, in Active Galactic Nuclei, eds. Courvoisier & Mayor, Spinger, p. 57
- (30) Netzer, H., 2003, ApJ, 583, L5
- (31) Netzer, H.; Marziani, P., 2010, ApJ, 724, 318
- (32) Penston, M.V. 1991, in Variability of Active Galactic Nuclei, ed. H.R. Miller & P.J. Wiita(Cambridge: Cambridge University Press), p. 343
- (33) Peterson, B. M.; et al., 1998a, ApJ, 501, 82
- (34) Peterson, B. M.; et al., 1998b, PASP 110, 660
- (35) Peterson, B. M.; et al., 2004, ApJ, 613, 682
- (36) Riess A.G.; et al., 1998, AJ, 116, 1009.
- (37) Sakata Yu, et al., 2010, ApJ 711, 461
- (38) Schlegel, D.J.; Finkbeiner, D.P.; Davis, M., 1998, ApJ 500, 525
- (39) Vestergaard, M., 2002, ApJ, 571, 733
- (40) Wandel, A.; Peterson, B. M.; Malkan, M. A., 1999, ApJ, 526, 579
- (41) Welsh, W.; Horne, K., 1991, ApJ, 379, 586
- (42) Winkler, H., et al. 1992, MNRAS 257, 659
- (43) Winkler, H., 1997, MNRAS 292, 273
- (44) Woo, J.-H.; Treu, T.; Malkan, M.A.; Ferry, M.A.; Misch, T., 2007, Apj 661, 60