119–126
Calibrating hydrogen-rich core-collapse supernovae for their use as distance indicators independently of type Ia supernovae
Abstract
Using our new general-relativistic, radiation hydrodynamics, Lagrangian code, we computed a rather extended grid of hydrogen-rich core-collapse supernova (CC-SN) models and explored the potentials of their “standardization” as distance indicators. We discuss the properties of some calibrations previously reported in the literature and present new correlations based on the behavior of the light curve, that can be employed for calibrating hydrogen-rich CC-SNe using only photometric data.
keywords:
supernovae: general, hydrodynamics, methods: numerical, distance scale1 Introduction
In recent years growing attention has been devoted to the construction of Hubble diagrams using hydrogen-rich CC-SN events (e.g., [Olivares et al. (2010), Olivares et al. 2010] and references therein) in order to derive cosmological parameters independently of the usual method based on type Ia SNe (e.g., [Freedman et al. (2009), Freedman et al. 2009] and references therein). The possibility of building Hubble diagrams for hydrogen-rich CC-SNe is strictly related to the capability of calibrating them and, consequently, to turn them into usable distance indicators. Two different approaches are used to derive distance measurements of CC-SNe. One is based on theoretical spectral modelling like the expanding photosphere method (e.g., [Eastman, Schmidt & Kirshner (1996), Eastman, Schmidt & Kirshner 1996]) or the ensuing spectral expanding atmosphere method (e.g., [Baron et al. (2004), Baron et al. 2004]). Others rely on more empirical techniques as the standardized candle method (e.g., [Hamuy & Pinto (2002), Hamuy & Pinto 2002, HP02]), based on an observational correlation between the luminosity of a SN and its expansion velocity, or the method proposed by [Elmhamdi, Chugai & Danziger (2003), Elmhamdi, Chugai & Danziger (2003, ECD03)], based on the steepness of the light curve. In previous work we studied these correlations using a data/model comparison approach and tried to address their physical origin (e.g., [Zampieri (2005), Zampieri (2007), Zampieri 2005, 2007]). Along this vein, in the following we explore the existence of the correlations inferred from the aforementioned empirical methods in our model sample, which is composed of 22 models calculated with our new general-relativistic, radiation hydrodynamics, Lagrangian code (for details see [Pumo, Zampieri & Turatto (2010), Pumo, Zampieri & Turatto 2010] and [Pumo & Zampieri (2011), Pumo & Zampieri 2011], PZ11).
2 Results and discussion
Our models reproduce the Luminosity-Expansion Velocity (LEV) relation (measured at 50 days from the explosion) with an index equal to 3.13 0.29, in good agreement with the value 3.03 0.37 found in the observational sample of HP02. In order to overcome the difficulty of determining the phase at 50 days, that depends on the determination of the explosion time, we consider a LEV relation where the reference epoch is ti-35 days (left panel in Fig. 1), ti being the time when the semi-logarithmic derivative of the bolometric light curve S = -dlog10L/dt has a local maximum at the end of the plateau phase. Moreover, our models confirm the anti-correlation between the light curve slope at ti and the amounts of 56Ni inferred by ECD03 on observational bases (see also PZ11), and show the existence of a relationship between ti and the bolometric luminosity L30 on the plateau measured at 30 days from the explosion (mid panel in Fig. 1). Furthermore, a preliminary analysis shows a very promising calibration relation between the luminosity L∗ at a generic time t∗ during the plateau and the characteristic time tc=t0.4-t∗, where t0.4 is the time when L∗ decreases by a factor 2.5 (right panel in Fig. 1).
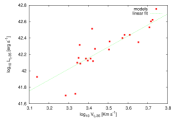
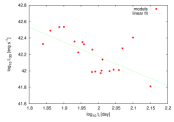
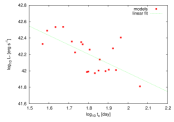
The correlations shown in Fig. 1 represent useful tools for calibrating hydrogen-rich CC-SNe using only photometric data. In particular, for type II plateau SNe, the latter correlation is essentially independent of the explosion epoch (see also PZ11).
While all the correlations reported here were obtained for a rather restricted sample of models, we are working at present to check their validity against a more extended grid of models, as well as against observations that are being collected within the ESO/TNG large program “Supernova Variety and Nucleosynthesis Yields” (PI: S. Benetti).
Acknowledgements.
M.L.P. acknowledges financial support from the Bonino-Pulejo Foundation.References
- [Baron et al. (2004)] Baron, E., Nugent, P. E., Branch, D., Hauschildt, P. H. 2004, ApJ, 616, L91
- [Eastman, Schmidt & Kirshner (1996)] Eastman, R. G., Schmidt, B. P., Kirshner, R. 1996, ApJ, 466, 911
- [Elmhamdi, Chugai & Danziger (2003)] Elmhamdi, A., Chugai, N. N., Danziger, I. J. 2003, A&A, 404, 1077 (ECD03)
- [Freedman et al. (2009)] Freedman, W. L., et al. 2009, ApJ, 704, 1036
- [Hamuy & Pinto (2002)] Hamuy, M., & Pinto, P. A. 2002, ApJ, 566, L63 (HP02)
- [Olivares et al. (2010)] Olivares, E., et al. 2010, ApJ, 715, 833
- [Pumo & Zampieri (2011)] Pumo, M. L., & Zampieri, L. 2011, ApJ, accepted for publication [arXiv:1108.0688v1] (PZ11)
- [Pumo, Zampieri & Turatto (2010)] Pumo, M. L., Zampieri, L., Turatto, M. 2010, MSAIS, 14, 123
- [Zampieri (2005)] Zampieri, L. 2005, ASPC, 342, 358
- [Zampieri (2007)] Zampieri, L. 2007, AIPC, 924, 358