Solar Cycle Variations in the Elemental Abundance of Helium and Fractionation of Iron in the Fast Solar Wind - Indicators of an Evolving Energetic Release of Mass from the Lower Solar Atmosphere
Abstract
We present and discuss the strong correspondence between evolution of the emission length scale in the lower transition region and in situ measurements of the fast solar wind composition during this most recent solar minimum. We combine recent analyses demonstrating the variance in the (supergranular) network emission length scale measured by SOHO (and STEREO) with that of the Helium abundance (from WIND) and the degree of Iron fractionation in the solar wind (from the ACE and Ulysses). The net picture developing is one where a decrease in the Helium abundance and the degree of Iron fractionation (approaching values expected of the photosphere) in the fast wind indicate a significant change in the process loading material into the fast solar wind during the recent solar minimum. This result is compounded by a study of the Helium abundance during the space age using the NASA OMNI database which shows a slowly decaying amount of Helium being driven into the heliosphere over the course of the several solar cycles.
Subject headings:
solar wind — Sun: surface magnetism — Sun: chromosphere — Sun: transition region — Sun: corona — Sun: heliosphere1. Introduction
Decrypting the physical processes encoded in the compositional measurements of the solar wind is akin to the use of DNA analysis of modern forensic science or archaeology to piece together a picture of what happened to whom, by who, when, and where. The streams of particles captured by the compliment of solar wind composition instruments in interplanetary space are a literal treasure trove of physical information about the plasma from the time that it was originally heated in the solar atmosphere, through any interactions it had with other streams en route to the detector. The distribution of ion charge states, densities, speeds, and atomic abundances among other things measured by these instruments form the DNA of the outer solar atmosphere’s energetic processes and provide a significant challenge to our understanding as we are limited, for now, to remote sensing its day to day behavior and subtle evolution over decades.
In this Letter we start an investigation into some of the compositional measurements performed through the long, and unanticipated, activity minimum between solar cycles 23 and 24 where the reduced magnetic activity of the star (e.g., Smith & Balogh 2008; Wang et al. 2009) has allowed us to study the most basic, or basal, of energetic processes occurring in the solar atmosphere and their impact on the heliospheric system (e.g., McComas et al. 2008; Gibson et al. 2009; Solomon et al. 2010; McDonald et al. 2010; Mewaldt et al. 2010). This investigation was motivated by results presented in two recent papers by McIntosh et al. (2011a) and Kasper et al. (2011), where their key results are pictorially combined in Fig. 1.
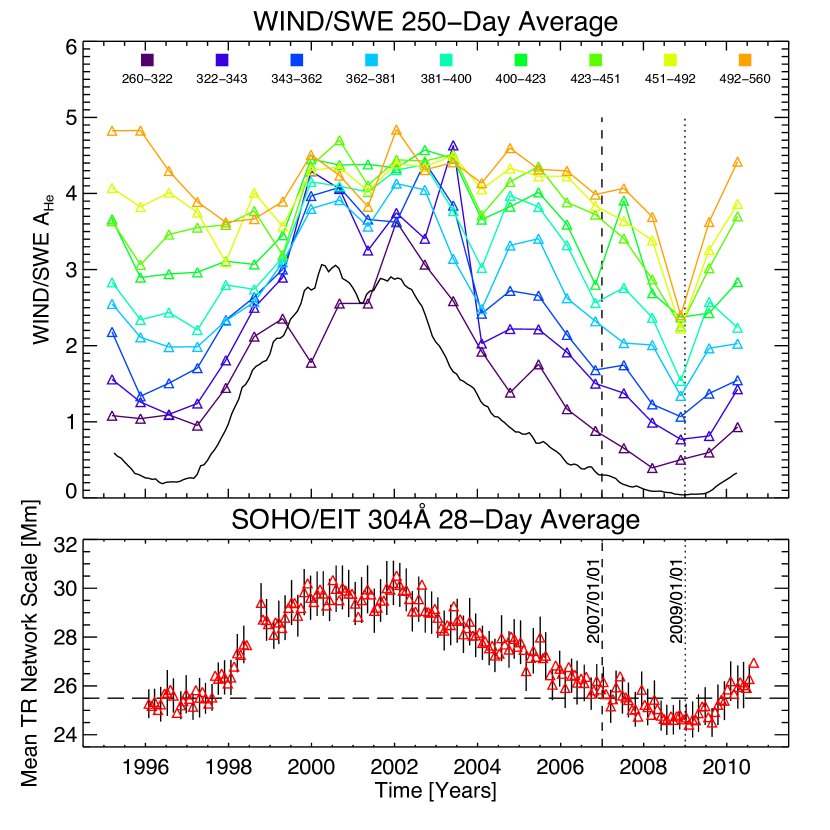
McIntosh et al. (2011a) demonstrated a variance in the dominant scale length of emission in the low transition region (TR), the (supergranular) magnetic network through the cycle 23/24 minimum. It was proposed that the scale length change was driven by the network vertices (and boundaries to a lesser degree) of the TR network emission being more sparsely packed with magnetic flux elements. The magnetic network reflects the scale length over which mass and energy are transported into the quiescent solar atmosphere (quiet sun and coronal hole plasma alike; McIntosh et al. 2007; McIntosh & De Pontieu 2009) and so it was anticipated that a reduction in the network scale, driven by a change in the underlying magnetism, would impact the amount, and possibly the temperature, of material being inserted into the corona and solar wind. During the time that the mean network scale dropped below the 1996 minimum value (indicated on the plot as a horizontal dashed line) Kasper et al. (2011) noted a profound drop in the Helium abundance (; defined as 100 times the ratio of the measured alpha particle and proton densities Aellig, Lazarus & Steinberg 2001) of the fast solar wind measured by the WIND spacecraft below that of the previous solar minimum. Note that the slower wind streams show far more variance with the solar activity cycle as well as showing a drop in Helium abundance between the 1996 and 2009 minima. Yermolaev (1996) identified a similar pattern of Helium abundance variability in solar wind streams with different magnetic (and atmospheric, e.g., coronal hole versus CME, etc) origins using Prognoz 7 observations. However, we choose to focus our thoughts on the fast wind abundance change, motivated by the relatively simplicity of fast wind origins in coronal holes (e.g., McIntosh, Leamon & De Pontieu 2010), and also because its composition was considered to be relatively invariant - invariant to a degree that such a distinct, large amplitude, change is extremely curious.
The remainder of this Letter follows the premise discussed by Parker (1991), and later promoted by McIntosh, Leamon & De Pontieu (2010) and McIntosh et al. (2011b), that the fast solar wind is populated and accelerated by a tandem process. The first of these processes heating the material out of the chromosphere to temperatures above the 1MK (De Pontieu et al. 2011; Martínez-Sykora et al. 2011) necessary for the plasma to have enough thermal pressure to overcome gravity, accompanied by a second process that is able to accelerate the plasma to its final measured speed, e.g., low frequency Alfvén waves (De Pontieu et al. 2007b; McIntosh et al. 2011b). We have observed from Fig. 1 that something has affected the deposition of Helium in the solar wind during the last solar minimum - we presume that the coincident reduction in scale of the magnetic network has resulted in the abundance change observed in the fast solar wind. In the following sections we explore some of the compositional measurements obtained by the SWICS instrument on the Ulysses (Gloeckler et al. 1992) and the SWICS/SWIMS package on ACE (Gloeckler et al. 1998) to explore the composition of the fast solar wind during the recent solar minimum in and out of the ecliptic plane. To complete this preliminary analysis we perform the analysis of Kasper et al. (2011) on the NASA SPDF OMNI solar wind database which provides alpha particle and proton densities back to the early 1970s, three complete solar cycles ago.
2. Compositional Changes
As we mentioned above, the composition of the solar wind likely reflects the physical conditions that the plasma meets from its original removal from the lower solar atmosphere until it finally finds itself on an open magnetic field line and travels outward into the heliosphere. Under our presumption above the fast solar wind composition then reflects the conditions set up by the rapid heating of the plasma from the chromosphere as illustrated recently in joint SDO/Hinode observations De Pontieu et al. (2011). The slow solar wind, on the other hand, experiences some finite (but unknown) period of time in the closed corona of the quiet sun or active regions before being able to escape. Therefore, its composition is likely to be far more complex and variable (Zurbuchen, Fisk, Gloeckler & von Steiger 2002) as the phases of heating, cooling, ionization, and recombination are likely to play a role in setting up the mixture of ions and charge states that are observed in situ (see also the discussion and cartoon presented in De Pontieu et al. 2009). As we have said above, we will focus on the apparently simpler state of the fast solar wind.
In the following subsections we investigate the properties of ionic Iron measured in the fast solar wind by the Ulysses and ACE spacecraft (see, e.g., von Steiger, Zurbuchen & McComas 2010). We consider the degree of Iron fractionation, , which we define as the relative change in the measured Iron to Oxygen ratio (Fe/O) divided by the expected value of that ratio in the photosphere (e.g., the figures of Geiss et al. 1995), or 0.035 (Grevesse et al. 2007).
2.1. Ulysses/SWICS
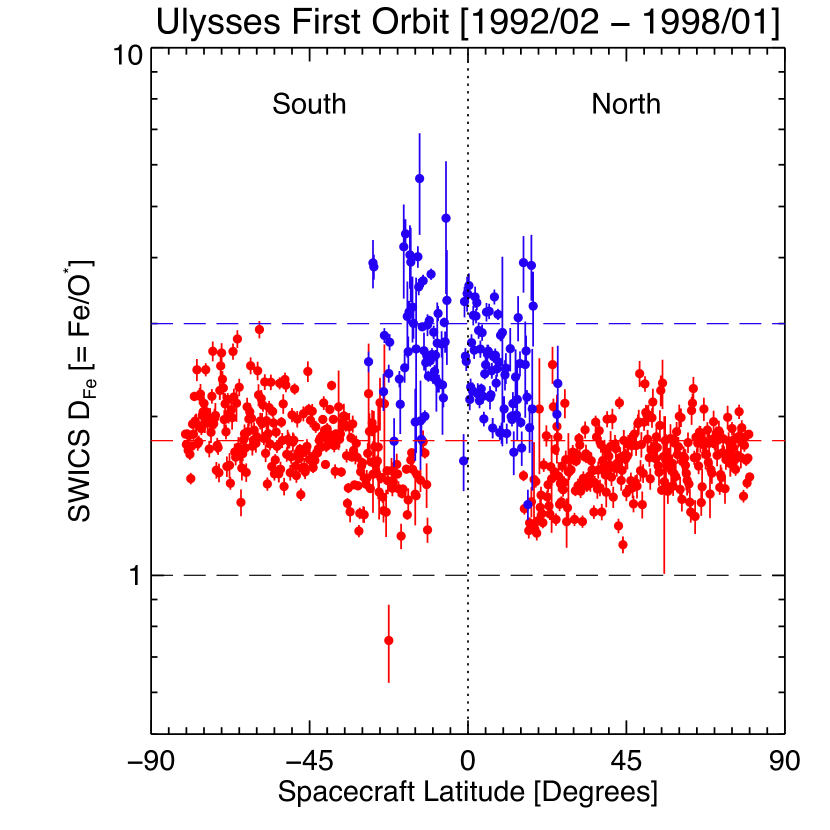
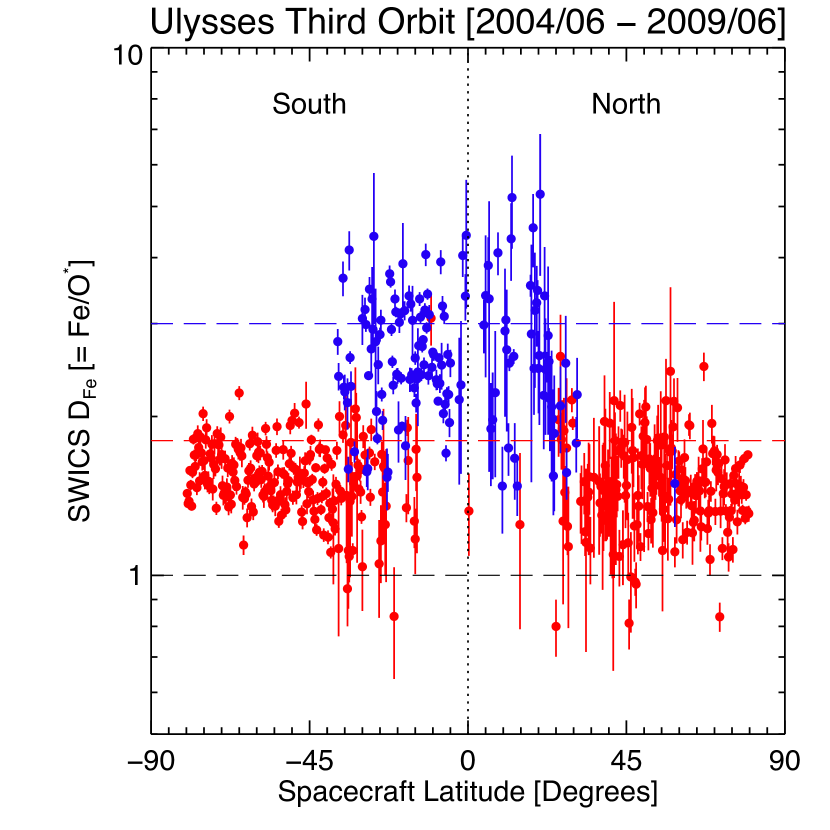
Fig. 2 shows the difference between in the fast and slow solar wind between the two solar “minimum” orbits of Ulysses, its first (left; 1992–1998) and third (right; 2004–2009), as a function of the spacecrafts heliospheric latitude111Orbit one covered the declining phase of cycle 22 and ascent of cycle 23 while orbit three sampled the declining phase of cycle 23 into and through the 2009 minimum.. The points and bars in the plot reflect the mean and standard deviations of averaged over 0.25 degree latitude bins for wind speeds less than 400km/s (slow wind; blue) and greater than 500km/s (fast wind; red). The horizontal dashed lines show values of (black), (red), and (blue). The latter two are representative of typical fast and slow wind degrees of Iron fractionation (see, e.g., Fig. 2 of Geiss et al. 1995). Comparing the left and right panels of the figure we see that the measured values of are systemically lower in the third orbit of Ulysses compared to that of its first.
We have repeated the analyses shown in Fig. 2 using the technique of von Steiger, Zurbuchen & McComas (2010) that discriminates between “fast” and “slow” wind based on charge state ratios rather than speed. However, the results are qualitatively (if not quantitatively) the same as those shown here, and we shall only further discuss solar wind speed as the discriminator.
2.2. ACE/SWICS and Average Iron Charge
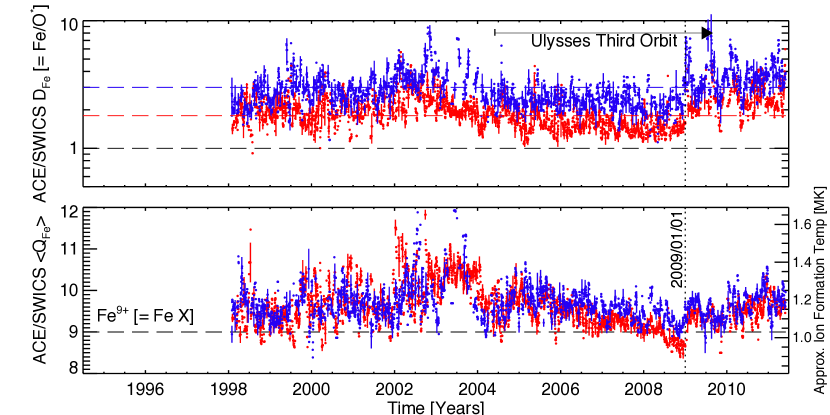
Fig. 3 shows the variation of in the top panel and the average Iron charge state, in the bottom panel over the entire ACE mission - unfortunately ACE did not sample the 1996 minimum, but we will use the observations to look for systematic changes in the declining phase of cycle 23 and the 2009 solar minimum in the ecliptic plane. Isolating the fast and slow wind streams in the same way as above (red for 500km/s; blue for 400km/s) and averaging the measurements of Fe/O (and ) over a day we see the systemic difference between fast and slow wind values of where we have again drawn the dashed lines indicating values of 1, 1.8, and 3. The fast and slow winds show a systematically offset slow decline in in the declining phase of cycle 23, with the latter reaching values of the order 1.3 before rapidly increasing again at the start of 2009. The lower panel of Fig. 3 shows the variance of for fast and slow wind streams through the cycle 23 solar maximum, through the declining phase and into the deep solar minimum of 2009. The values of in the fast and slow wind drop from in 2005 to a value of 8.5 for the fast wind and 9 for the slow wind at the start of 2009 before increasing rapidly. Note the dashed line drawn for Fe9+ (or “Fe X” in spectroscopic notation) and that the right hand scale of the lower panel shows an approximate value for the temperature at which that charge state reaches maximum population, roughly K. So, not only does the value of drop during the 2009 solar minimum to values consistent with the measurements of Ulysses out of the ecliptic plane, but the inferred temperature of the plasma (under equilibrium conditions) appears to be systematically lower into the period where the network scale reached its minimum.
3. Steady Decay Over Many Minima?
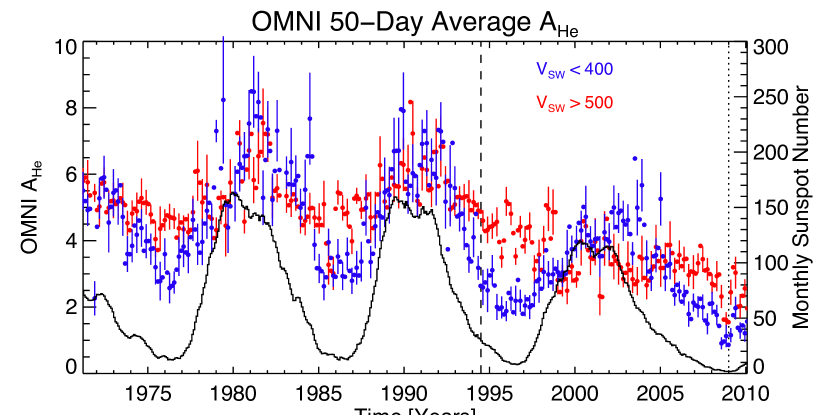
In Fig. 4 we show the results of performing the velocity-discriminating analysis of Kasper et al. (2011) on the NASA SPDF OMNI solar wind database record of the alpha/proton ratio. Separating the fast (500km/s; red) and slow (400km/s; blue) wind streams and performing a 50-day running average we can compare the variation in the solar wind with magnetic activity back to 1970, noting that from 1994 onward many of the measurements come from WIND, like those in Fig 1. Like Fig. 1 there is stronger modulation in in the slow wind, but is still present in the fast wind, which also shows a systematically slower decay in the descending phase of the cycles. Over the entire time period, and particularly from 1980, the values of inferred show a steady decline with the reduction in large scale solar activity. While this plot is striking in its trends and variance, it must be considered carefully as it is a unique single record composed of measurements from many spacecraft and, as such, is dependent on the inter-calibration of those measurements, but since there is no obvious sign of discontinuous jumps in the record over with a range of averaging windows it would appear that the OMNI alpha/proton record is of high internal consistency. The measure of this variance is the continued monitoring of these values in the ecliptic plane into and through the ascending phase of cycle 24.
4. Discussion
We have observed a significant decrease in the Helium abundance in the fast solar wind occur in the just past solar minimum. In addition, we have observed that the degree of Iron fractionation measured by the SWICS instruments on the Ulysses and ACE spacecraft have receded from their typical value of 2 and have approached values nearer unity over the same period in time. The latter spacecraft has also allowed us to investigate the variation in the mean charge state of Iron and a clear, steady drop is seen in the fast wind over the declining phase of solar cycle 23 hitting a minimum value at the start of 2009.
On the Sun at this time, the (supergranular) network length scale reached a minimum. That length scale, mediated by the distribution of the small-scale photospheric magnetic field, dictates the flow of mass and energy into the quiescent solar atmosphere. These observational results are consistent with a situation where the decay in the length scale, driven by the persistent diffusion of the magnetic field to smaller length scales (McIntosh et al. 2011a) has affected the amount of energy supplied to heat the fast wind plasma at its roots, dropping its particle density (e.g., McComas et al. 2008) and mean Iron charge state. The high FIP of Helium almost certainly ensures its strong sensitivity to a small change in the plasma heating present in the quiescent solar network. Further, this is also consistent with the reduced degree of Iron fractionation measured in, and out of, the ecliptic plane at the same time. While the physical process responsible for the “FIP effect” in fast or slow winds is, as yet, undetermined it is clear that the plasma is being less “aggressively” heated at its roots - and so, for the fast wind at least, the plasma heating process in the lower solar atmosphere must play an essential role in establishing the degree of fractionation observed (Geiss et al. 1995). It is likely that the excessive low-FIP element fractionation of the slow solar wind is complicated further by the circulation of heated and cooling material (see the cartoon of De Pontieu et al. 2009) and is far beyond the scope of this Letter in complexity, but an interesting item of further study. Similarly, it is not yet clear how the discrete heating events we discuss here scale in magnitude or number with the complexity (number of small-scale same polarity flux bundles) of the magnetic network vertices, suffice to say that it would appear to play some prominent role in the initial (heating) phase of the mass cycle and is being reflected directly in the particulate emissions of coronal holes than those of the magnetically closed quiet sun and active regions.
The fact that there is still a solar wind at speeds greater than 500km/s is likely further evidence in support of the notion that the fast solar wind is a result of a two stage process, the first to heat the plasma low in the solar atmosphere, combined with a second phase acting away from the solar surface to accelerate the wind to its final measured speed as was speculated by Parker (1991) and more recently revisited by McIntosh, Leamon & De Pontieu (2010) and McIntosh et al. (2011b). This result is accentuated by a study of the Helium abundance during the space age using the NASA OMNI database which clearly shows a slowly decaying amount of Helium being driven into the heliosphere over the course of the several solar cycles indicative of a slowly decaying background magnetic field and resulting reduction in energy heat supply and resulting mass release.
5. Interpretation
We propose that the observed decreases in and the (approaching values expected of the photosphere) in the fast wind indicate a significant change in the process loading material into the fast solar wind during the recent solar minimum. The mean fast solar wind speed shows a small decrease between the two minima (McComas et al. 2008), but the abundance change observed is profound - indicating to us that the amount of energy deposited into the plasma has changed dramatically. We believe that this is justification for our premise that the process heating the fast solar wind plasma and that which subsequently accelerates it into interplanetary space are, at best, loosely coupled (having different length scales of dissipation) even though they are rooted in the (prevalent) network length scale. As we have stated above the mechanism heating the plasma in unipolar flux concentrations such as those forming the network vertices it is still not clear (De Pontieu et al. 2011), we can speculate on why the fast wind , and changed in the last solar minimum, and may be continuing to reduce from minimum to minimum over recent decades.
Based on the primary inference of McIntosh et al. (2011a), the ongoing diffusion of the quiet sun magnetism to smaller length scales reduced the number (and possibly also the strength) of the magnetic elements (e.g., G-Band bright points) in the network vertices. Given that the strongest heating events predominantly occur in the proximity of these unipolar magnetic structures (De Pontieu et al. 2009), it would seem sensible to infer that the heating rate depends critically on the arrangement of the discrete flux elements of the vertex and not only their strength222It is not clear how the heating event frequency and strength scale with the number of flux elements or their strength, but is an important avenue to be tested observationally and numerically (e.g., Martínez-Sykora et al. 2011) in the near future.. Helium, having the highest first ionization potential will feel this (subtle) change in plasma heating most and Iron, given that it is rapidly ionized, will have less time to establish strong fractionation and a lower charge state. Therefore, we believe that that reduced plasma heating strength (and/or frequency) in the lower solar atmosphere - driven by the diffusion of the field - reduced the “complexity” of the network vertices, this modified the plasma heating which then led to the changes in fast solar wind composition. We note that it is a different challenge to identify what is happening to the underlying magnetism at the root of the declining Helium abundance over the past several solar cycles.
References
- Aellig, Lazarus & Steinberg (2001) Aellig, M. R., Lazarus, A. J., & Steinberg, J. T. 2001, Geophys. Res. Lett., 28, 2767
- De Pontieu et al. (2007a) De Pontieu, B., et al. 2007a, PASJ, 59, 655
- De Pontieu et al. (2007b) De Pontieu, B., et al., 2007b, Science, 318, 1574
- De Pontieu et al. (2009) De Pontieu, B., et al. 2009, ApJ, 701, L1
- De Pontieu et al. (2011) De Pontieu, B., et al. 2011, Science, 331, 55
- Geiss et al. (1995) Geiss, J., et al., 1995, Science, 268, 1005
- Gibson et al. (2009) Gibson, S. E., Kozyra, J. U., de Toma, G., Emery, B. A., Onsager, T., & Thompson, B. J. 2009, Journal of Geophysical Research (Space Physics), 114, 9105
- Gloeckler et al. (1992) Gloeckler, G., et al. 1992, A&AS, 92, 267
- Gloeckler et al. (1998) Gloeckler, G. et al., 1998, Space Sci. Rev., 86, 497
- Grevesse et al. (2007) Grevesse, N., Asplund, M., & Sauval, A. J. 2007, Space Sci. Rev., 130, 105
- Kasper et al. (2007) Kasper, J. C., Stevens, M. L., Lazarus, A. J., Steinberg, J. T., & Ogilvie, K. W. 2007, ApJ, 660, 901
- Kasper et al. (2011) Kasper, J. C., et al., 2011, ApJ, “Evolution of the relationships between helium abundance, minor ion charge state, and solar wind speed over the solar cycle” (in press http://xxx)
- Martínez-Sykora et al. (2011) Martínez-Sykora, J., Hansteen, V., & Moreno-Insertis, F. 2011, ApJ, 736, 9
- Mazzotta et al. (1998) Mazzotta, P., et al., 1998, A&ASupp., 133, 403
- McComas et al. (2008) McComas, D. J., Ebert, R. W., Elliott, H. A., Goldstein, B. E., Gosling, J. T., Schwadron, N. A., & Skoug, R. M. 2008, Geophys. Res. Lett., 35, 18103
- McDonald et al. (2010) McDonald, F. B., Webber, W. R., & Reames, D. V. 2010, Geophys. Res. Lett., 37, 18101
- McIntosh et al. (2007) McIntosh, S. W., et al. 2007, ApJ, 654, 650
- McIntosh & De Pontieu (2009) McIntosh, S. W., & De Pontieu, B. 2009, ApJ, 707, 524
- McIntosh, Leamon & De Pontieu (2010) McIntosh, S. W., Leamon, R. J. & De Pontieu, B. 2010, ApJ, 727, 7
- McIntosh et al. (2011a) McIntosh, S. W., Leamon, R. J., Hock, R. A., Rast, M. P., & Ulrich, R. K. 2011a, ApJ, 730, L3
- McIntosh et al. (2011b) McIntosh, S. W., De Pontieu, B., Carlsson, M., Hansteen, V. H., Boerner, P., & Goossens, M., 2011b, Nature, 475, 477
- Mewaldt et al. (2010) Mewaldt, R. A., et al. 2010, ApJ, 723, L1
- Parker (1991) Parker, E. N. 1991, ApJ, 372, 719
- Smith & Balogh (2008) Smith, E. J., & Balogh, A. 2008, Geophys. Res. Lett., 35, 22103
- Solomon et al. (2010) Solomon, S. C., Woods, T. N., Didkovsky, L. V., Emmert, J. T., & Qian, L. 2010, Geophys. Res. Lett., 37, 16103
- von Steiger, Zurbuchen & McComas (2010) von Steiger, R., Zurbuchen, T. H., McComas, D. J. 2010, Geophys. Res. Lett., 37, 22101
- Wang et al. (2009) Wang, Y.-M., Robbrecht, E., & Sheeley, N. R., Jr. 2009, ApJ, 707, 1372
- Yermolaev (1996) Yermolaev, Y. I. 1996, American Institute of Physics Conference Series, 382, 269
- Zurbuchen, Fisk, Gloeckler & von Steiger (2002) Zurbuchen, T. H., Fisk, L. A., Gloeckler, G. & von Steiger, R. 2001, Geophys. Res. Lett., 29, 1352