Anomalous dipion invariant mass distribution of the
decays into and
Dian-Yong Chen1,3Xiang Liu1,2111Corresponding authorxiangliu@lzu.edu.cn1Research Center for Hadron and CSR Physics,
Lanzhou University and Institute of Modern Physics of CAS, Lanzhou 730000, China
2School of Physical Science and Technology, Lanzhou University, Lanzhou 730000, China
3Nuclear Theory Group, Institute of Modern Physics of CAS, Lanzhou 730000, China
Xue-Qian Li
School of Physics, Nankai University, Tianjin 300071,
China
Abstract
To solve the discrepancy between the experimental data on the partial widths and lineshapes of the dipion emission of
and the theoretical predictions, we suggest that there is an additional contribution, which was not taken into account
in previous calculations. Noticing that the mass of is above the production threshold of , the contribution of the sequential process
() may be sizable, and its interference with that from the direct production would be important.
The goal of this work is to investigate if a sum of the two contributions with a relative phase indeed
reproduces the data. Our numerical results on the partial widths and the lineshapes
are satisfactorily consistent with the measurements, thus the role of this mechanism is confirmed. Moreover, with the parameters obtained by fitting the data of the Belle and Babar collaborations,
we predict the distributions , which have not been measured yet.
pacs:
14.40.Pq, 13.20.Gd
The dipion emissions of the bottomonia were observed a long while ago, and as an important channel
to investigate the decay mechanism and inner structure of bottomonia, they have undergone careful studies
from both theoretical and experimental sides. The significance of the transitions stimulated
a series of theoretical efforts Yan:1980uh ; Kuang:1981se ; Zhou:1990ik ; Guo:2006ai ; Simonov:2008qy
(see Refs. Voloshin:1987rp ; Besson:1993mm ; Kuang:2006me for a review). Before joined the game,
the transitions occurring among only the bottomonia and were
below the threshold Nakamura:2010zzi . With being experimentally observed,
the situation becomes more intriguing because the channel is open. It is similar to the case of ,
which is a charmonium with a mass just above the threshold. The CLEO-c Collaboration explored the dipion emission
of , however, only upper limits for and
were obtained Glenn:1998bd . With the data accumulation of the two -factories,
more precise measurement on the dipion emission of became possible.
In recent years, a great progress on measurements of the dipion transitions has been made
Abe:2005bi ; Sokolov:2006sd ; Aubert:2006bm . The Belle Collaboration reported their observation of
Abe:2005bi ; Sokolov:2006sd whose partial
decay width is keV.
The BaBar Collaboration also presented their measurements on decays into and Aubert:2006bm ,
and the partial widths are respectively keV and
keV Aubert:2006bm .
Besides measuring the decay rates of and ,
the Belle and BaBar collaborations also obtained the dipion invariant mass distribution, which is defined as
versus and versus , where is the angle between and in
the rest frame.
As shown in Fig. 3 of Ref. Aubert:2006bm , a comparison between the experimental data
and theoretical prediction Kuang:1981se on the distributions for
and decays was given. The measured distribution for
is close to that predicted in Ref. Kuang:1981se ,
whereas the measured lineshape of the distribution for the
fully deviates from the prediction of the Kuang-Yan model Kuang:1981se . Considering that the model is completely successful in describing
heavy quarkonium transitions , and , one
should conclude that there must be some mechanism, which has not been taken into account in the old calculations.
Moreover, the ratio
was given by the BaBar Collaboration Aubert:2006bm . Generally speaking, the channel possesses a larger
phase space than that of , and it should result in a ratio to be
smaller than unity. As a good example, the rule is well satisfied for as the measured
:2008bv . The experimental value of the ratio for obviously declines from the
rule, which might also imply existence of some uncounted factors. The very recent experimental result on the ratio of is given by the Belle Collaboration as Abe:2007tk ,
which also contradicts to the simple argument. Thus, motivated by these phenomena, one should conjecture that
anomalous production rates and lineshapes of are due to the available open channels Chen:2011qx ; Chen:2011zv .
is obviously different from the lower states. First, the mass of is just above the threshold,
so that the coupled channel effect becomes important. Another feature is that predominantly decays into pair because the mode is
not suppressed by the OZI rule.
Thus, when exploring hidden-bottom decays of , we cannot ignore
the coupled-channel effect, which may play a crucial role in fact.
In general, there exist two mechanisms for the dipion emission
One is a direct process, where two gluons are successively emitted and eventually
hadronized into two pions,
which is depicted in Fig. 1 (a) and can be described by the QCD Multipole Expansion (QME) model Kuang:1981se . Applications of the method
have been discussed in all details, thus
in this letter, we do not repeat the calculation for the direct transition,
but alternatively introduce an effective Lagrangian to take care of this contribution.
The transition amplitude of the direct transition can be written as
(1)
which was suggested by Novikov and Shifman in studying Novikov:1980fa and the subscripts (S-wave) and (D-wave)
denote the S-wave and D-wave contributions respectively. The mass
difference between and is expressed as .
denotes the invariant mass of
, while is the angle between and
in the rest frame. The pion decay constant and mass are taken as MeV and MeV, respectively.
In Eq. (1), and are left as free parameters when fitting the experimental data.
(a)
(b)
Figure 1: The diagrams relevant to hidden-bottom decay with dipion emission.
Here, Fig. 1 (a) represents direct decay into (), while
Fig. 1 (b) denotes the intermediate hadronic loop contribution to .
There also exists another mechanism shown in Fig. 1 (b)
contributing to the transitions,
where the intermediate hadronic loop constructed by and mesons
performs as a bridge to connect the initial state and final state .
This manifests the coupled channel effect, an important non-perturbative QCD effect.
In other words, can be approximately expressed as a sequential
decay process. first transits into and scalar state , then
couples with dipion and the picture is depicted in the right panel of Fig. 1.
For and
processes, are and
respectively, which are of proper quantum numbers and allowed by the phase space of the corresponding modes.
Since the intermediate and mesons can be on-shell, as usually considered, the contribution from the absorptive part
of the loop is larger than the dispersive part, thus let us just keep the imaginary part of the loop. This definitely brings up errors, but
in our strategy, we fit the data to obtain the model parameters, so that part of the uncertainty would be compensated.
By the Cutosky cutting rule, the transition amplitude
corresponding to the absorptive part of the hadronic loop is written as
(2)
where the factor is due to charge conjugation
and isospin transformation
and .
Using the effective Lagrangian approach, we get
and with the monopole
form factor
, where
is the mass of the exchanged meson. The variable
is usually re-parameterized as with MeV. This monopole form
factor is introduced not only to reflect the structure of the
effective vertex for the
scattering process, but also concerns the off-shell effect of the
the exchanged -mesons at the t-channel. The coupling constants
for the is estimated by fitting the partial
decay width and , while for
and , the coupling
constants are directly taken from Ref. Meng:2007tk . In
addition, the coupling constants between the intermediate scalar
meson and the final are
GeV-1 and GeV-1, which are
determined by fitting the corresponding partial widths
Nakamura:2010zzi ; Aitala:2000xu . Finally we parameterized
the whole hadronic loop contribution as a simple and explicit
Lorentz structure presented in the last expression of Eq.
(2), where and ,
corresponding to S-wave and D-wave contribution respectively, are
extracted from the hadronic loop calculation and dependent on the
dipion invariant mass .
With the above preparation illustrated above, the total transition amplitude
of is expressed as
(3)
where the phase is introduced by hand to account for a possible relative phase between the direct transition and
the hadronic loop contributions. As a three-body decay, the
differential decay width for reads as,
(4)
with and . The over-lined bar indicates an average over the polarizations
of in the initial state and sum over the
polarizations of in the final state. The parameters about the concerned resonances are listed in Table. 1.
In our present scenario, we keep four parameters
, , ,
free for and three free parameters
, , for
. So far, there are three
measurements on the dipion invariant mass spectrum of
given by Belle
Abe:2005bi ; Sokolov:2006sd and BaBar Aubert:2006bm
also measured the distribution of
. Our strategy is
following. We have the Belle and BaBar data on the partial widths
of and
, and the measure dipion
distributions of , then using our model
we make a best fit to the lineshapes when keeping the partial
width to be consistent with the measured values. Namely, we will
check whether the Belle Abe:2005bi ; Sokolov:2006sd and
BaBar data Aubert:2006bm can be reproduced by our model.
Our numerical computation is done with the help of the MINUIT
package.
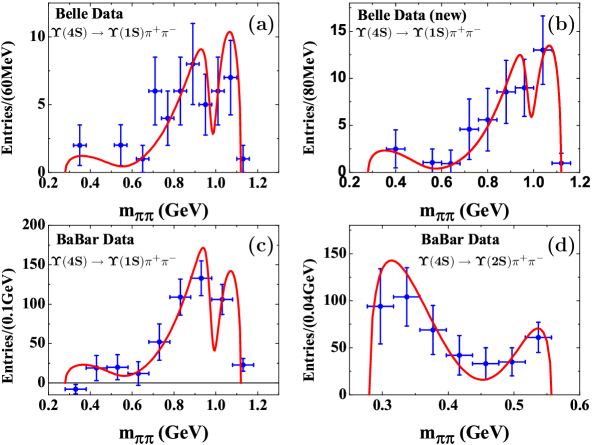
Figure 2: The dipion invariant mass distributions for
and
transitions. Here, the red solid curves
are the best fit to the experimental data (blue points with error
bars) Abe:2005bi ; Sokolov:2006sd ; Aubert:2006bm in our model. Here,
the data points with error bars in (a) and (b) correspond to the measured results given by Belle
in Ref. Abe:2005bi and a published work Sokolov:2006sd , respectively.
As shown in Fig. 2, we carry out the best fit (red solid curves) to the experimental data of
and . The central values along
with the errors of the fitted parameters are listed in Tables. 2 and 3.
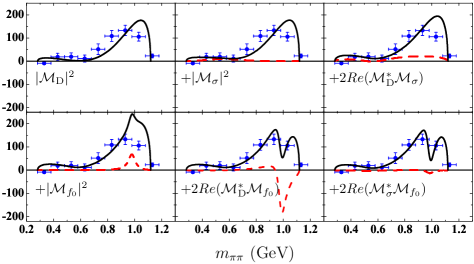
For illustrating how to fit the line shape of step by step, let us provide some details
about the changes of theoretically predicted line shapes (see Fig.
3) of while
considering the interference shown in Eq. (3). Since both
and contribute to Fig. 1 (b),
can be decomposed into six terms
, ,
,
,
and , where we
abbreviate
,
and
.
Figure 3: As an example, we illustrate the changes of the line shape (black solid lines) for fitting the BaBar data (blue dots with error) of Abe:2005bi
by adding the contributions from all the six modulus-square of individual amplitudes
(, ,
,
,
and ) one by one. Here, the red dashed lines
correspond to these modulus-square of the individual amplitudes.
It is noted that for presenting the dipion invariant mass distribution, the experimental
colleagues use a different quantity ”entries/mass”, which
exactly corresponds to the distribution ,
where the different lines correspond to the parameters obtained by fitting different data bases as indicated in the figures.
Thus when we plot the dependence of the partial width over , we
deliberately normalize our numbers for a real comparison with the available data.
Table 2: The values of parameters for the best fit to the experimental
invariant mass distributions of . Here, the
values listed in
the second, third and fourth columns correspond to the best fits shown in diagrams (a), (b) and (c) of Fig. 2,
respectively. The last row lists the partial decay
width for obtained
by using the central values of those parameters.
Belle
Belle (new)
BaBar
(keV)
Table 3: The parameters obtained from the best fit to the dipion
invariant mass distribution of . The last row gives the partial decay
width for obtained in our model.
(keV)
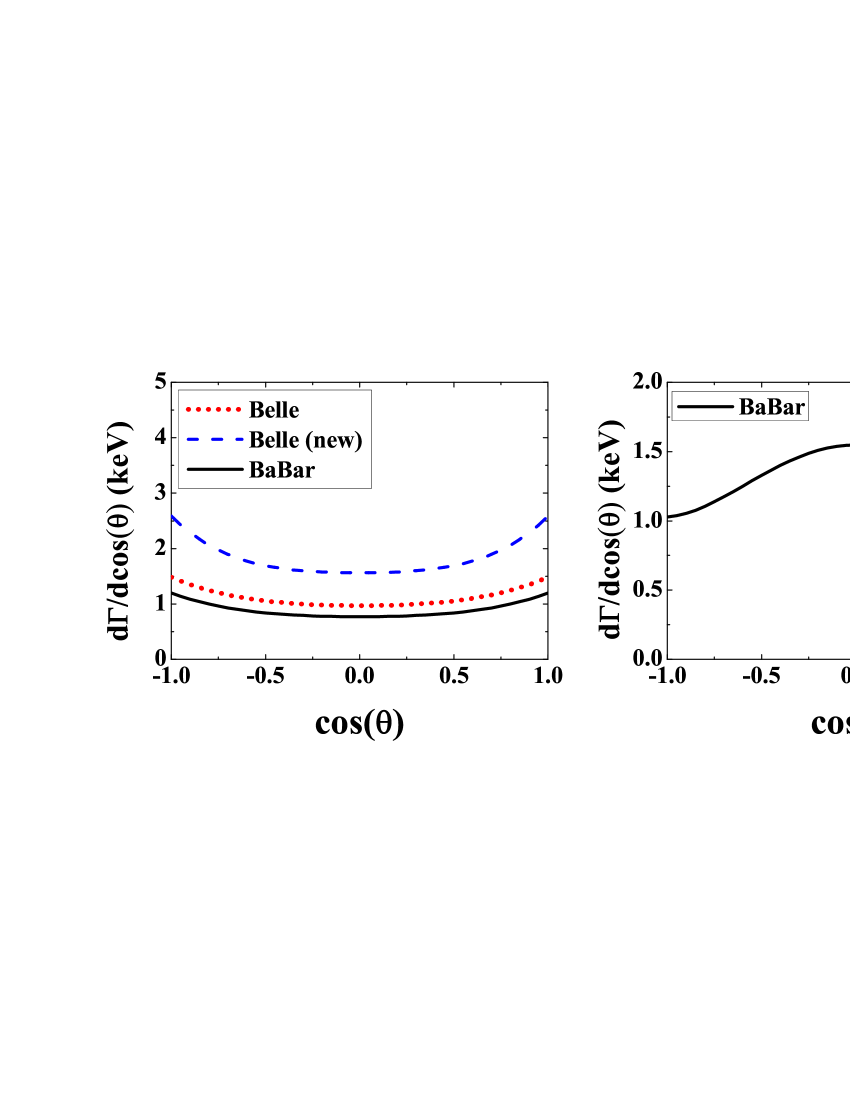
Figure 4: The predicted of (left panel) and
(right panel)
transitions with the obtained values of the fitting parameters listed in Tables. 2-3.
As shown in Fig. 2, the Belle data presented in Ref.
Abe:2005bi indicate that a double-peak structure appears in
the range of GeV, while later measured
results given in Refs. Sokolov:2006sd ; Aubert:2006bm do not
show an obvious double-peak structure. This difference may be caused
by different bin widths of the experimental settings of the Belle
Abe:2005bi ; Sokolov:2006sd and BaBar Aubert:2006bm .
Thus, in this work we separately fit their different experimental
data. Further experimental measurement will test whether there exist
this double-peak structure in the dipion invariant mass spectrum of
.
In addition, we notice that the experimental data of and are quite apart from each other. Our analysis indicates
that considering background and intermediate and
contributions to , both of the experimental data
Abe:2005bi ; Sokolov:2006sd ; Aubert:2006bm can be well met. For
process, there exist
both background and intermediate contribution, and it
is different from the case of . Thus, the interference between background and intermediate
contributions reasonably results in a smooth line
shape of the distribution of the dipion invariant mass spectrum of
.
It is noted that with the parameters obtained by fitting the
lineshapes of the Belle and BaBar collaborations on
for and , we predict
the angular distribution as shown in Fig. 3.
Such distributions have not been measure yet, so that the
prediction will be tested by the further measurement of the Belle
group or even a more accurate measurement at the proposed Super-B
factory.
As aforementioned there are several puzzles for the dipion emission of .
The anomalous ratio of ;
and the lineshapes cannot be explained by
the QCD multipole expansion theory, even though the theory works well for obtaining dipion emission rates of lower states. Noticing the mass
of is just above the production threshold of channel, it is natural to conjecture that on-shell is an intermediate state and the sequential
process may play a crucial role. Namely this sequential process may have a sizable
amplitude and interfere with the direct dipion emission from . The sum of the the two contributions (the two amplitude may have a relative phase,
which is fixed by fitting data in this work) indeed results in a satisfactory explanation to the data. From Fig. (2), one can note that
our model satisfactorily reproduce the lineshapes given by experimental measurements. Moreover, in Fig. (3), our prediction on the angular distribution
will be testified by the further measurements of the Belle-II group and/or maybe, the proposed Super-B factory.
This result confirms our conjecture that the long-distance effect, which can be treated as a final state interaction indeed plays a crucial role. Basically
the direct dipion emission occurs via the OZI suppressed process, whereas, the open-bottom process does not suffer from
the suppression. Thus even though the final state interaction is realized via hadronic loops, its amplitude may be comparable with the OZI suppressed direct dipion
emission, so that the interference is important. For lower , cannot be on-shell, the absorptive part of
the hadronic loop does not exist and the contribution may be negligible.
As a conclusion, the puzzles of the dipion emission of can be satisfactorily removed by taking into account the final state interactions.
Acknowledgement
We would like to thank Feng-Kun Guo for useful discussion. This
project is supported by the National Natural Science Foundation of
China under Grants Nos. 11175073, 11005129, 11035006, 11047606, 11075079,
the Ministry of Education of China (FANEDD under Grant No. 200924,
DPFIHE under Grant No. 20090211120029, NCET, the Fundamental
Research Funds for the Central Universities), and the West
Doctoral Project of Chinese Academy of Sciences.
References
(1)
K. Nakamura et al. [Particle Data Group],
J. Phys. G 37, 075021 (2010).
(2)
T. M. Yan,
Phys. Rev. D 22, 1652 (1980).
(3)
Y. P. Kuang and T. M. Yan,
Phys. Rev. D 24, 2874 (1981).
(4)
H. Y. Zhou and Y. P. Kuang,
Phys. Rev. D 44, 756 (1991).
(5)
F. K. Guo, P. N. Shen, H. C. Chiang and R. G. Ping,
Phys. Lett. B 658, 27 (2007)
[arXiv:hep-ph/0601120].
(6)
Yu. A. Simonov and A. I. Veselov,
Phys. Rev. D 79, 034024 (2009)
[arXiv:0804.4635 [hep-ph]].
(7)
M. B. Voloshin and Yu. M. Zaitsev,
Sov. Phys. Usp. 30, 553 (1987)
[Usp. Fiz. Nauk 152, 361 (1987)].
(8)
D. Besson and T. Skwarnicki,
Ann. Rev. Nucl. Part. Sci. 43, 333 (1993).
(9)
Y. P. Kuang,
Front. Phys. China 1, 19 (2006)
[arXiv:hep-ph/0601044].
(10)
S. Glenn et al. [CLEO Collaboration],
Phys. Rev. D 59, 052003 (1999)
[arXiv:hep-ex/9808008].
(11)
K. Abe et al. [BELLE Collaboration],
arXiv:hep-ex/0512034.
(12)
A. Sokolov et al. [Belle Collaboration],
Phys. Rev. D 75, 071103 (2007)
[arXiv:hep-ex/0611026].
(13)
B. Aubert et al. [BABAR Collaboration],
Phys. Rev. Lett. 96, 232001 (2006)
[arXiv:hep-ex/0604031].
(14)
B. Aubert et al. [BABAR Collaboration],
Phys. Rev. D 78, 112002 (2008)
[arXiv:0807.2014 [hep-ex]].
(15)
K. F. Chen et al. [Belle Collaboration],
Phys. Rev. Lett. 100, 112001 (2008)
[arXiv:0710.2577 [hep-ex]].
(16)
D. Y. Chen, J. He, X. Q. Li and X. Liu,
arXiv:1105.1672 [hep-ph].
(17)
D. Y. Chen, X. Liu and S. L. Zhu,
arXiv:1105.5193 [hep-ph].
(18)
V. A. Novikov and M. A. Shifman,
Z. Phys. C 8, 43 (1981).
(19)
C. Meng and K. T. Chao,
Phys. Rev. D 77, 074003 (2008)
[arXiv:0712.3595 [hep-ph]].
(20)
E. M. Aitala et al. [E791 Collaboration],
Phys. Rev. Lett. 86, 770 (2001)
[arXiv:hep-ex/0007028].