The properties of the brightest Ly emitters at ††thanks: Based on observations obtained at the European Southern Observatory using the ESO Very Large Telescope on Cerro Paranal through ESO programs 275.A-5012, 076.A-0553 and 080.A-0237 and on observations taken with the Spitzer Telescope through GO programs 50308 and 60059
Abstract
We use deep VLT optical and near-IR spectroscopy and deep Spitzer/IRAC imaging to examine the properties of two of the most luminous Ly emitters at . The continuum red-ward of the Ly line is clearly detected in both objects, thus facilitating a relatively accurate measurement (10–20% uncertainties) of the observed rest-frame equivalent widths, which are around for both objects. Through detailed modelling of the profile of the Ly line with a 3-D Monte-Carlo radiative transfer code, we estimate the intrinsic rest-frame equivalent width of Ly and find values that are around 300 , which is at the upper end of the range allowed for very young, moderately metal-poor star-forming galaxies. However, the uncertainties are large and values as high as 700 are permitted by the data. Both Ly emitters are detected at 3.6 m in deep images taken with the Spitzer Space Telescope. We use these measurements, the measurement of the continuum red-ward of Ly and other photometry to constrain the spectral energy distributions of these very luminous Ly emitters and to compare them to three similar Ly emitters from the literature. The contribution from nebular emission is included in our models: excluding it results in significantly higher masses. Four of the five Ly emitters have masses of the order of M⊙ and fairly high specific star-formation rates ( 10–100 Gyr-1). While our two Ly emitters appear similar in terms of the observed Ly rest-frame equivalent width, they are quite distinct from each other in terms of age, mass and star formation history. Evidence for dust is found in all objects, and emission from nebular lines often make a dominant contribution to the rest frame 3.6 m flux. Rich in emission lines, these objects are prime targets for the next generation of extremely large telescopes, JWST and ALMA.
keywords:
galaxies: formation – galaxies:individual (SGP 8884, S11 5236) – galaxies: high-redshift – galaxies: starburst – ISM: general1 Introduction
Characterising the properties of very high redshift star-forming galaxies is important for a number of studies. For example, it is now generally accepted that ionising photons from massive stars in these galaxies led to an important event in the history of the Universe: the reionisation of hydrogen in the intergalactic medium (IGM) (Robertson et al. 2010). With the advent of Wide Field Camera 3 (WFC3) on the Hubble Space Telescope (HST), we are making rapid progress in discovering significant numbers of these galaxies (Bunker et al. 2010; Bouwens et al. 2010; McLure et al. 2010); however, progress on characterising their properties is slower, largely because these galaxies are extremely faint.
Detailed spectroscopic follow-up of most of these objects will need to wait for the upcoming generation of space and ground-based facilities, as the signal-to-noise ratios that are obtainable with current facilities are generally too low (e.g. Capak et al. 2011; Lehnert et al. 2010; Stark et al. 2010). Alternatively, one can study nearer and brighter objects that are expected to be low-redshift analogues of these very high redshift sources (e.g. Izotov et al. 2009), or, as we do in this paper, study the brightest high-redshift examples.
Very high redshift galaxies (defined here as galaxies with redshifts greater than 5) are expected, intrinsically at least, to be powerful emitters in the Ly line (Hayes et al. 2010). However, Ly is a resonance line with a large opacity, so even a small amount of neutral hydrogen modifies the line profile. Just how much and in what way depends on the intrinsic properties of the line and the distribution and kinematics of gas and dust in both the interstellar medium (ISM) attached to the galaxy and the IGM along the line-of-sight. Many high redshift galaxies do indeed emit strongly in the Ly line and are often called Ly emitters or LAEs for short.
Between 2000 and 2002 we undertook a survey to find the brightest LAEs at with the aim of furnishing a sample that could be studied in some detail with the new generation of telescopes that were becoming available at that time. This survey, called WFILAS (Wide Field Imager Lyman Alpha Survey), was conducted with the ESO 2.2m telescope and its Wide Field Imager (WFI), in conjunction with three narrowband filters and one intermediate band filter, all located in a region of low terrestrial background at nm (Westra et al. 2006). The survey covered 0.74 square degrees and furnished 7 LAEs above a flux threshold of erg/s/cm2.
In this paper, we investigate the properties of two of the brightest LAEs from WFILAS survey using deep VLT optical and near-IR spectra and Spitzer/IRAC images. They are among the brightest LAEs currently known at redshift , and are therefore amenable to detailed study with current facilities. In Section 2 of the paper, we describe the VLT and Spitzer observations. In Section 3, we analyse the spectroscopic data, fitting the profile of the Ly line, measuring the continuum and searching for evidence of other emission lines. In Sections 4, we combine the spectra with the IRAC photometry to model the spectral energy distributions. We also reanalyse three other bright LAEs from Lai et al. (2007). In Sections 6, we summarise out main findings. Throughout the paper, all equivalent widths are reported in the rest frame, unless explicitly noted otherwise, and we assume a flat CDM cosmology with and .
2 Target Selection and Observations
With luminosities of , SGP 8884 and S11 5236 from the WFILAS survey of Westra et al. (2006) are among the most luminous LAEs currently known at . From earlier observations (Westra et al. 2005, 2006), the 2 lower limit on the EW was above for both objects, which made them potential Population III galaxies and therefore interesting targets to search for Population III signatures (cf. Schaerer 2002). They are sufficiently bright that they can be observed in some detail with current instrumentation and before the availability of JWST, ALMA and the next generation of extremely large ground-based large telescopes. The properties of these LAEs, taken from Westra et al. (2005, 2006), are summarised in Table.1.
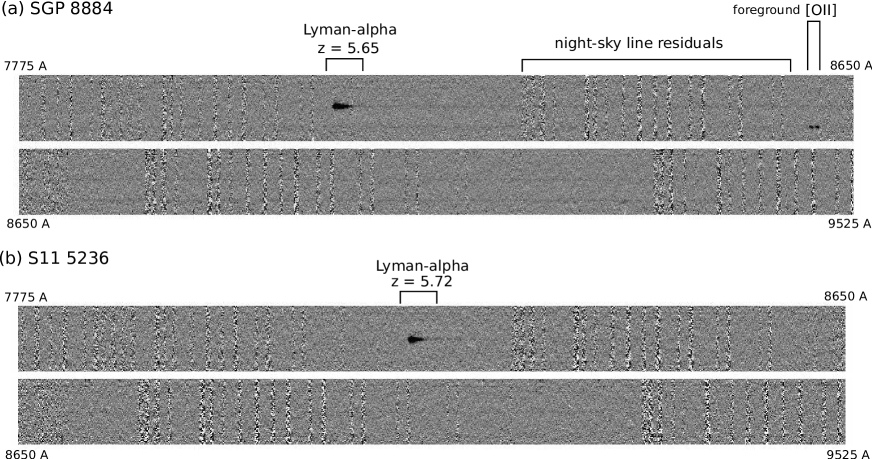
Our observations consisted of deep medium-resolution spectroscopy with FORS2 and SINFONI on the VLT and 3.6 and 5.8 m imaging with IRAC on the Spitzer Space Telescope. The FORS2 spectra cover the rest frame 1180 to 1400 region, which includes Lyman alpha and NV 1240. The SINFONI spectra cover the rest frame 1640 to 2000 region, which includes several lines, such as the CIII] 1907,1909 doublet, and, for S11 5236 only, HeII 1640. At , the [OIII] 4959,5007 doublet and H lie within the passband of the IRAC 3.6 m filter.
| Object | RA | Declination | EW1 | Flux (imaging)2 | Flux (spectroscopy)3 |
| [] | [ erg s-1 cm-2] | [ erg s-1 cm-2] | |||
| SGP 8884 | 00:45:25.38 | -29:24:02.8 | |||
| S11 5236 | 14:43:34.98 | -01:44:33.7 | |||
| Note 1: Initial lower limits from Westra et al. (2005, 2006) | |||||
| Note 2: Narrow band fluxes from Westra et al. (2006) | |||||
| Note 3: Integrated line flux from this paper. Does not include slit losses | |||||
2.1 FORS2 spectroscopy
SGP 8884 and S11 5236 were observed with the multi-object spectroscopic (MOS) mode of FORS2 (Appenzeller et al. 1998) on Antu (VLT-UT1). The MOS mode of FORS2 consists of 19 movable slits that can be used to select targets over a 7′ field. The slit length varies between 20″ and 22″. All data were taken with the FORS2 1028z holographic grating and the OG590 order sorting filter, which has a throughput of almost 80% in the region surrounding 810 nm. The slit width was set to 08. The details of the FORS2 observations are listed in Table 2.
One MOS slit was placed on the LAE. Other slits were placed on a selection of galaxies and stars. The stars were used to monitor the spectral PSF. Individual exposures were of 1370 seconds duration, and two of these were taken in a single observing block (OB). Several of these OBs were executed over the course of several nights to reach the necessary depth. To facilitate the removal of bright sky lines and to reduce the impact of cosmic rays and CCD charge traps, the object was placed in a slightly different part of the slit for each exposure.
The data were reduced in a standard manner using IRAF 111IRAF is distributed by the National Optical Astronomy Observatories which are operated by the Association of Universities for Research in Astronomy, Inc., under the cooperative agreement with the National Science Foundation tasks. The bias was removed by fitting a low order polynomial to the overscan region and pixel-to-pixel variations were removed with lamp flats. The removal of night sky lines, cosmic rays and the co-addition of the 2-dimensional spectra were done using our own software. These sky subtracted and co-added 2-dimensional spectra are shown in Fig. 1. Although the continua are considerably fainter than the Ly emission, they are still visible in the 2-dimensional spectra (Fig. 1). The 1-dimensional spectra of the LAEs were then extracted and calibrated in wavelength and flux.
| Object | Total exposure time | Median seeing |
|---|---|---|
| [s] | [″] | |
| SGP 8884 | 16440 | 0.65 |
| S11 5236 | 43840 | 0.77 |
The signal-to-noise ratio of the Ly line varies from 100 for S11 5236 to 150 SGP 8884. The integrated Ly fluxes are within a factor of two of the fluxes derived from narrow-band imaging (Westra et al. 2006). The details are listed in Table 1. The larger difference for S11 5236 can be attributed to the poorer observing conditions during which the spectra were taken. In the remainder of this paper, we scale the FORS2 spectra so that the Ly fluxes computed from spectroscopy match those derived from narrow-band imaging.
2.2 SINFONI spectroscopy
SGP 8884 and S11 5236 were observed with SINFONI on Yepun (VLT-UT4). SINFONI (Eisenhauer et al. 2003; Bonnet et al. 2004) is a near-infrared integral field spectrograph that has an adaptive optics (AO) module that can be used with natural guide stars or a laser guide star to improve the spatial resolution. The observations were done without AO due to absence of sufficiently close and bright field stars for AO use.
The targets were observed with the 025 objective, which has a field of view of and 0125 025 spaxels, and the grism, which covers the 1095 nm to 1350 nm wavelength range with a resolution of approximately 2000. Each observing block consisted of four 600 second exposures. Between exposures, the telescope was offset by a small amount so that the data could be used to estimate the sky while the object remained within the SINFONI 8″ field of view. The details of the SINFONI observations are listed in Table 3.
The data were reduced following the steps described in Cuby et al. (2007). The spectra were extracted with 1″ apertures that were placed at the locations the objects were expected to be. The spectra and the associated error spectra were calibrated in wavelength and flux.
The continuum of neither object was detected, even after binning the extracted 1d spectra. No emission lines were detected either. However, the SINFONI data allow us to place upper limits on the most likely emission lines that lie in the region covered by the SINFONI data (see Sec. 3.3).
| Object | Total exposure time | Median Seeing |
|---|---|---|
| [s] | [″] | |
| SGP 8884 | 24000 | 0.8 |
| S11 5236 | 9600 | 0.7 |
2.3 IRAC imaging and photometry
SGP 8884 was imaged at 3.6 and 5.8 m with IRAC on the Spitzer Telescope during cycle 5, a period during which the instruments were still being cryogenically cooled. To reach the required sensitivity, the total integration time was set to 36,000 seconds, which was split into 2 AORs222Astronomical Observing Request. Each AOR consisted of 180 100-second exposures. Given the large number of offsets and the characteristics of the target, we chose the cycling dither pattern with a medium scale factor.
S11 5236 was also imaged with IRAC. However, the observations were carried out during cycle 6, when Spitzer had run out of cryogens, so only the 3.6 m data could be taken. The integration time and dither pattern were identical to that used for SGP 8884.
Individual integrations were processed using versions S18.7.0 and S18.18.0 of the basic calibration data pipeline for SGP 8884 and S11 5236, respectively. The processed data were then combined to an image with a final pixel scale of 061, a factor of two finer than the real pixel scale of the IRAC cameras, using version S18.3.1 of the MOPEX mosaicing software.
For SGP 8884, the IRAC 3.6 and 5.8 m images reach 1 point-source sensitivities of 0.03 Jy and 0.32 Jy at the location of the target. The 3.6 m image is shown in Fig. 2 together with a FORS2 image in the 815-13 narrow band filter that was used to define the MOS mask (Sec. 2.1). Both images are centred on SGP 8884. SGP 8884 is undetected in the IRAC 5.8 m image.
For S11 5236, shown in Fig. 3, the 1 point-source sensitivity of the 3.6 m image is 0.08 Jy. Since S11 5236 was observed during the warm mission, there were no 5.8 m data.
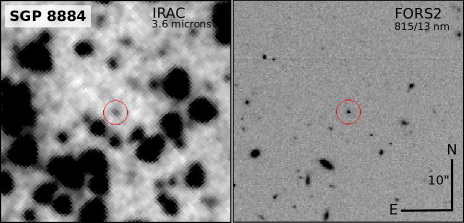
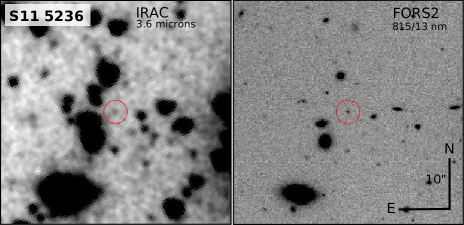
Both SGP 8884 and S11 5236 were selected because they were very bright LAEs and because they lie in relatively uncrowded regions. This is quite important, as the sensitivity of the IRAC 3.6 micron observations is well below the limit at which confusion from overlapping sources becomes a serious issue. The centroids of SGP 8884 in the IRAC [3.6] and FORS2 815-13 images are consistent with each other, suggesting that there is little contamination from other objects that happen to land on the line-of-sight. It also means that, to within the uncertainties in measuring centroids ( kpc at this redshift), the regions responsible for the Ly emission and the 3.6 flux are coincident. On the other hand, for S11 5236, there is an offset of approximately 05 ( kpc) between the two centroids. This may mean that there is a faint object, not seen in the FORS2 image, biasing the centroid in the IRAC 3.6 m image or that the region that is responsible for producing the flux at 3.6 m is offset from the from the region that produces the Ly emission.
Fluxes were measured in 2″radius apertures. The centre of the aperture was determined by the position of LAEs in the FORS2 images relative to sources that were common to and clearly detected in both the FORS2 and IRAC images. The fluxes were then corrected to a larger aperture (radius 4″) using an aperture correction that was determined from relatively bright stars. The fluxes are reported in Table 4.
The flux uncertainties are computed from the uncertainty images produced by MOPEX, which includes only statistical errors. Systematic uncertainties, such as the error that comes from unresolved sources, are not included.
| Object | 0.87 m flux | 3.6 m flux | 5.8 m flux |
|---|---|---|---|
| (Jy) | (Jy) | (Jy) | |
| SGP 8884 | a | ||
| S11 5236 | … | ||
| upper limit |
2.4 Morphologies
Neither SGP 8884 nor S11 5236 are clearly resolved in the FORS2 images that were used to prepare the masks for spectroscopy. The image quality was around 05 in both images, so the Ly emitting regions are smaller than 3 kpc.
However, a field containing S11 5236 was observed with the Advanced Camera for Surveys instrument (ACS) on HST as part of program 10798 (PI Koopmans) with both the F555W filter, where it is not detected, and the F814W filter, where it is clearly is detected. The FWHM of a Gaussian fit to the profile of S11 5236 is 02, which is considerably broader than the PSF and corresponds to physical size 1.2 kpc at the redshift of S11 5236.
Approximately half of the flux in F814W ACS image of S11 5236 comes from the Ly line. The rest comes from the continuum red-ward of the line.
3 Analysis of the Spectral Properties
3.1 Modelling the continuum and deriving the rest-frame EW of Ly
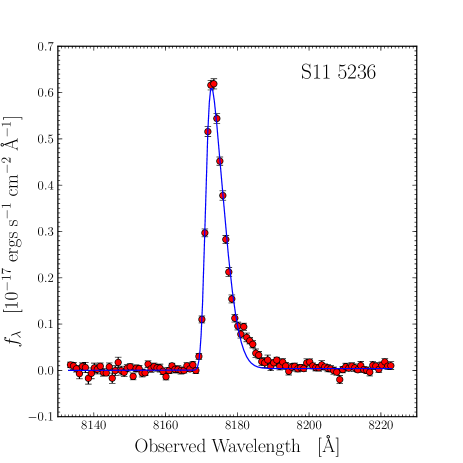
By inspecting the sky subtracted spectra in Fig. 1, it is clear that the continuum red-ward of the Lyman alpha line is detected in both objects. We fit a power law with index to the data red-ward of the line and use the fit to estimate the flux of the continuum at Ly and the observed rest-frame equivalent width (EW) of the line. The wavelength interval of the fit is indicated in column 2 of Table 5. A power law provides an adequate fit to the data, although given the uncertainties, the error in is substantial and allows one to constrain neither the age of the stellar population responsible for the UV emission nor the amount of reddening. Excluding the SINFONI data from the fit does not change the value of significantly.
Blue-ward of Ly, the continuum is clearly suppressed relative to the continuum red-ward of the line. In fact, we do not detect a significant signal in either object. We fit the average level of the continuum on the blue side of the line using all the data within the range indicated in column 6 of Table 5. The mean values for SGP 8884 and S11 5236 are consistent with zero within 2–.
The ratio between the measured continuum between Ly and Ly and the one extrapolated from the continuum red-ward of Ly is often used to measure the fraction of neutral hydrogen in the IGM. The ratio has been well measured for QSOs (Songaila 2004), and at is around a few percent, which corresponds to a neutral fraction of , with some scatter between objects (Fan, Carilli & Keating 2006).
The upper limits for our two LAEs are a factor of five less constraining. If we extrapolate the continuum red-ward of Ly to 1185 (the upper end of the wavelength range used in Songaila (2004)), we find a flux ratio of for SGP 8884 and for S11 5236. While this indicates that the continuum blue-ward of the line is affected by neutral hydrogen in the IGM, it does not show that the line itself is affected. We will return to this issue later in this section.
| Object | Fit interval | Continuum flux at Ly | EW | Fit interval | Continuum flux below Ly | |
| [] | [1e-20 ergs/s/cm2/] | [] | [] | [1e-20 ergs/s/cm2/] | ||
| (1) | (2) | (3) | (4) | (5) | (6) | (7) |
| SGP 8884 | 1222–1797 | 1169-1214 | ||||
| S11 5236 | 1243–1778 | 1147-1214 |
3.2 Ly fitting
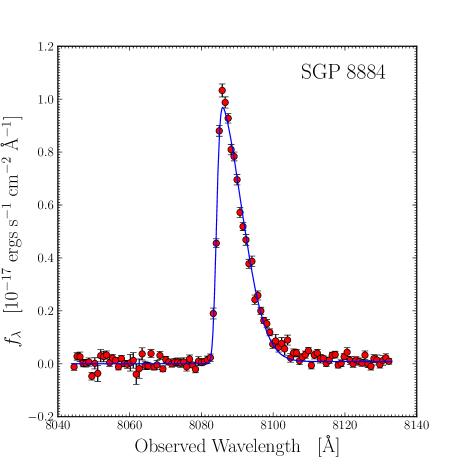
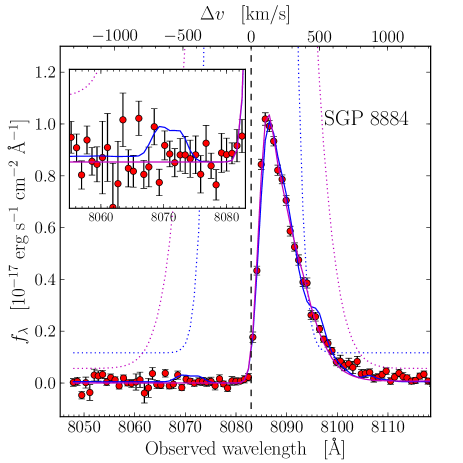
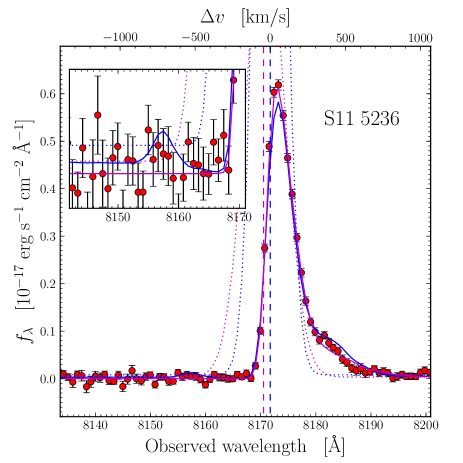
The spectra of both LAEs, centred on Ly, are shown in Fig. 4. Both lines are clearly asymmetric, with steep increases on the blue side of the lines and long red tails. Very likely, the asymmetry is indicative of an expanding ISM (Verhamme, Schaerer, & Maselli 2006). A relatively weak shoulder on the red side Ly line of S11 5236, tentatively identified in Westra et al. (2005), is now clearly visible. We fit the line with a variety of models, first trying analytic models that have been used in the past and then more sophisticated 3-D Monte Carlo radiative transfer models.
3.2.1 Analytic models
Following Dawson et al. (2002); Hu et al. (2004) and Westra et al. (2005, 2006), we fit the profile of the Ly line with a truncated Gaussian that is convolved with the instrument resolution. There are four parameters in the fit: the FWHM and centre of the truncated Gaussian, the instrument resolution, which is itself modelled as a Gaussian, and the overall normalisation. Since the average seeing during the observations was narrower than the width of the slit, the instrument resolution is mostly defined by the seeing. The continuum blue-ward of the line centre is set to zero. Red-ward of the line, the continuum is set to the value determined in Sec. 3.1. The fits are shown in Fig. 4, and the best fit values for the parameters of the model are shown in Table 6. The fits are constrained using the entire wavelength shown in Fig. 4.
On the blue side of the line, the models fit the data very well. The instrument resolution, which is determined during the fit, is around () and agrees with the reported seeing. The blue side of the line is consistent with a vertical cutoff. Ouchi et al. (2010) reported the detection of a “knee” on the blue side of the profile in LAEs at and . Our data have considerably better signal-to-noise and better resolution (). There is no evidence for such a feature in the two LAEs that we observed.
On the red side, however, the models are a poor fit and fail to reproduce the level of detail seen in the data. For S11 5236, the shoulder at is, not surprisingly, completely missed. The fit for SGP 8884 is better; however, there also appears to be excess flux in the red wing of the line around . Such features are characteristic of an expanding dusty ISM (cf. Verhamme et al. 2008). We now move to using a 3-D Monte Carlo radiation transfer code to model escape of Ly photons from the LAEs and to see if we can reproduce the red wing better.
3.2.2 3-D Ly radiation transfer
To model the Ly profiles, we use an updated version of the 3-D Ly radiation transfer code MCLya of Verhamme, Schaerer, & Maselli (2006) described in Schaerer et al. (2011). The code has been used successfully in Verhamme et al. (2008); Schaerer & Verhamme (2008); Dessauges-Zavadsky et al. (2010); Vanzella et al. (2010) to model Lyman break galaxies (LBGs) and LAEs. We follow Verhamme et al. (2008) and fit a simple model to the data. The model consists of a line and continuum emitting region that is surrounded by an expanding, dusty shell of neutral hydrogen. The dust is assumed to be uniformly distributed within the shell. There are seven parameters in the model. In practice we use an automated fitting tool, which synthesises Ly profiles from the extensive library of more than 6000 radiative transfer models of Schaerer et al. (2011) covering a wide range of parameter space. The continuum at Ly is fixed to the value listed in Table 5 as these have been determined over a larger wavelength region than the regions used to fit Ly and is therefore more accurate.
At , it is possible that resonant scattering of Ly photons by neutral hydrogen external to the galaxy – either in the form of nearby Ly forest systems or remnant neutral gas in the IGM – may affect the Ly profile. Stochastic as this is, it provides a Monte Carlo problem all of its own, and one that we do not have the possibility to address on a case-by-case basis. Instead, we adopt two simulations per galaxy, which are designed to bracket a broad range of possibilities: we firstly assume that the IGM does not affect the line333This does not exclude the possibility that the IGM starts to suppress the continuum at some point that is blue-ward of the line., and secondly assume that the IGM absorbs all the flux blue-ward of the line centre. In this second approach the intervention occurs after radiation transport (to maintain the effects of the ISM) but before convolution with the instrumental profile, and thus is somewhat comparable to the method used in Sec. 3.2.1, but with the shape of the red side determined by simulation. We present the results from the first simulation first. The best fit parameters and the resulting escape fractions of Ly photons and the quality of the fits as characterised by the reduced are shown in Table 6. The escape fraction is defined as the fraction of Ly photons that escape the galaxy. It does not include the fraction that are scattered by the IGM.
| Object | Fit Type | FWHM0 | EW0 | |||||||
|---|---|---|---|---|---|---|---|---|---|---|
| [] | [] | [] | ||||||||
| (1) | (2) | (3) | (4) | (5) | (6) | (7) | (8) | (9) | (10) | (11) |
| SGP 8884 | Analytic. | … | … | … | … | … | … | … | 2.1 | |
| SGP 8884 | MCLya | 250 | 19.3 | 3.0 | 80 | 300 | 350 | 0.0232 | 2.71 | |
| SGP 8884+IGM | MCLya | 50 | 16.0 | 2.0 | 40 | 600 | 350 | 0.104 | 1.68 | |
| S11 5236 | Analytic | … | … | … | … | … | … | … | 2.9 | |
| S11 5236 | MCLya | 300 | 18.5 | 1.0 | 80 | 200 | 250 | 0.300 | 2.03 | |
| S11 5236+IGM | MCLya | 400 | 18.0 | 0.2 | 80 | 300 | 350 | 0.819 | 1.01 |
The redshifts are well constrained and we use these values throughout the remainder of the paper. Column densities of neutral hydrogen are determined to be small, just cm-2 and cm-2 for S11 5236 and SGP 8884, respectively. These values are unconstrained at the low end, but at the high end are strongly constrained, with statistical upper error-bars of 0.4 dex. The characteristic features that allow more accurate determination of effective dust optical depth, , do not appear in either of these spectra, so the amount of absorption is poorly constrained, although reasonable lower-limits are obtained for both galaxies: we determine lower limits of for SGP 8884 and for S11 5236 at the 68.3% confidence limit, although the upper limit is unconstrained by our grid, even at the 68.3% confidence limit. For both galaxies the full range is permitted at the 99.7% confidence limit.
The Ly escape fractions are found to be small for SGP 8884 and moderate for S11 5236, taking values of 2.3 and 30%, respectively. For SGP 8884 this value is not tightly constrained and (100%) are permitted at the 68.3% (99.7%) confidence limit. However for S11 5236 is constrained to at the 99.7% confidence level.
The intrinsic rest-frame equivalent widths of the Ly line is 350 for SGP 8884 and 250 for S11 5236, with values as high as 400 and 500 permitted for S11 5236 and SGP 8884, respectively (68.3% confidence). The lower limits just reproduce the measured EWs given in Table 5.
The radiation transfer code (the blue curve in Fig. 5) provides a better fit to the the main features of the Ly line in S11 5236 than the analytic model used in Sec. 3.2.1. In particular, the red shoulder that is seen in S11 5236 is reproduced by the model. Conversely, for SGP 8884, the radiation transfer code provides a poorer fit before the IGM is considered.
For both LAEs, the simulations suggest that at wavelengths short-ward of the Ly line ( -700 to -800 ) the effects of radiation transport on continuum photons become negligible, and thus (modulo the dust extinction law) should behave no differently from photons on the red side of Ly (see Fig. 5). At this scale, i.e. close to the Ly line the model is compatible with the observations.
The second of our simulations assumes that all the transmitted flux blue-ward of the systemic velocity is absorbed by the IGM. Obviously this removes all flux, including the small bumps, on the blue side of the line for both galaxies (magenta line cf. blue line). However, even with the quality of the present spectra it is not possible to distinguish from the observations blue-ward of Ly whether or not the IGM affects directly the Ly line. Both models fit the blue side of the Ly line equally well. In principle, the IGM may also affect the main red peak by giving the impression that the peak itself has shifted red-ward. This effect, anticipated by, for example, Haiman (2002); Santos (2004) and Dijkstra & Wyithe (2010) and noted in Verhamme et al. (2008), appears to be largely mitigated by the fact that the line is already shifted to the red from the multiple scatterings that occur in the ISM.
Quantitatively the quality of the overall line fit is improved for both objects by the addition of the IGM, bringing per degree-of-freedom down to 1.7 and 1.0 for SGP 8884444 For SGP 8884, there is some evidence from the scatter of the data in the continuum regions that the errors have been underestimated by 20–30%. and S11 5326 respectively and more in line with the values that we are looking for in this kind of analysis. The treatment of the IGM has further noticeable effects on the derived parameters that are worthy of discussion. Firstly it substantially reduces the dust optical depth of the ISM in both galaxies, although the formal level of constraint is no better than it was in the case where the IGM was ignored. In the ISM only model, the only way to remove emitted photons from the system is to absorb them by dust. Adding the IGM introduces an additional sink of photons. Thus, when we introduce the step-function IGM, we see higher escape fractions and consequently lower measures of . Indeed the escape fractions have increased substantially, from 2.3 to 10% in SGP 8884 and from 30 to 80% in S11 5326. Interestingly, the best fit intrinsic rest frame EWs are largely unchanged. The 68.3% confidence interval covers a slightly larger range, from 150 to 700.
The column density of neutral hydrogen, , is substantially reduced for both LAEs; however, the 68.3% confidence interval brackets the best fit values of the first simulation. In the case of SGP 8884 the intrinsic FWHM of Ly doubles to 600 km/s; however, the uncertainty in this parameter is large. The 68.3% confidence interval extends down to 250 km/s. Such broad lines have been reported in other LAEs (e.g. Verhamme et al. 2008; Vanzella et al. 2010). They are more commonly observed in AGN; however, we see no evidence for AGN activity in either SGP 8884 or S11 5236. The NV line, which is commonly seen in AGN, was not detected in either LAE. Upper limits on NV are listed in Table 7.
3.2.3 Discussion
Neither of the IGM models used in this paper are likely to represent the average state of the IGM along the line-of-sight to LAEs at . The first model assumes no attenuation of Ly from the IGM. The probability that this occurs for both objects is quite small (Laursen, Sommer-Larsen, & Razoumov 2011). It is worth noting; however, that both LAEs were selected as being the brightest LAEs over a relatively large area of sky, so there will be a bias in selecting LAEs that have more transparent lines of sight than the average. The second model assumes that all photons blue-ward of the systemic redshift are scattered by the IGM. This step function neglects the damping wing of Ly, so the attenuation may extend to longer wavelengths depending on the kinematics of the IGM with respect to the source and the ionization state of the circum-galactic medium (see, for example, Haiman 2002; Santos 2004; Laursen, Sommer-Larsen, & Razoumov 2011).
A more precise treatment of the IGM (as in, for example, Laursen, Sommer-Larsen, & Razoumov 2011) is not warranted with the current data. One clear effect from adopting more accurate IGM models is that some of the fitted parameters would almost certainly change. For example, if the IGM were to absorb flux red-ward of the systemic velocity (as it does in the models of Laursen, Sommer-Larsen, & Razoumov 2011), then the best fit redshift would likely decrease, as it did for S11 5236. Hence, an direct measure of the redshift from other spectral features, such as nebular lines in the near-IR, would be useful, as this would reduce the number of fitted parameters. Unfortunately, our attempts at detecting such lines with SINFONI proved unsuccessful (Sec. 3.3).
Similarly, a measurement of the expansion velocity of the shell from the velocity offset of low-ionisation interstellar lines would reduce the number of parameters further. Our data were not deep enough to see these lines.
3.3 Other emission lines
In addition to Ly, the FORS2 and SINFONI spectra cover a number of lines commonly observed in AGNs and LBGs. These include, NV , CIII] and, for S11 5236 only, HeII . The spectra do not cover the NIV] doublet, which has been seen in some star-forming galaxies (Vanzella et al. 2010). Unlike Ly, these lines are relatively unaffected by the ISM and IGM, and can be used to derive redshifts.
Apart from Ly, we do not detect any line emission in either SGP 8884 or S11 5236. To derive upper limits to the fluxes and to the line ratios with respect to the observed Ly flux, we compute the noise in bins centred at the redshifted wavelengths of these lines using the redshifts derived from the fitting of the Ly line in Section 3.2. In Table 7, we quote 3- upper limits. The sensitivity limits vary strongly between lines because some lines overlap regions of bright telluric emission from OH and , while others are in relatively clear regions.
In addition to listing CIII] and HeII, we provide 3- upper limits for OIII] and NV. CIII], OIII] and HeII were detected in the Lynx arc (Fosbury et al. 2003) and in Q2323-BX418 (Erb et al. 2010), a young, low metallicity, unreddened galaxy at z=2.3, while NV is commonly found in AGNs (Vanden Berk et al. 2001). While both the Lynx arc and Q2323-BX418 are LAEs, they appear to be quite different to the average LAE. In addition to being rich in emission lines, the ionisation parameter for both objects is quite high, .
In Table 7, we list the flux ratios between Ly and HeII, CIII] and OIII] in the Lynx arc. If the properties of SGP 8884 and S11 5236 were similar to the Lynx arc, then both CIII] and OIII] would have been clearly detected in SGP 8884 and marginally detected in S11 5236. In this respect, both SGP 8884 and S11 5236 are different to the Lynx arc and more similar to the average LAE.
In Sec. 4, we fit SED models that include nebular emission lines to the broadband photometry. We can check to see if the upper limits listed for the lines in Table 7 are consistent with the strength of these lines in best fit SEDs. For both S11 5236, where the lines in the SED model are very weak, and for SGP 8884, where the lines are stronger, this is indeed the case.
| Line | S11 5236 | SGP 8884 | Lynx | |
|---|---|---|---|---|
| NV | 1240 | |||
| HeII | 1640 | … | 0.033 | |
| OIII] | 1661 | 0.058 | ||
| OIII] | 1666 | 0.121 | ||
| CIII] | 1907 | 0.113 | ||
| CIII] | 1909 | 0.077 |
4 SED fitting
To gain further insight into the properties of our objects and other LAEs, we have carried out SED fits using the Hyperz code (Bolzonella, Miralles, & Pelló 2000) modified by Schaerer & de Barros (2009) to take into account the effects of nebular emission (lines and continua) on broad band photometry. These effects are expected to be largest for objects with emission lines (as the case for the LAE discussed here) at high redshift, since the contribution of emission lines to photometric bands increases with . The code has already been successfully applied to several samples (see e.g. Schaerer & de Barros 2010; Dessauges-Zavadsky et al. 2011), and the method has also been implemented by other groups and applied to different samples, in particular to LAEs at 2–3 and at 6 (Ono et al. 2010; Acquaviva, Gawiser, & Guaita 2011).
For the SED fits we use the spectral templates of Bruzual & Charlot (2003) to which we add nebular emission as described in Schaerer & de Barros (2009). We consider three metallicities between solar and 1/200 Z⊙, exponentially decreasing star-formation histories () with varying between 10 Myr and (constant star-formation), and variable extinction described by the Calzetti law. We have also considered models with a fixed, constant tar-formation rate (SFR). Non-detections are included in the minimisation by setting the observed flux to zero and taking the upper limit as the error. The SED fits gives the resulting fit parameters, age, stellar extinction , stellar mass M⋆, SFR. The probability distribution function of these parameters (and derived uncertainties) are determined by Monte Carlo simulations, generating a large number (typically 1000 or more) of realisations of the SED. The stellar masses and SFRs quoted here are based on a Salpeter IMF from 0.1 to 150 M⊙. For comparison with a more realistic IMF including the observed turn-over at low stellar masses these values must be corrected downward (e.g. by a factor 1.8 for a Chabrier-type IMF).
4.1 SED modelling of SGP 8884 and S11 5236
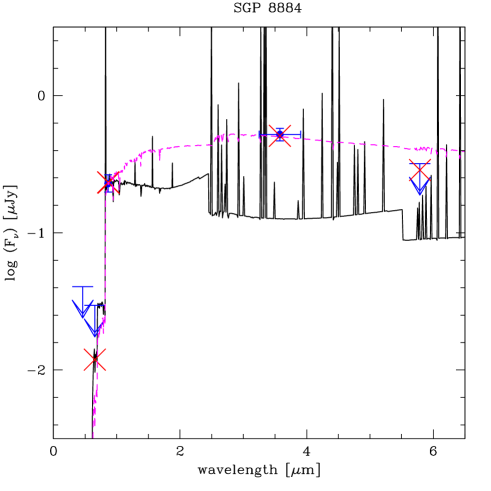
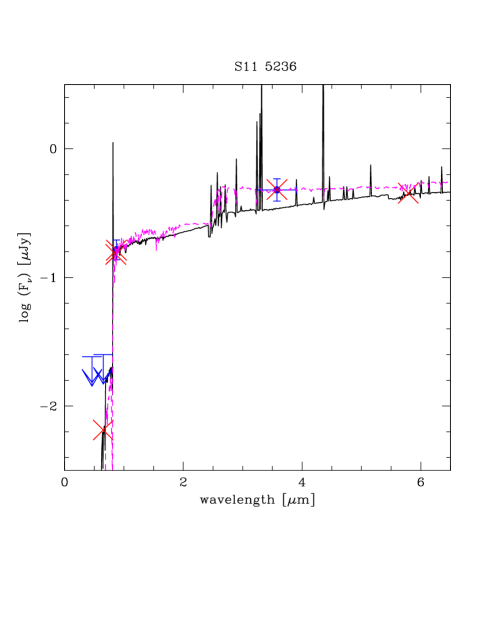
The broadband and spectroscopic measurements of the SED, summarised in Table 4, and the upper limits for the B and R bands from Westra et al. (2006) are used to constrain the SED fits. Given the relatively small number of observational constraints it is not surprising that good SED fits are easily obtained (see Figs. 6 and 7). We do not use the strength of Ly that is derived from the modelling of the line to constrain the fits directly, as the uncertainty in the intrinsic strength of Ly is too large. For S11 5236, however, most models with variable star-formation histories do not predict a strong enough Ly emission. Therefore we have also examined fits imposing a constant SFR.
The main qualitative difference between the two best-fit solutions obtained with templates including nebular emission is obviously the importance of the emission lines in the rest-frame optical, which is predicted to be stronger for SGP 8884 than for S11 5236. The reason is the non-detection at 5.8 m in SGP 8884 with a flux below that at 3.6 m, which drives the solution to a younger age, hence stronger emission lines. For SGP 8884, approximately two-thirds of the 3.6 m flux comes from line emission.
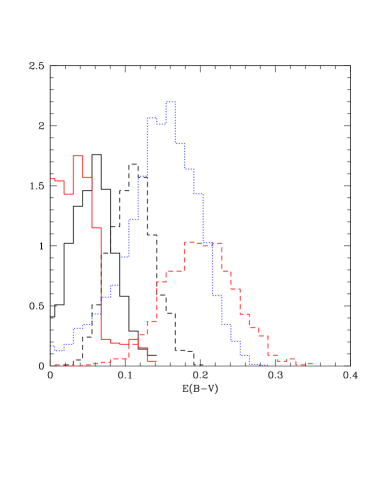
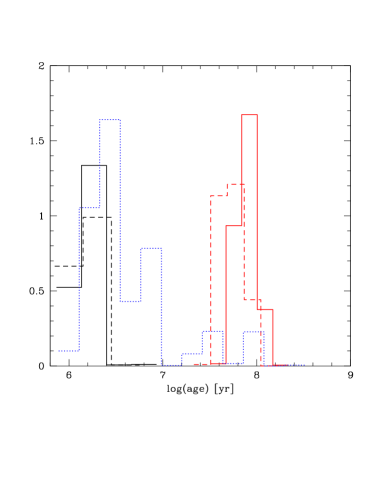
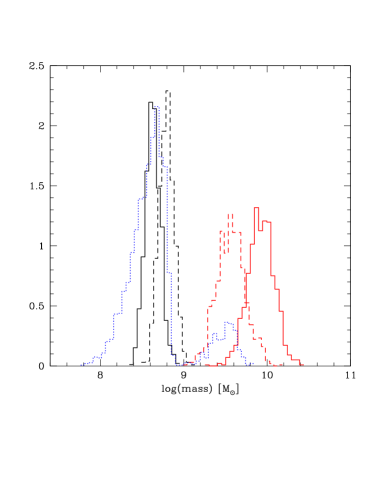
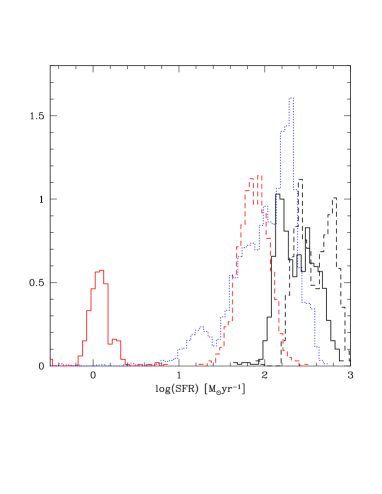
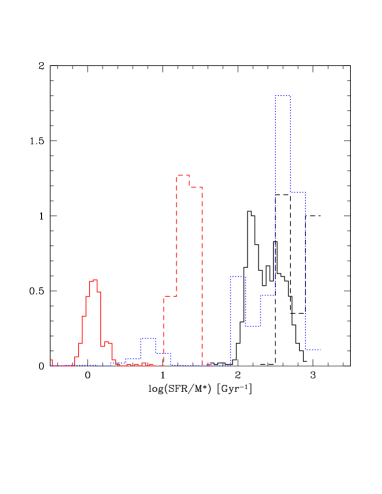
The probability distribution function (pdf) for the age, attenuation, stellar mass, SFR, and specific SFR () for the two objects is shown in Fig. 9 (black and red lines). The effect of imposing a constant SFR is shown by comparing the solid and dashed lines. As can be seen from these figures, the physical parameters of these two objects span a relatively broad range of values. In age and M⋆ the two objects are quite distinct (S11 5236 yielding older ages and a higher masses), reflected by the two separate peaks in the pdfs. For S11 5236 the pdf is skewed toward low current SFR values, as the model favours short star-formation timescales and “old” ages. For these cases, however, only weak Ly emission is expected, in contrast with the observations. Assuming a long star-formation timescale this shortcoming can be avoided; this situation is e.g. illustrated by models with constant SFR (red dashed curves), in which case the SFR and extinction are found to be somewhat larger, and the stellar mass somewhat lower for S11 5236. The fact that short star-formation timescales are favoured (for both objects, but more so for S11 5236) also explains the relatively small overlap between the pdfs computed for variable models (including the case of constant SFR) and the constant SFR case.
For SGP 8884, the relatively high SFR and low mass implies a large specific SFR (sSFR 100 Gyr-1) if taken at face value. In any case, relatively large uncertainties on the physical parameters remain, in particular given the small number of observational constraints.
We now consider for comparison three other LAE for which more photometric constraints are available, and discuss the physical properties of these five LAEs together.
4.2 Comparison with SED modelling of other LAE
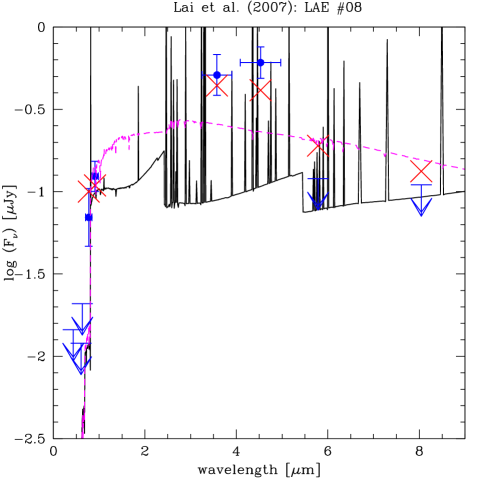
The three LAEs analysed earlier by Lai et al. (2007) are probably still the best comparison sample for our two 2 bright LAEs. These objects were also selected by their narrow-band excess, then spectroscopically confirmed, and finally selected for being detected in the IRAC 3.6 and 4.5 m images. We have taken the published photometry from Lai et al. (2007) and we have reanalysed these objects using the same code and assumptions described above555We have noted that for these objects the pdf of the physical parameters does not change significantly if we allow for variable star-formation histories or assume constant SFR.. As an example, we show the best-fit SED of LAE #08 in Fig. 8. Clearly the effect of nebular emission (both lines and continua) on the best-fit SED are readily visible. For all three objects, fits with nebular emission yield better fits (lower ) than with standard templates.
As already illustrated in Lai et al. (2007) the SEDs of their other objects are very similar, both in relative and absolute fluxes. Therefore it is not surprising to find a simpler probability distribution function for the physical parameters of Lai’s objects (see blue dotted lines in Fig. 9) than the more bimodal pdf for SGP 8884 and S11 5236. We find that the properties of SGP 8884 resemble more the typical values of the LAEs from Lai’s sample, e.g. the SED, age, mass, SFR, and also .
Clearly do we find evidence for non-zero dust attenuation in all 5 high- LAEs, as already found earlier by Lai et al. (2007) for their objects and e.g. by Schaerer & Pelló (2005) for other 6 LAEs. For example, for Lai’s sample we find and for our two objects 0.00–0.11 within 68% confidence.
For the average stellar ages we do find a wide range of acceptable values (see Fig. 9). Overall, relatively young ages ( 50–100 Myr) are however favoured, with a median slightly below 10 Myr for Lai’s sample. Given these relatively young ages, the results from our SED fits are quite insensitive to the exact assumed SF history.
The derived stellar masses also span a relatively large range, typically between few times to few times M⊙, the largest masses being found for S11 5236. For Lai’s sample we find a median stellar mass of M⊙, with 68% confidence limits between 2.2 and 6.2 M⊙. Compared to the analysis of Lai et al. (2007) our masses are significantly lower, by a factor 10 approximately. The difference is due to several effects in the SED fits: primarily the non-inclusion of nebular emission (which dominates the flux at 3.6 m and explains a factor 3–4 difference), and differences in the absolute scaling of the best-fit SEDs resulting from their peculiar treatment of the non-detections in the 5.8 and 8.0 m bands ( factor 2.5). Our masses and other fit parameters should be more reliable as those from Lai et al. (2007) since our models include the effects of nebular emission, which must by selection be particularly strong for LAEs.
The derived pdf for the SFR (Fig. 9, bottom right) shows again a rather large spread. For the objects from Lai et al. (2007) we find SFR= M⊙ yr-1 (68% confidence interval), for our two objects a more complex distribution. The “standard” Ly (UV) calibrations666See e.g. Kennicutt (1998) and Ajiki et al. (2003) for Ly. yield SFR 23–30 (20) M⊙ yr-1 for our two objects, without extinction corrections. Except for the case of variable star-formation history for S11 5236 (cf. above) the (instantaneous) SFR derived from the SED fits are higher due to non-zero extinction and due to ages younger than the timescale ( 100 Myr) assumed for the UV calibration.
Finally it is interesting to note the large specific star-formation rates (sSFR 10-100 Gyr-1) found in general for the objects analysed here, except for the fits using variable star-formation history models for S11 5236. Below we discuss the sSFR values in comparison with other data.
4.3 Comparisons with other data from the literature
The values of the extinction and stellar mass derived for the bulk of the LAEs (except maybe S11 5236) agree well with those found from a larger sample of 6–8 LBGs by Schaerer & de Barros (2010). The specific SFR (SFR) of the LAEs appears, however, somewhat higher than average.
Ono et al. (2010) have constructed the stacked SED of a large sample of LAEs at and 6.5, which are undetected at 3.6 m by IRAC. They have determined the average physical properties from SED fits using models very similar to ours, including also nebular emission. For their sample, showing a median Ly luminosity of erg s-1, they find a low stellar mass (M⋆ M⊙), and no extinction. These differences with our estimates are most naturally explained if on average more massive galaxies suffer from more extinction, as well known from lower redshift (e.g., Buat et al. 2005, 2008; Burgarella et al. 2007; Daddi et al. 2007; Reddy et al. 2006, 2008) and also suggested to hold at the highest redshifts from observations (Schaerer & de Barros 2010) and simulations (Dayal, Ferrara, & Saro 2010). If Ly does not suffer much more strongly from extinction, it may then also be expected, that the brightest Ly emitters at high- are also among the most massive galaxies, at least on average. This is e.g. supported by the recent semi-analytical models of Garel et al. (2011), which use the results from Ly radiation transfer calculations to predict the Ly escape fraction depending on each galaxy’s properties.
We also find that our median value () determined for the LAE sample of Lai et al. (2007) is in very good agreement with the average continuum attenuation predicted for LAEs at by the models of Dayal, Hirashita, & Ferrara (2010). It is also basically identical to that adopted in the cosmological model of Nagamine et al. (2010). However, the above value is larger than a “cosmological average” of the continuum attenuation at estimated by Hayes et al. (2011). Again, this is probably not surprising since our extinction value has been derived from relatively bright Ly emitters, which are also detected in the IRAC bands. How our median values thus relate to other averages is not trivial.
In any case, our analysis of 5 of the brightest LAEs at confirms earlier findings that some of these very redshift galaxies should contain some dust, and hence also be detectable in the infrared/sub-mm domain in the very near future (Schaerer & Pelló 2005; Boone et al. 2007; Lai et al. 2007; Finkelstein et al. 2009; Dayal, Hirashita, & Ferrara 2010; Dayal, Ferrara, & Saro 2010).
Finally, we note that the specific star-formation rate sSFR 10-100 Gyr-1 obtained here for the LAEs is significantly larger than the typical value of 2–3 Gyr-1 found for LBGs by other authors at and at redshifts up to (see e.g. Daddi et al. 2007; Stark et al. 2009; González et al. 2010; McLure et al. 2011). However, some LBGs at (Erb et al. 2006b, c; Yoshikawa et al. 2010; Dessauges-Zavadsky et al. 2011), some LAEs at (Ono et al. 2010), and some LBGs at (Schaerer & de Barros 2010; de Barros et al. 2011) also show comparably high sSFR (and a large scatter) Compared to recent semianalytic and hydrodynamic galaxy formation models a low sSFR 2–3 Gyr-1 constant with redshift above seems problematic (cf. Drory & Alvarez 2008; Nagamine et al. 2010; Bouche et al. 2010; Khochfar et al. 2011; Weinmann et al. 2011). However, the high values indicated here appear larger than predicted by these models, although they generally predict an increase of sSFR with decreasing galaxy mass, which might qualitatively explain why the LAEs analyses here have high sSFR. More in-depth SED studies of well constrained LAEs and LBGs at different redshift and independent measurements of SFR and mass will be needed to clarify these issues further.
4.4 Dust extinction
The modelling of the SED and the modelling of the Ly line provide independent estimates of the amount of absorption from dust. While the allowed values from the modelling of the Ly line are relatively unconstrained, the estimates of the amount of absorption derived in this way are generally different to the estimates derived from the modelling of the SED. In particular, the estimate of the amount of dust absorption in SGP 8884 is a factor of 2 to 3 higher than that obtained from the SED fit. The difference has been noted in other LAEs (Verhamme et al. 2008; Vanzella et al. 2010) and may be related to the difference that has been seen local star-forming galaxies (Calzetti 2001), since one measure is based on the fit to Ly, which is entirely nebular emission, and the other is based on the fit to the SED, which is mixture of stellar light, nebular emission and nebular continuum. Alternatively, this apparent difference may also be related to the simplified model assumptions in the radiation transfer code (e.g. simplified geometry) or in the SED fits.
The Ly fits to both SGP 8884 and S11 5236 also result in unusually low gas-to-extinction ratios, with values around for the models that exclude the effects of the IGM. Compared to the mean ratio in the Galaxy, , (Bohlin, Savage, & Drake 1978) the gas-to-extinction ratios in SGP 8884 and S11 5236 are about 100 times lower. The values are also lower than those estimated for other LAEs (Verhamme et al. 2008; Vanzella et al. 2010). However, the range allowed by the fits is also large. For example, the 68.3% confidence interval on the extinction allows values as high for SGP 8884, which is still lower than that measured in the Galaxy, but similar to the values estimated for other LAEs. As already mentioned, it remains open whether these results can be taken at face value or whether they are due to simplifying assumptions in our model of modelling of the Ly line.
5 Summary
We obtained deep optical and near-IR spectra and Spitzer IR imaging of two of the most luminous LAEs known at and we use these data to constrain the properties of these galaxies.
The continuum red-ward of Ly is clearly detected in both objects, allowing us to derive reasonably precise estimates of the rest-frame equivalent widths. For both objects we find equivalent widths that are around with uncertainties of 10 and 20% for SGP 8884 and S11 5236, respectively.
We used an analytic model and a 3-D Monte Carlo radiation transfer code with two treatments for how the IGM affects the line to model the line profile. All models, accurately model the blue edge of the line and the continuum out to velocities of 1000 blue-ward of Ly. At a resolution of and with the present S/N, we cannot distinguish the three models. Consequently, from the blue side of the Ly line we do not find observational proof that Ly of our two LAE is affected by the IGM at these redshifts, although the continuum is found to be depressed over a larger wavelength range blue-ward of Ly.
However, neither the analytic model nor the model that excludes the IGM from affecting the line profile adequately model the red wing of the line in either LAE. Only the radiation transfer model that includes a simple prescription for how the IGM affects the line adequately models the red wing in both LAEs. While this may be used as evidence to support the idea that Ly is being affected by the IGM at these redshifts, it is not yet conclusive, as the distribution of dust and neutral hydrogen in the ISM in these LAEs is likely to be more complex than assumed in the models used here.
The radiation transfer models predict that the intrinsic equivalent width is about double the observed one, about 300 which is at the upper end of the range allowed for a young, moderately metal-poor star-forming galaxy. This is independent of how we have treated the IGM. However, uncertainties are currently large and values as high as 700 , which in the realm expected for a Population III burst, are allowed.
Both LAEs were observed and detected with IRAC on the Spitzer Space Telescope. We combined the IRAC photometry with a measurement of the continuum at 1300 and ground based data to constrain the SED of these two objects and compared them to 3 other LAEs at from the literature (Lai et al. 2007). The SEDs of these 5 LAEs have been analysed with state-of-the-art SED models including the effects of nebular emission (cf. Schaerer & de Barros 2009, 2010). In terms of age and mass, our two LAEs are quite distinct from each-other. S11 5236 appears older and more massive than SGP 8884. Four of the five LAEs analysed here show masses of the order of M⊙, lower than previous estimates of Lai et al. We find evidence for the presence of some dust in all objects, and indications for fairly high specific star-formation rates ( 10–100 Gyr-1).
Nebular line emission, principally from [OIII] 4959,5007 doublet and H, makes a significant contribution to the flux in the IRAC 3.6 m filter. For SGP 8884 and the three objects in Lai et al. (2007), it dominates. Dusty, and rich in emission lines, these objects will be prime targets for the next generation of extremely large telescopes, JWST and ALMA.
Acknowledgements
C. Lidman wishes to acknowledge the support of the Oskar Klein Centre at the University of Stockholm and the support of the Australian Research Council (ARC) through the ARC Future Fellowship. DS and MH acknowledge support from the Swiss National Science Foundation.
References
- Ajiki et al. (2003) Ajiki M., et al., 2003, AJ, 126, 2091
- Appenzeller et al. (1998) Appenzeller I., et al., 1998, Msngr, 94, 1
- Acquaviva, Gawiser, & Guaita (2011) Acquaviva V., Gawiser E., Guaita L., 2011, arXiv, arXiv:1101.2215
- Bohlin, Savage, & Drake (1978) Bohlin R. C., Savage B. D., Drake J. F., 1978, ApJ, 224, 132
- Bolzonella, Miralles, & Pelló (2000) Bolzonella M., Miralles J.-M., Pelló R., 2000, A&A, 363, 476
- Bonnet et al. (2004) Bonnet H., et al., 2004, Msngr, 117, 17
- Boone et al. (2007) Boone F., Schaerer D., Pelló R., Combes F., Egami E., 2007, A&A, 475, 513
- Bouwens et al. (2010) Bouwens R. J., et al., 2010, ApJ, 709, L133
- Bouche et al. (2010) Bouche, N.; Dekel, A.; Genzel, R.; Genel, S.; Cresci, G.; F rster Schreiber, N. M.; Shapiro, K. L.; Davies, R. I.; Tacconi, L., 2010, ApJ, 718, 1001
- Bruzual & Charlot (2003) Bruzual G., Charlot S., 2003, MNRAS, 344, 1000
- Buat et al. (2005) Buat V., et al., 2005, ApJ, 619, L51
- Buat et al. (2008) Buat V., et al., 2008, A&A, 483, 107
- Burgarella et al. (2007) Burgarella D., Le Floc’h E., Takeuchi T. T., Huang J. S., Buat V., Rieke G. H., Tyler K. D., 2007, MNRAS, 380, 986
- Bunker et al. (2010) Bunker A. J., et al., 2010, MNRAS, 409, 855
- Calzetti (2001) Calzetti D., 2001, PASP, 113, 1449
- Capak et al. (2011) Capak P., et al., 2011, ApJ, 730, 68
- Cuby et al. (2007) Cuby J.-G., Hibon P., Lidman C., Le Fèvre O., Gilmozzi R., Moorwood A., van der Werf P., 2007, A&A, 461, 911
- Daddi et al. (2007) Daddi E., et al., 2007, ApJ, 670, 156
- Dawson et al. (2002) Dawson S., Spinrad H., Stern D., Dey A., van Breugel W., de Vries W., Reuland M., 2002, ApJ, 570, 92
- Dayal, Hirashita, & Ferrara (2010) Dayal P., Hirashita H., Ferrara A., 2010, MNRAS, 403, 620
- Dayal, Ferrara, & Saro (2010) Dayal P., Ferrara A., Saro A., 2010, MNRAS, 402, 1449
- de Barros et al. (2011) de Barros S., Schaerer D., Stark, D., 2011, A&A, in preparation
- Dessauges-Zavadsky et al. (2010) Dessauges-Zavadsky M., D’Odorico S., Schaerer D., Modigliani A., Tapken C., Vernet J., 2010, A&A, 510, A26
- Dessauges-Zavadsky et al. (2011) Dessauges-Zavadsky M., Christensen, L., D’Odorico S., Schaerer D., Richard, J., 2011, A&A, submitted
- Dijkstra & Wyithe (2010) Dijkstra M., Wyithe J. S. B., 2010, MNRAS, 408, 352
- Drory & Alvarez (2008) Drory, N., Alvarez, M., 2008, ApJ, 680, 41
- Eisenhauer et al. (2003) Eisenhauer F., et al., 2003, SPIE, 4841, 1548
- Erb et al. (2006b) Erb, D. K., Steidel, C. C., Shapley, A. E., Pettini, M., Reddy, N. A., & Adelberger, K. L. 2006b, ApJ, 646, 107
- Erb et al. (2006c) Erb, D. K., Steidel, C. C., Shapley, A. E., Pettini, M., Reddy, N. A., & Adelberger, K. L. 2006c, ApJ, 647, 128
- Erb et al. (2010) Erb D. K., Pettini M., Shapley A. E., Steidel C. C., Law D. R., Reddy N. A., 2010, ApJ, 719, 1168
- Fan, Carilli & Keating (2006) Fan, X., Carilli, C. L., Keating, B. 2006, ARAA, 44, 415
- Finkelstein et al. (2009) Finkelstein S. L., Malhotra S., Rhoads J. E., Hathi N. P., Pirzkal N., 2009, MNRAS, 393, 1174
- Fosbury et al. (2003) Fosbury R. A. E., et al., 2003, ApJ, 596, 797
- González et al. (2010) González, V., Labbe, I., Bouwens, R.J., Illingworth, G., Franx, M., Kriek, M., Brammer, G.B., 2010, ApJ, 713, 115
- Garel et al. (2011) Garel, T., Blaizot, J., Guiderdoni, B., Schaerer, D., Verhamme, A., Hayes, M. 2011, MNRAS, submitted
- Haiman (2002) Haiman Z., 2002, ApJ, 576, L1
- Hayes et al. (2010) Hayes M., et al., 2010, Natur, 464, 562
- Hayes et al. (2011) Hayes M., Schaerer D., Östlin G., Mas-Hesse J. M., Atek H., Kunth D., 2011, ApJ, 730, 8
- Hu et al. (2004) Hu E. M., Cowie L. L., Capak P., McMahon R. G., Hayashino T., Komiyama Y., 2004, AJ, 127, 563
- Izotov et al. (2009) Izotov Y. I., Guseva N. G., Fricke K. J., Papaderos P., 2009, A&A, 503, 61
- Kennicutt (1998) Kennicutt R. C., Jr., 1998, ARA&A, 36, 189
- Khochfar et al. (2011) Khochfar, S., Silk, J., 2011, MNRAS, 410, L42
- Lai et al. (2007) Lai K., Huang J.-S., Fazio G., Cowie L. L., Hu E. M., Kakazu Y., 2007, ApJ, 655, 704
- Laursen, Sommer-Larsen, & Razoumov (2011) Laursen P., Sommer-Larsen J., Razoumov A. O., 2011, ApJ, 728, 52
- Lehnert et al. (2010) Lehnert M. D., et al., 2010, Natur, 467, 940
- McLure et al. (2010) McLure R. J., Dunlop J. S., Cirasuolo M., Koekemoer A. M., Sabbi E., Stark D. P., Targett T. A., Ellis R. S., 2010, MNRAS, 403, 960
- McLure et al. (2011) McLure, R. J.; Dunlop, J. S.; de Ravel, L.; Cirasuolo, M.; Ellis, R. S.; Schenker, M.; Robertson, B. E.; Koekemoer, A. M.; Stark, D. P.; Bowler, R. A. A., 2011, MNRAS, submitted (arXiv1102.4881)
- Nagamine et al. (2010) Nagamine K., Ouchi M., Springel V., Hernquist L., 2010, PASJ, 62, 1455
- Ono et al. (2010) Ono Y., Ouchi M., Shimasaku K., Dunlop J., Farrah D., McLure R., Okamura S., 2010, ApJ, 724, 1524
- Ota et al. (2008) Ota K., et al., 2008, ApJ, 677, 12
- Ouchi et al. (2010) Ouchi M., et al., 2010, ApJ, 723, 869
- Reddy et al. (2006) Reddy N. A., Steidel C. C., Fadda D., Yan L., Pettini M., Shapley A. E., Erb D. K., Adelberger K. L., 2006, ApJ, 644, 792
- Reddy et al. (2008) Reddy N. A., Steidel C. C., Pettini M., Adelberger K. L., Shapley A. E., Erb D. K., Dickinson M., 2008, ApJS, 175, 48
- Robertson et al. (2010) Robertson B. E., Ellis R. S., Dunlop J. S., McLure R. J., Stark D. P., 2010, Natur, 468, 49
- Santos (2004) Santos M. R., 2004, MNRAS, 349, 1137
- Schaerer (2002) Schaerer D., 2002, A&A, 382, 28
- Schaerer & Pelló (2005) Schaerer D., Pelló R., 2005, MNRAS, 362, 1054
- Schaerer & Verhamme (2008) Schaerer D., Verhamme A., 2008, A&A, 480, 369
- Schaerer & de Barros (2009) Schaerer D., de Barros S., 2009, A&A, 502, 423
- Schaerer & de Barros (2010) Schaerer D., de Barros S., 2010, A&A, 515, A73
- Schaerer et al. (2011) Schaerer D., Hayes, M., Verhamme, A., Teyssier, R., 2011, A&A, in press (arXiv1104.5383)
- Songaila (2004) Songaila, A. 2004, AJ, 127, 2598
- Stark et al. (2009) Stark D. P., Ellis R. S., Bunker A., Bundy, K., Targett, T., Benson, A., Lacy, M., 2009, ApJ, 697, 1493
- Stark et al. (2010) Stark D. P., Ellis R. S., Chiu K., Ouchi M., Bunker A., 2010, MNRAS, 408, 1628
- Vanden Berk et al. (2001) Vanden Berk D. E., et al., 2001, AJ, 122, 549
- Vanzella et al. (2010) Vanzella E., et al., 2010, A&A, 513, A20
- Verhamme, Schaerer, & Maselli (2006) Verhamme A., Schaerer D., Maselli A., 2006, A&A, 460, 397
- Verhamme et al. (2008) Verhamme A., Schaerer D., Atek H., Tapken C., 2008, A&A, 491, 89
- Weinmann et al. (2011) Weinmann, S. M., Neistein, E., Dekel, A., 2011, MNRAS, submitted (arXiv1103.3011)
- Westra et al. (2005) Westra E., et al., 2005, A&A, 430, L21
- Westra et al. (2006) Westra E., et al., 2006, A&A, 455, 61
- Yoshikawa et al. (2010) Yoshikawa, T., Akiyama, M., Kajisawa, M., et al. 2010, ApJ, 718, 112