Type Ia Supernova Carbon Footprints
Abstract
We present convincing evidence of unburned carbon at photospheric velocities in new observations of 5 Type Ia supernovae (SNe Ia) obtained by the Nearby Supernova Factory. These SNe are identified by examining 346 spectra from 124 SNe obtained before d relative to maximum. Detections are based on the presence of relatively strong C II 6580 absorption “notches” in multiple spectra of each SN, aided by automated fitting with the SYNAPPS code. Four of the 5 SNe in question are otherwise spectroscopically unremarkable, with ions and ejection velocities typical of SNe Ia, but spectra of the fifth exhibits high-velocity ( km s-1) Si II and Ca II features. On the other hand, the light curve properties are preferentially grouped, strongly suggesting a connection between carbon-positivity and broad band light curve/color behavior: Three of the 5 have relatively narrow light curves but also blue colors, and a fourth may be a dust-reddened member of this family. Accounting for signal-to-noise and phase, we estimate that % of SNe Ia exhibit spectroscopic C II signatures as late as d with respect to maximum. We place these new objects in the context of previously recognized carbon-positive SNe Ia, and consider reasonable scenarios seeking to explain a physical connection between light curve properties and the presence of photospheric carbon. We also examine the detailed evolution of the detected carbon signatures and the surrounding wavelength regions to shed light on the distribution of carbon in the ejecta. Our ability to reconstruct the C II 6580 feature in detail under the assumption of purely spherical symmetry casts doubt on a “carbon blobs” hypothesis, but does not rule out all asymmetric models. A low volume filling factor for carbon, combined with line-of-sight effects, seems unlikely to explain the scarcity of detected carbon in SNe Ia by itself.
Subject headings:
supernovae: general — supernovae: individual (SN 2005cf, SN 2005di, SN 2005el, SN 2005ki, SNF20080514-002)1. Introduction
There is a well-established core population of Type Ia supernovae (SNe Ia) distinguished by striking spectroscopic homogeneity (Branch, Fisher & Nugent, 1993; Filippenko, 1997). The maximum light ultraviolet-optical-infrared spectra of these SNe carry signatures of predominantly intermediate-mass and iron-peak elements (often identified: oxygen, magnesium, silicon, sulfur, calcium, and iron). The consistent presence of these features in the spectra of the SN Ia core population contrasts with the intermittent detection of carbon lines. Such carbon is detected in the earliest data, but fades away by the time of peak brightness.
SNe Ia probably arise from the thermonuclear incineration of carbon/oxygen white dwarfs in binary systems (see Hillebrandt & Niemeyer, 2000, for a review). Since carbon is consumed during the explosion, constraints on its quantity, distribution, and incidence in SN Ia ejecta help identify viable explosion mechanisms. For example, turbulent deflagration models predict that a large amount of unprocessed carbon may be left over (e.g., Gamezo et al., 2003; Röpke & Hillebrandt, 2005; Röpke et al., 2007) while models where the deflagration is followed by a detonation phase can more completely burn it (e.g., Höflich et al., 2002; Kasen, Röpke & Woosley, 2009). Interpreting oxygen signatures is more ambiguous, since oxygen is produced as well as consumed in the explosion. Thus, constraints on carbon in SNe Ia are expected to be an important piece of the explosion mechanism puzzle.
Unfortunately, multiple factors hinder an unbiased accounting of carbon signatures in SN Ia spectra. Challenges inherent in both discovering and coordinating time-series spectroscopic follow-up of early, nearby SNe Ia result in relatively poor statistics at phases optimal for studying carbon (i.e., within 10 days after explosion or before about a week prior to maximum light): Early observations probe the outermost layers of the SN, the region of the ejecta where carbon is most likely to be found. Optical carbon features are seldom conspicuous even at the earliest phases, so noise may muddle detection in “screening” spectra of young SNe Ia. To achieve large numbers of SN candidates with a high “purity” of early SN Ia discoveries, SN surveys must cover as much sky as possible while maintaining a few-day cadence; a difficult endeavor. Such surveys with associated on-demand access to spectroscopy resources, like the Nearby Supernova Factory (SNfactory, Aldering et al., 2002) or the Palomar Transient Factory (PTF, Rau et al., 2009), provide a direct way to address the relative lack of spectroscopic time series sustained from the earliest phases. Such data sets provide opportunities to obtain new constraints on SN Ia physics. By comparison, spectra obtained at and after maximum light are already plentiful and well-studied.
The need to understand the SN Ia explosion mechanism and progenitor system is as critical as ever, especially because of the important role SNe Ia play in observational cosmology. Observations of high-redshift SNe Ia resulted in the discovery of Dark Energy, a revelation that has changed our view of the Universe radically over the past decade. The Universe is not only expanding, but the rate of expansion itself is accelerating, in contrast to previous expectations that it would be found to be decelerating (Riess et al., 1998; Perlmutter et al., 1999; Astier et al., 2006; Riess et al., 2007; Wood-Vasey et al., 2007; Kowalski et al., 2008; Hicken et al., 2009; Sullivan et al., 2011; Suzuki et al., 2011). New techniques show promise for improving SN Ia distance measurement precision (Bailey et al., 2009; Mandel et al., 2009; Wang et al., 2009a; Foley & Kasen, 2011; Blondin et al., 2011). However, the fact that SNe Ia couple Dark Energy results to stellar evolution astrophysics amplifies concerns that drift in emergent SN properties as a function of redshift could be confused with a cosmology signal. For example, the demographics of the underlying progenitor population may drift over time, leading to a shift in measured SN properties such as decline rate (Mannucci et al., 2005; Scannapieco & Bildsten, 2005; Sullivan et al., 2006). Overcoming such problems requires building a coherent picture of the progenitor system and explosion mechanism.
In support of this effort, we consider the occurrence of unburned carbon in a large set of early phase spectra obtained by the SNfactory. Our analysis supplements that of Parrent et al. (2011) who conducted the first comprehensive carbon signature survey using publicly available (and some new) SN Ia spectroscopy. Together, our studies find or verify several “definite” or “probable” C II 6580 detections in SNe Ia that are neither super-Chandrasekhar candidates nor otherwise obviously peculiar. Six of 27 normal SNe Ia with SNfactory observations before d and with sufficient signal-to-noise (S/N) have definite C II 6580 detections. Such normal SNe are the foundation of the SN Ia Hubble diagram; studying observables correlated with the incidence of carbon may provide new constraints on the explosion mechanism, leading to new systematics controls or ruling out the need for some. In particular, we are interested in addressing the question of whether carbon-positivity in SNe Ia is idiosyncratic (distributed randomly within the population without regard to other observables like light curve shape or color) or specifically correlated with other parameters. For example, if the frequency (or strength, or persistence) of carbon signatures is somehow correlated with luminosity or light-curve shape, explosion models need to reproduce this relationship. Our results are the strongest indication so far of such a connection between carbon-positivity and broad-band photometric properties in normal SNe Ia.
The remainder of this article is arranged as follows. In § 2, the initial carbon detection procedure is outlined and in § 3, the selected sample is presented. § 4 covers our analysis of the pre-maximum evolution of the identified carbon features, overall characteristics of the selected spectra, and light-curve/color properties of these SNe. Details on individual objects are deferred to the Appendix. § 5 brings together our results, provides the first measurement of the C II 6580 detection rate, and discusses our findings in broader contexts. In § 6, we draw conclusions.
2. Data Selection
The spectra used in this study were obtained by the SNfactory between 2004 and 2009 with the SuperNova Integral Field Spectrograph (SNIFS, Lantz et al., 2004). SNIFS is a fully integrated instrument optimized for automated observation of point sources on a structured background over the full ground-based optical window at moderate spectral resolution. It consists of a high-throughput wide-band pure-lenslet integral field spectrograph (IFS, “à la TIGER;” Bacon et al., 1995, 2000, 2001), a multi-filter photometric channel to image the field in the vicinity of the IFS for atmospheric transmission monitoring simultaneous with spectroscopy, and an acquisition/guiding channel. The IFS possesses a fully-filled spectroscopic field of view subdivided into a grid of spatial elements, a dual-channel spectrograph covering 3200–5200 Å and 5100–10000 Å simultaneously, and an internal calibration unit (continuum and arc lamps). SNIFS is mounted on the south bent Cassegrain port of the University of Hawaii 2.2 m telescope on Mauna Kea, and is operated remotely. Spectra of all targets were reduced using the SNfactory’s dedicated data reduction pipeline, similar to that presented in § 4 of Bacon et al. (2001). A key point is that all spectra analyzed and presented have been corrected for telluric absorption. A brief discussion of the software pipeline is presented in Aldering et al. (2006) and is updated in Scalzo et al. (2010). A detailed description of the instrument and reduction pipeline will be published in the future.
The starting-point for the analysis is the sample of SNIFS spectra obtained prior to d with respect to rest-frame -band maximum, as determined by SALT2 light-curve fits (Guy et al., 2007) to SNe Ia observed on 5 or more nights. This selection yields 346 epochs of spectrophotometry from 124 individual SNe Ia. We have excluded the previously published carbon-positive SN 2006D (Thomas et al., 2007), but will include it in the discussion in § 5. The sample includes spectroscopically “normal” SNe Ia (Branch, Fisher & Nugent, 1993), overluminous SN 1991T-like and SN 1999aa-like (Li et al., 2001) SNe Ia, and candidate super-Chandrasekhar-mass SNe Ia (Howell et al., 2006). A range of light curve stretch values (Goldhaber et al., 2001) is represented (corresponding post-peak decline rate , Guy et al., 2007). However, there are no subluminous SN 1991bg-like events following the most strict definition (i.e., exhibiting a prominent Ti II absorption trough at maximum light; Branch, Fisher & Nugent, 1993).
To help identify candidate carbon features, we systematically conduct fits to the relevant portion of each spectrum using the SYNAPPS code (Thomas, Nugent & Meza, 2011). SYNAPPS uses a highly parameterized but fast SN spectrum synthesis technique, and as such does not solve the full model SN atmospheres problem, in contrast to programs like PHOENIX (Hauschildt, Baron & Allard, 1997), CMFGEN (Hillier & Miller, 1998), or SEDONA (Kasen, Thomas & Nugent, 2006). The other codes mentioned are examples designed for full/partial non-local thermodynamic equilibrium radiative transfer, enabling detailed post-processing of stellar explosion models for comparison to observations. SYNAPPS is useful in the opposite sense, producing constraints on explosion models from observations, since it identifies ion species and estimates their characteristic ejection velocities. Given the schematic radiative transfer model that SYNAPPS uses and its as yet unquantified systematic uncertainty, we employ the fit results as an adjunct in our examination of the spectra rather than as a direct quantitative discriminant. The radiative transfer assumptions underlying SYNAPPS match those of the well-known SYNOW SN spectrum synthesis program (Fisher, 2000; Branch, Dang & Baron, 2009): Spherical symmetry, a sharply-defined blackbody-emitting pseudo-photosphere, pure-resonance line transfer under Sobolev formalism, with line opacity parameterized radially using convenient functional forms and in wavelength assuming Boltzmann excitation. SYNAPPS combines this parameterized spectrum synthesis calculation with a parallel non-linear optimization framework (Kolda, 2005; Gray & Kolda, 2005; Griffin & Kolda, 2006) to reduce the need for tedious interactive adjustment of fit parameters and to assure more systematic sampling of the parameter space.
We use C II 6580 as our primary carbon indicator. We consider it the best option, for reasons we now describe. C II 4745 and 7234 may also be useful (and have been previously identified, e.g., Thomas et al., 2007) but are much weaker at the temperatures of interest, and 4745 is very likely to be blended with other lines. Elsewhere, C II 4267 has been considered as a carbon tracer (e.g., Branch et al., 2003; Howell et al., 2006; Thomas et al., 2007) but it is problematic: It does not seem to produce a reliable, distinct feature in the spectrum, and is vastly weaker than C II 6580 at the relevant temperatures. There is some evidence for the high-excitation C III 4649 line in the spectra of SN 1999aa-like (Garavini et al., 2004) and SN 1991T-like (Parrent et al., 2011) SNe Ia, but it is the only strong optical C III feature and is not reliably detected in the spectra of less luminous objects. C I lines are mostly too red or too weak (e.g., 9087, 9406, 10693) for us to consider with SNIFS data (Marion et al., 2006, 2009). Thus, C II 6580 seems to be the best choice, especially considering the observational constraints.
As Parrent et al. (2011) demonstrated (their Figure 9), C II 6580 absorptions caused by carbon at higher velocities (much faster than that at the photosphere at the phases of interest) will disappear into the Si II 6355 absorption trough where they cannot be detected reliably. Hence, inferences about carbon from the C II 6580 notch are limited to lower velocities. Fortunately, the low velocity regime is what is of greatest interest for constraining the explosion mechanism. Carbon at the highest velocities may not be surprising; the presence of carbon is much more variable at lower velocities in existing models.
A final, but related, issue worthy of mention is the systematic error that could be incurred when estimating the ejection velocity of carbon directly from the position of the absorption notch instead of with the aid of modeling, that of center-to-limb variation (Höflich et al., 1990). Without the aid of any kind of spectral modeling, the velocity of the carbon layer could be underestimated by up to a factor of 2. However, SYNAPPS (at least) handles line blending explicitly, and the velocity at the photosphere will be estimated by a fit to the full spectrum, so we can be reasonably confident that the carbon is located near or just above the photosphere.
The wavelength range selected for initial fitting extends from 5300 to 7300 Å. The pseudo-continuum level and line features are simultaneously fit by SYNAPPS, and all fits include lines from O I, Si II, and S II. Lines from these ions are the most important to consider in this wavelength region while the SN is on the rise. Strong iron-peak lines only become important after the phases considered here. A second-order polynomial warping function multiplied against the synthetic spectrum is included to mitigate limitations of the parameterized model continuum, which does not affect our ability to detect a C II 6580 absorption “notch,” a much smaller scale feature. Since SYNAPPS models the SN spectrum but not the intervening gas, we mask out rest-frame wavelengths between 5875 and 5915 Å, a generous allowance to exclude host galaxy interstellar (or circumstellar) Na I D contamination, based on the width of the strongest Na I D feature observed in the sample (SNF20080720-001, SNfactory, 2008b). All spectra presented and fit by SYNAPPS are corrected for observer-frame Milky Way () extinction using the CCM (Cardelli et al., 1989) dust law, with color excess estimates from Schlegel et al. (1998).
Three fits are performed to each spectrum to find candidate C II features. The first set of fits including only O I, Si II, and S II provides a carbon-free baseline. The second set of fits adds C II with a “photospheric” Sobolev optical depth profile, meaning that the minimum velocity of the profile is constrained to equal the velocity at the photosphere. The third set of fits substitutes a “detached” C II optical depth profile, with the minimum velocity of the profile unconstrained with respect to the photospheric velocity. In all 3 fits, the Sobolev opacity declines with velocity exponentially. A set of C II fits allowing Si II opacity to be detached was also performed, but in practically all cases SYNAPPS found a better fit without Si II detachment.
Some of the targets included in the analysis have previously been identified or suspected of being carbon-positive, in particular SNF20080514-002 (SNfactory, 2008a). To reduce (somewhat) the risk of confirmation bias, the process of organizing and executing the fits includes concealing the identity of the parent SN of each spectrum and its phase. This is accomplished by shuffling the spectra and assigning a unique integer identifier to each. The mapping from spectrum to SN and phase is kept in a hash file that is only consulted after the carbon detections have been made. This procedure, along with the SYNAPPS fitting, forced us to consider more spectra more carefully. It also concealed the measured light curve fit parameters while identifying strong carbon features, ensuring that any correlation between them and the presence of carbon would also be uncovered without bias.
For a detection to be considered definitive, we require that C II be detected in at least 2 spectra of an object’s time-series, either from the same night of observation or across multiple consecutive nights. The final C II identifications are confirmed by visual inspection and comparison of the fits in the region of the Si II 6355 emission peak. Cases where the fits with and without C II are basically identical are considered non-detections (the addition of C II opacity does not improve the fit). Fits with C II that differ from the baseline fit, and moreover improve upon it, are flagged for closer scrutiny. Several example fits are shown in Figure 1. While the detailed agreement in all cases is not perfect, the SYNAPPS fits greatly improve our confidence in the C II identifications we otherwise would have made purely by visual inspection. SYNAPPS also highlighted cases we might have overlooked, but in practice few of these cases ultimately made it into the sample, usually because they fail the 2-spectrum cut or were less convincing.
3. The Carbon-Positive SNe Ia
| SupernovaaaDiscovery credits (all dates UTC). Lick Observatory Supernova Search (LOSS, Filippenko et al., 2001): SN 2005di on Aug. 12.4 (Pugh & Li, 2005b), SN 2005el on Sep. 19.5 (Madison, Baek & Li, 2005), SN 2005ki on Nov. 18.6 (Ponticello & Li, 2005), SN 2005cf on May 28.4 (Pugh & Li, 2005a). SNfactory: SNF20080514-002 on May 14.3 (SNfactory, 2008a). | Host GalaxybbRedshift credits. MGC -04-52-46 (Mathewson & Ford, 1996). RC3.9 (de Vaucouleurs et al., 1991): NGC 1819, MCG -01-39-003. Sloan Digital Sky Survey DR7 (Abazajian et al., 2009): NGC 3332, UGC 8472. | SALT2 Fits | -band Maximum | Rest Frame Phases | ||
|---|---|---|---|---|---|---|
| Name | Date (UTC) | of Detection | ||||
| SN 2005di | MGC -04-52-46 | 2005-08-26.2 | ||||
| SN 2005el | NGC 1819 | 2005-10-03.6 | ||||
| SN 2005kiccLight curve parameters from a fit to data from Hicken et al. (2009) and Contreras et al. (2010). | NGC 3332 | 2005-12-01.2 | ||||
| SNF20080514-002 | UGC 8472 | 2008-05-26.5 | ||||
| SN 2005cf | MCG -01-39-003 | 2005-06-12.9 | ||||
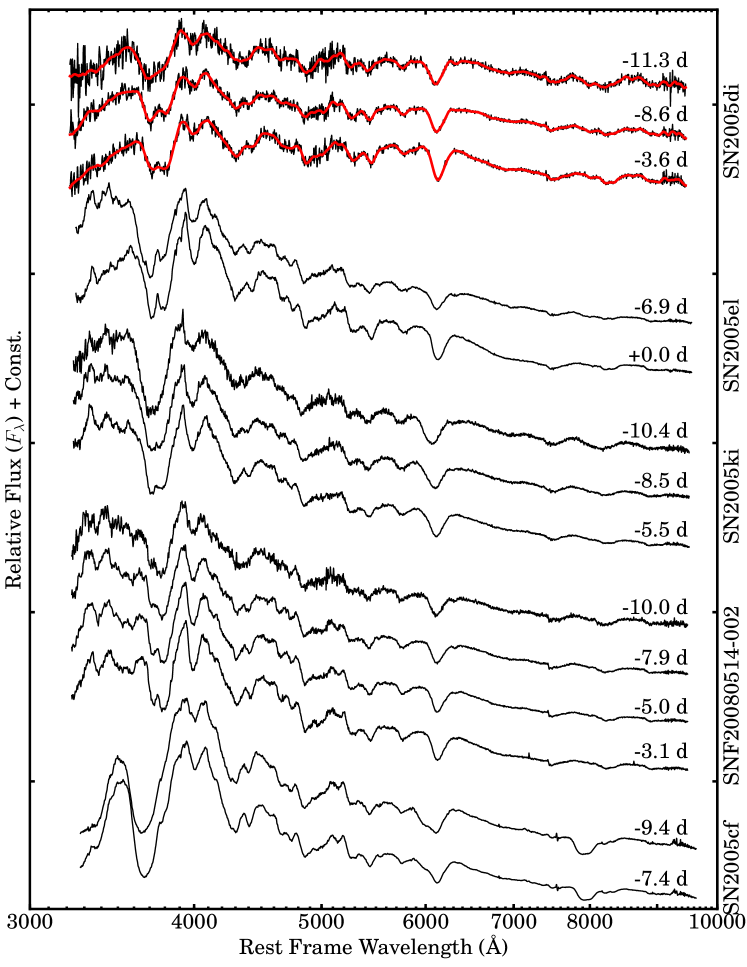
The fit survey yielded 6 of 124 SNe Ia with definitive C II 6580 absorption notch detections. In one of these cases, SN 2005cf, there is only a single-spectrum detection, but this SN is difficult to discard since the detection is corroborated by other external data sets. Of the 124 SNe Ia in the sample, 4 are super-Chandrasekhar-mass SN Ia candidates (including SN 2007if, the only clear C II 6580 detection among the 4, Scalzo et al., 2010). Removing these leaves 5 out of 120 carbon-positive SNe Ia: SNe 2005di, 2005el, 2005ki, SNF20080514-002, and SN 2005cf (a special case). For our dataset, spectra having the requisite S/N generally come from SNe at the lowest redshifts. Due to the resulting small volume sampled by untargeted surveys out to such redshifts, the sample here is dominated by SNe Ia from targeted searches. These new detections are the focus of our detailed analysis in the rest of this article. Basic target information is summarized in Table 1 and selected pre-maximum spectra of each object, up to the point where the carbon signatures disappear, are shown in Figure 2.
A few characteristics of the spectra presented in Figure 2 are worthy of specific mention. The spectra of SN 2005di are quite red, but there is evidence (discussed below) that this is due to extrinsic dust extinction. SN 2005el, SN 2005ki, and SNF20080514-002 all possess what appear to be pronounced flux excess blueward of about 3600 Å. The spectra of these 3 objects are also dramatically similar in terms of detailed feature morphology. SN 2005cf clearly stands apart, with its more modest relative flux levels blueward of 3600 Å, but broader Ca II H&K and Si II 6150 Å absorptions, and apparent high velocity (HV) Ca II infrared triplet.
3.1. SN 2005di
SNIFS observed SN 2005di on 10 occasions between Aug. 14 and Sep. 22.111All dates discussed in this article are UTC. The first 3 spectra of SN 2005di appear in Figure 2. The d spectrum used here is a co-addition of 2 consecutive exposures on the same night. Close examination of the time series reveals the presence of narrow rest-frame Na I D absorption (see Figure 3a). This and the relatively red appearance of the spectral energy distribution lead us to conclude that SN 2005di is heavily extinguished by line-of-sight dust in its host galaxy or circumstellar environment. Since SNIFS exposure times were generally not adjusted to compensate for high extinction, the spectra of SN 2005di have lower S/N than typical SNe Ia observed by SNIFS at the same redshift. Still, C II 6580 is detected in the first spectrum and possibly in the second.
Initial spectroscopic classifications of SN 2005di were published by 2 groups. Salvo et al. (2005) reported that a spectrum obtained Aug. 16 resembles the spectrum of another SN Ia a few days past peak, and Gal-Yam, Sand & Leonard (2005) state that their Aug. 14 spectrum suggests that SN 2005di is “young,” but neither report discusses C II. The SNIFS quick-reduction pipeline classification indicated that SN 2005di was a SN Ia about 1 week before maximum, and highly extinguished with an estimated . Revisiting our quick-reduction spectrum we find that the C II 6580 absorption notch could have been identified, but its significance was not obvious at the time.
SN 2005di was used in the SNfactory spectral flux ratio luminosity indicator study (Bailey et al., 2009). That study found the ratio of flux measured at 642 nm to that at 443 nm at maximum light () to be a good predictor of relative luminosity. SN 2005di is the object in that study with the largest value of , owing primarily to its red color. Any possible effect of C II 6580 emission near 642 nm either as a possible source signal or noise in the relationship between and Hubble diagram residual was not discussed, since at the time of publication the presence of C II had not been noticed. We expect our C II 6580 detection to have no implication for the flux ratio result, since that study was restricted to spectra obtained within 2.5 d of maximum, when the carbon signature is gone.
3.2. SN 2005el
Nineteen SNIFS visits of SN 2005el were conducted between Sep. 26 and Nov. 20. Figure 2 includes the spectra from the first 2 of these. The d observation is a co-addition of the 2 observations obtained that night. In this case, C II 6580 is only positively detected by SYNAPPS on the first date of observation. However, it is clearly present in both high S/N spectra taken that night and the co-add.
SN 2005el is a very well-observed SN (Wood-Vasey et al., 2008; Hicken et al., 2009; Contreras et al., 2010). Its spectroscopic normality has been remarked upon in the literature previously (e.g. Phillips et al., 2007; Höflich et al., 2010). Initial classification reports indicated that SN 2005el was discovered a few to several days prior to maximum (Wong et al., 2005; Morrell, Folatelli & Hamuy, 2005) but until now no remarks have been made in the literature regarding the presence of C II in the spectra. These classification spectra were obtained the same night as the first SNIFS observations. The SNIFS quick-reduction pipeline in use during the SN 2005el campaign failed to properly correct for a cosmic-ray hit coincident with the C II 6580 notch in one spatial element of the 2 spectra obtained on the first night. Subsequent improvements to the pipeline later revealed the clear C II 6580 notch in both spectra.
3.3. SN 2005ki
SNIFS follow-up of SN 2005ki was triggered Nov. 20. Six nights of observations were obtained in all, ending Dec. 2, around the time of maximum brightness. Follow-up ended prematurely due to equipment failure at the UH 2.2 m telescope that forced an extended offline period for SNIFS. Therefore, we adopt the date of maximum and light-curve fit parameters from a SALT2 fit to more complete photometry published by Hicken et al. (2009) and Contreras et al. (2010). The first 3 spectra of SN 2005ki are presented in Figure 2. Relatively weak C II 6580 absorption is detected in the first spectrum, and very marginally in the second. Returning to the first 2 SNIFS quick-reduction spectra of this object, the presence of C II 6580 now seems obvious in retrospect. Our classification announcement made no mention of it (SNfactory, 2005).
3.4. SNF20080514-002
Twenty nights of spectroscopy of SNF20080514-002 were obtained with SNIFS, starting May 16 and ending Jul. 9. The first 4 spectra of SNF20080514-002 appear in Figure 2. The d and d spectra are co-additions of 3 consecutive observations on each respective night. C II 6580 is clearly detected in the first 2 spectra of this object, and probably in the third. Though the emission peak visible at the position of the notch in the fourth spectrum looks flattened, we hesitate to posit a flux depression due to C II opacity in this case. At this point, SYNAPPS is able to convincingly fit the feature with or without a weak C II 6580 line.
As initially reported (SNfactory, 2008a), the early spectra of SNF20080514-002 are quite blue, indicative of a SN Ia at or before a week prior to maximum light. Both spectra exhibit absorption lines attributed to C II 6580, but C II 7234 is not as readily apparent as in, say, SN 2005el. C II 4745 was also mentioned, but is a much weaker and more blended line than the others.
Like SN 2005di, SNF20080514-002 was used in the Bailey et al. (2009) flux ratio study. In marked contrast to SN 2005di, this target has an extremely blue color but is well within the core of the Hubble residual versus distribution (their Figure 2). As with SN 2005di, the use of the at-maximum spectrum for the flux ratio study limits the influence of C II 6580 on those results.
3.5. SN 2005cf
SNIFS observed SN 2005cf on 12 nights from Jun. 3 to Jul. 8. The first 2 spectra are shown at the bottom of Figure 2. A small C II 6580 absorption notch is visible in the d spectrum but becomes absent or nearly absent 2 days later. Our selection guidelines require detection in 2 distinct SNIFS spectra, so we should technically disqualify SN 2005cf from further consideration. However, SN 2005cf is an object with extensive previously published spectroscopy (Garavini et al., 2007; Wang et al., 2009b). Neither previous spectroscopic study nor the original classification announcement (Modjaz et al., 2005) discussed the putative C II 6580 notch visible in the spectra. When considering those observations, Parrent et al. (2011) placed SN 2005cf into their “uncertain” C II detection category. But given 3 independent data sets showing the same feature at roughly the same phase, it now seems difficult to overlook the presence of C II in the case of SN 2005cf.
4. Analysis
4.1. Spectroscopy
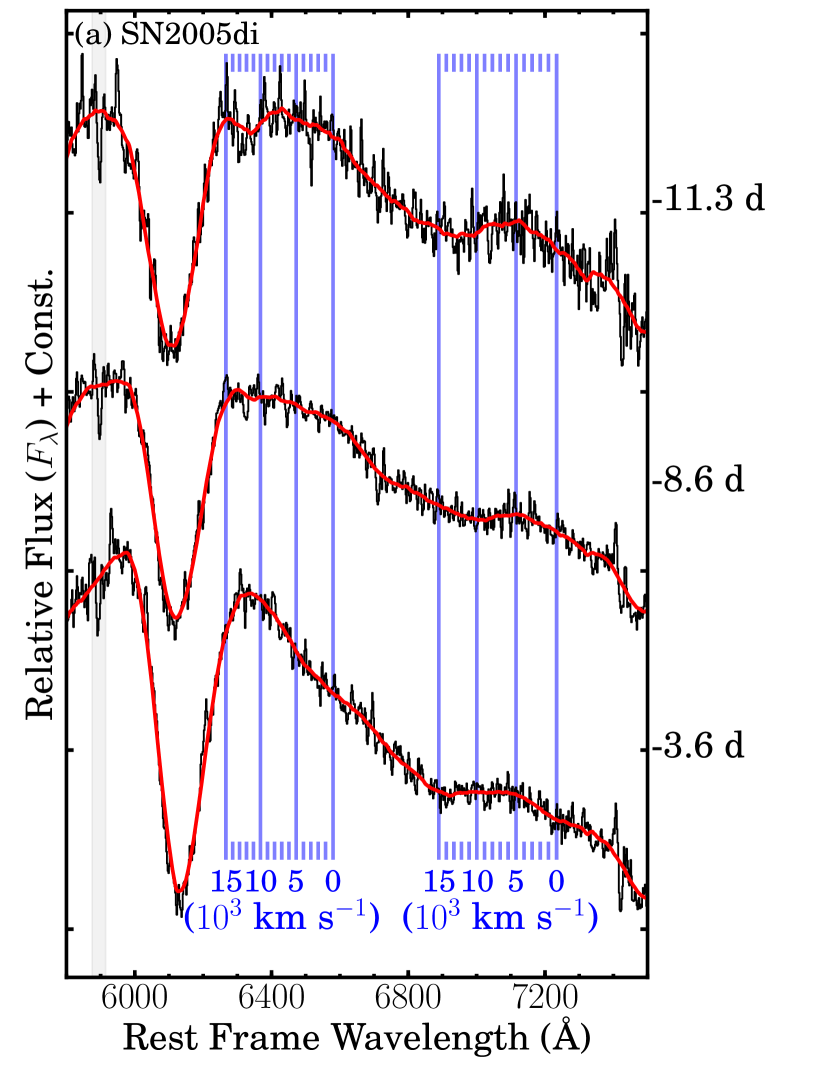
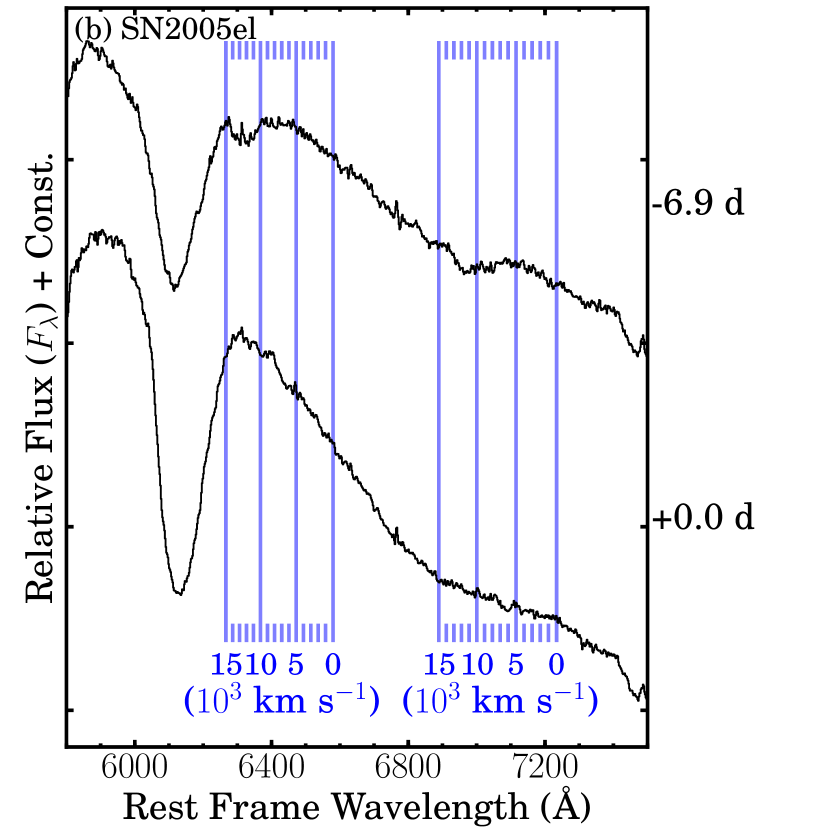
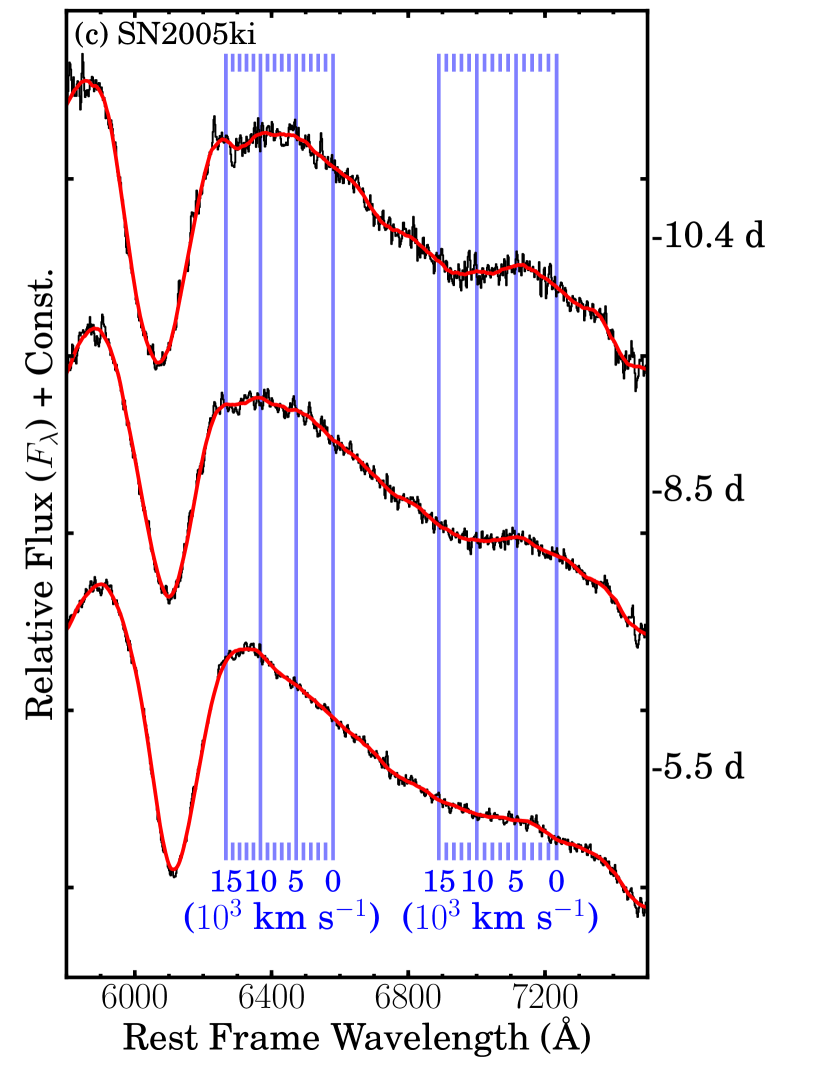
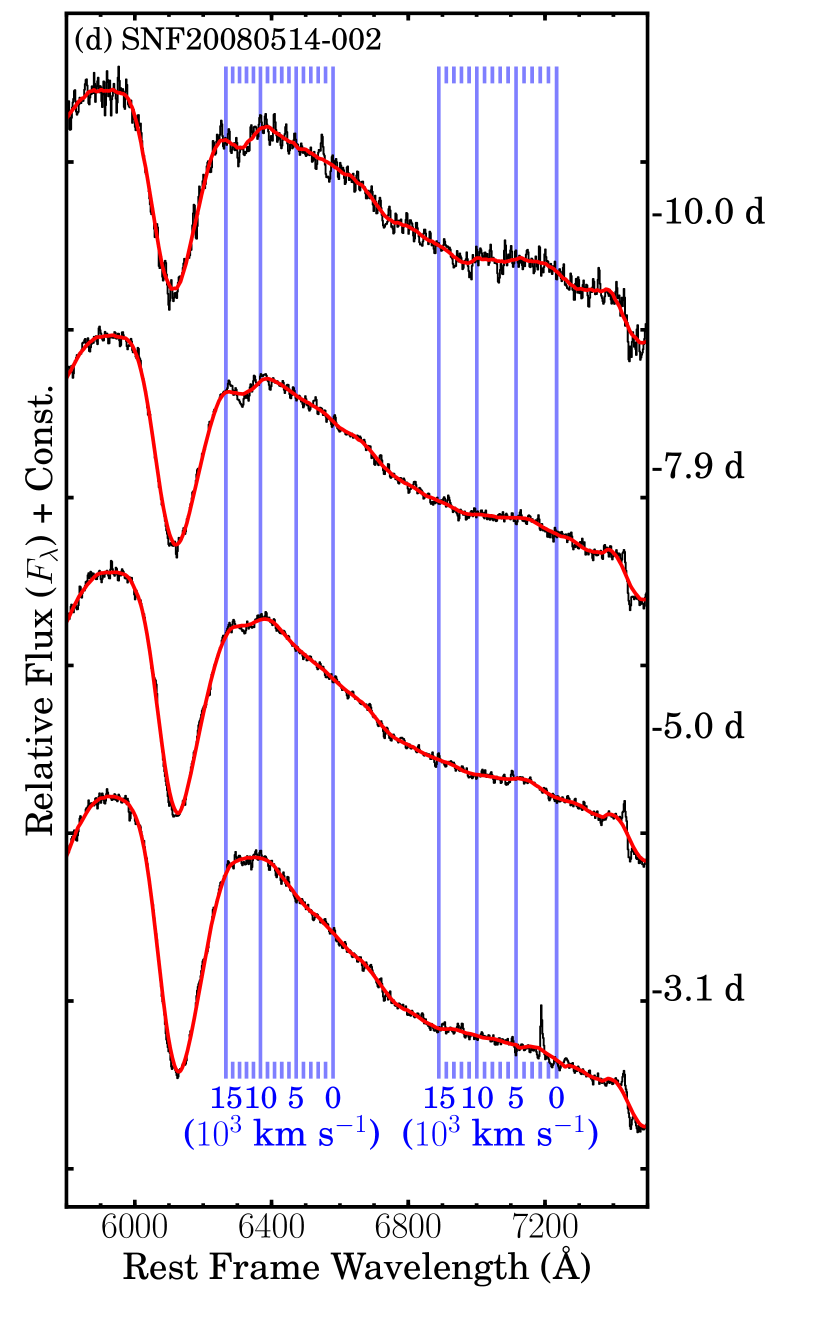
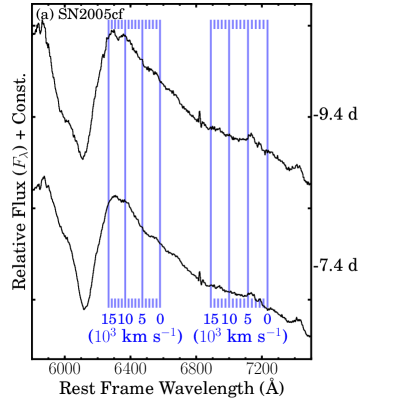
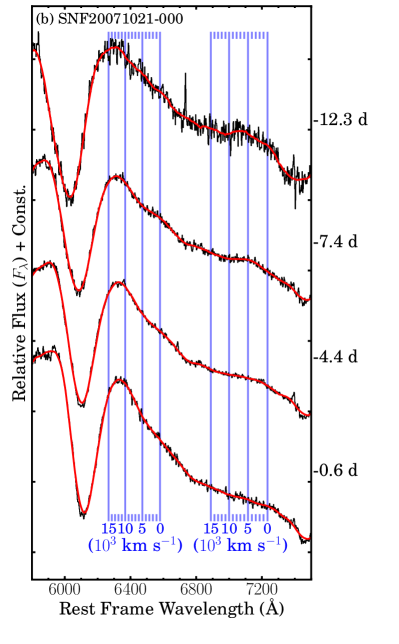
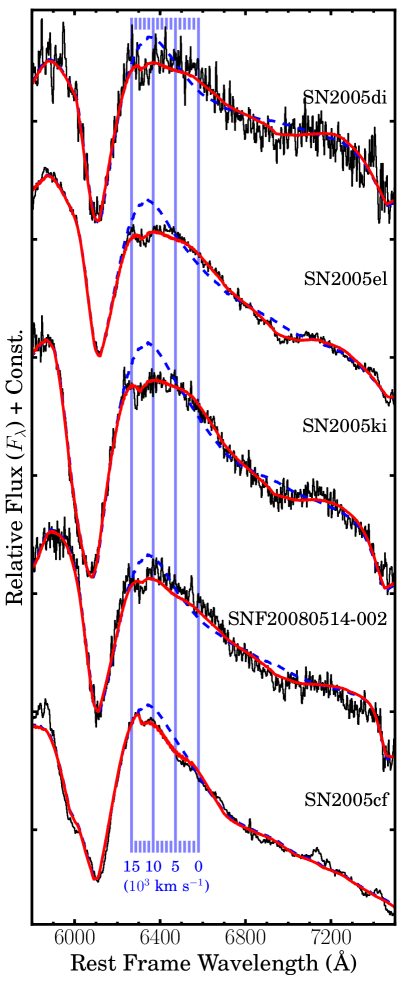
The detailed evolution of the carbon features in the pre-maximum spectra of SNe 2005di, 2005el, 2005ki, and SNF20080514-002 is depicted in Figure 3. SN 2005cf and a non-detection case for comparison (SNF20071021-000) appear in Figure 4. The C II 6580 notch is readily apparent, situated at or quite near the rest-frame emission peak of the Si II 6355 feature. The detailed evolution of the feature in each case is described in the Appendix.
In the first 4 cases, the notch is strongest in the earliest spectrum. It weakens gradually with time, and without appreciable wavelength shift. Generally, the notch is centered on an apparent blueshift of km s-1 relative to rest-frame C II 6580 (also roughly the same velocity as observed in SN 2006D). In SN 2005cf, the notch disappears between the first and second spectrum.
Excluding SN 2005cf, we see that while the notch dissipates, the shape of the spectrum just redward evolves as well. The slope of the decline in flux on the red side of the Si II 6355 emission feature becomes steeper while the notch weakens and the underlying Si II 6355 emission peak rises. In some cases (SNe 2005di, 2005ki, and SNF20080514-002) the earlier spectra may even exhibit a mild “flux plateau” morphology. Along with an absorption notch, such an emission plateau could be a signature of a “detached” distribution of C II line opacity in a shell separated somewhat from the photosphere (Jeffery & Branch, 1990). However, under spherical symmetry, such a plateau should be roughly symmetric about the line rest wavelength. Visually, this does not seem to be the case here.
The notch in the spectrum of SN 2005cf is morphologically distinct from the other cases, and appears to span a slightly smaller range in blueshift ( to km s-1). When the notch disappears, there is at most only a small amount of evolution in the flux slope just redward.
Confident identification of C II 7234 is problematic. In almost none of the cases presented is there a clear absorption feature at the same blueshift as the C II 6580 notch. At most, there is only an inflection visible around 6900–7000 Å and a slight emission “bump” around 7100 Å. Visual inspection alone would seem to be insufficient to draw more firm conclusions about the presence or absence of C II 7234 in general.
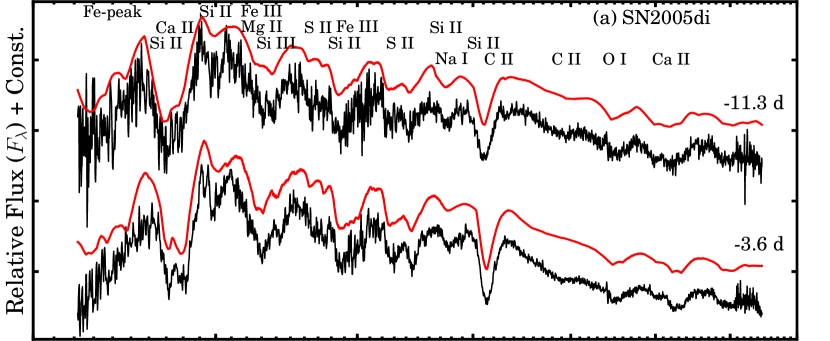
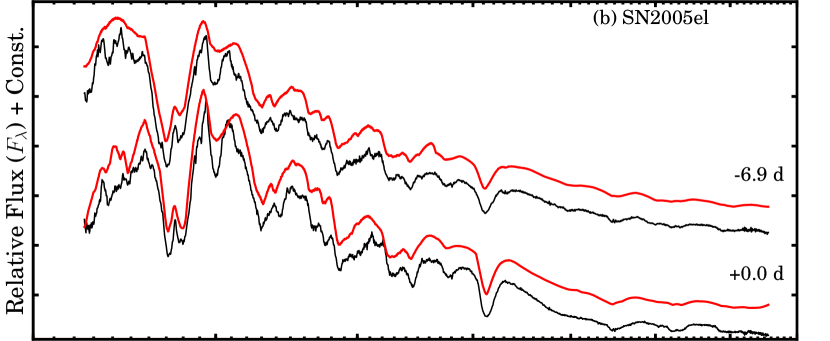
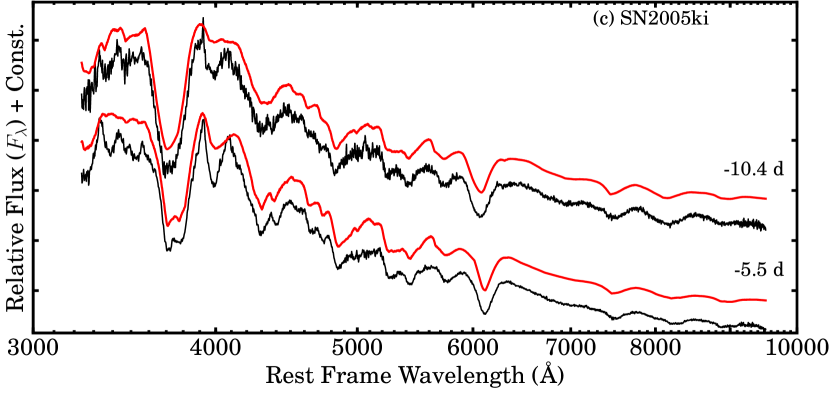
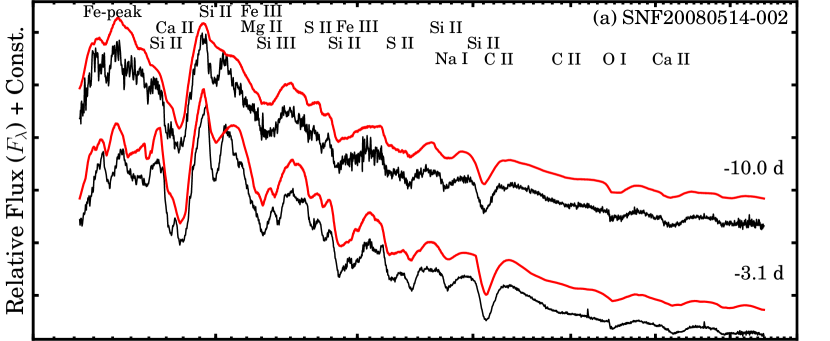
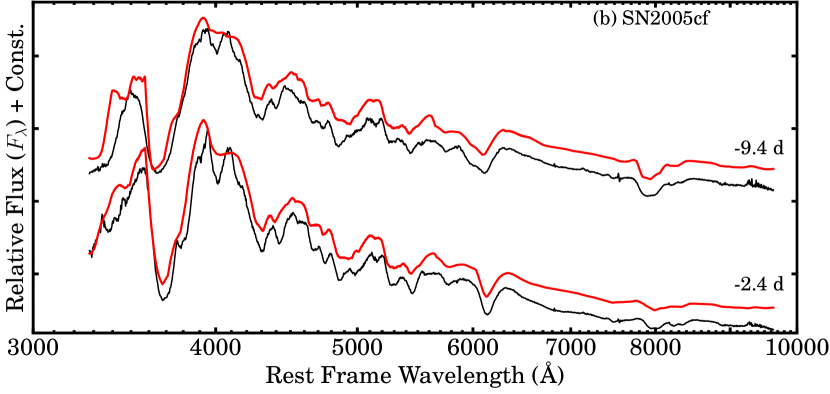
To examine the extent to which the selected targets are spectroscopically normal SNe Ia, we again use SYNAPPS, this time to fit the full wavelength range of each pre-maximum spectrum of each selected SN (detailed commentary is provided in the Appendix). Close examination of the C II features in the full fits may also enable some explosion-model independent statements about the distribution of carbon in the SN ejecta. Two selected fits for each SN appear in Figures 5 and 6: One fit to the first available spectrum, and another fit to the first spectrum where C II is absent. In general the opacity profiles for C II lines decrease with time as expected. Wavelengths of major ion contributors to the spectra are marked at the top of either figure. Except for the presence of C II, the spectra of the first 4 carbon-positive SNe Ia are anything but extraordinary — typical SN Ia ions at normal pre-maximum ejection velocities. SN 2005cf is another matter, since HV Si II and Ca II components are mandatory for a good fit, as discussed previously (Garavini et al., 2007; Wang et al., 2009b).
In each case, we find compelling evidence for opacity from C II, O I, Mg II, Si II and Si III, S II, Ca II, singly-ionized ions of Ti through Co, and Fe III. For both Si II and Ca II we enable 2-component fits: One for a photospheric (undetached) component, and another for a HV (detached) component. The opacity profiles of all other ions are undetached from the photosphere. Optimal values for the velocity at the photosphere are found in the range to km s-1. Including some Na I opacity does seem to improve the fit morphology around the Si II 5800 Å absorption feature — however this identification is not unprecedented (e.g., Branch et al., 2005). In all cases, we were able to reconstruct the basic structure redward of 3500 Å quite well, and at times had reasonable success fitting the ultraviolet (UV, where lines from iron-peak elements dominate). We do not expect exceptional agreement in the UV, as the underlying assumptions of SYNAPPS (in particular the treatment of line opacity) begin to break down here. In general, the strengths of the features evolve smoothly with time, and no abrupt changes are observed as the C II becomes optically thin.
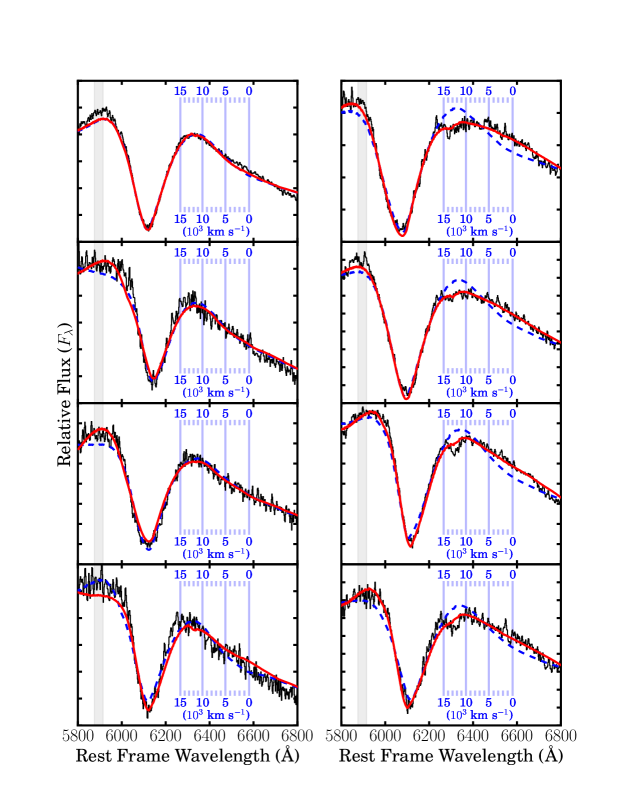
SYNAPPS accounts for the C II 6580 feature, including the region just redward of the notch, rather well (see Figure 7, red curve). Variations with and without detached C II were tried, but again SYNAPPS tended to set the lower velocity of the C II region to the velocity at the photosphere, making the need for detachment uncompelling. Analysis of the fit residuals indicates that the SYNAPPS model has insufficient fidelity for achieving a reduced of 1, but we find no strong indications of persistent residual structure.
In Figure 7, the 5800–7500 Å region of the first spectrum of each carbon-positive SN is overlaid with the converged, all-ions, full-wavelength SYNAPPS fits (shown in red). The blue curve results when the fully converged synthetic spectrum is recomputed with the C II opacity deactivated, while all other settings retain their converged values. The blue curves are thus not re-fits without C II included, in contrast to the example plots shown in Figure 1. Thus, the change from the blue curve to the red one illustrates what role C II plays in the formation of the spectrum quite clearly. Not only is C II 6580 responsible for the absorption notch, it “screens” emission from bluer Si II 6355 effectively enough that some emission relative to the C II-free spectrum (centered around 6600 Å) is visible in the top 4 cases. Finally, Figure 7 indicates that the flux depression around 6900–7000 Å may indeed be influenced by C II 7234 to some extent.
4.2. Light Curve and Color Properties

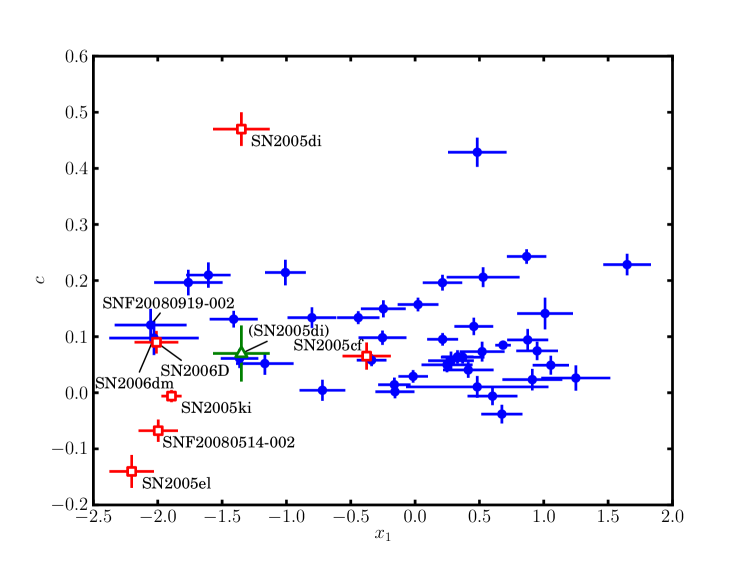
It is interesting that 3 of the 5 carbon-positive SNe Ia have relatively narrow light curves, with low SALT2 values around (, or , see Table 1). These same targets also have bluer than normal colors. SNF20080514-002 is also among the SNe Ia observed by Swift/UVOT (Gehrels et al., 2004; Roming et al., 2005) with largest UV excesses (Immler & Brown, 2008), as shown in Figure 8 (adapted from Milne et al., 2010). Swift/UVOT photometry for SNe 2008hv and SNF20080514-002 will be presented in Brown et al. 2011, in preparation. Figure 9 is a plot of SALT2 fit parameters for all SNe Ia with SNIFS light curve fits and a spectrum before d, the latest phase for which any C II 6580 is positively detected in this sample. SNe 2005el, 2005ki, and SNF20080514-002 form a relatively tight “cluster” at the fast-declining (low ) but blue corner of this plot. Other published results for SN 2005el have a somewhat larger value for (Hicken et al., 2009; Contreras et al., 2010), though all measurements indicate that is negative and this SN belongs in this group of relatively narrow light curves with blue colors. Thus, the quantitative results for SN 2005el may be further refined, but our qualitative conclusions should remain unchanged.
Neither SN 2005cf nor SN 2005di fit into the fast-decliner/blue-color family. In the case of SN 2005cf, this may not be surprising since the Si II and Ca II features quite robustly trace out HV ejecta more dramatically than in the other SNe at the same phases, indicating real physical differences between SN 2005cf and the others. However, as described in § 3 there is evidence that SN 2005di is extrinsically reddened. Since our data do not resolve the Voigt profiles of the possible multiple velocity components comprising the Na I D absorption line, we are unable to apply a quantitative correction for extinction using Na I D equivalent width (Poznanski et al., 2011). Instead, we use a different procedure to investigate whether SN 2005di could simply be a reddened member of the fast-decliner/blue-color subclass.
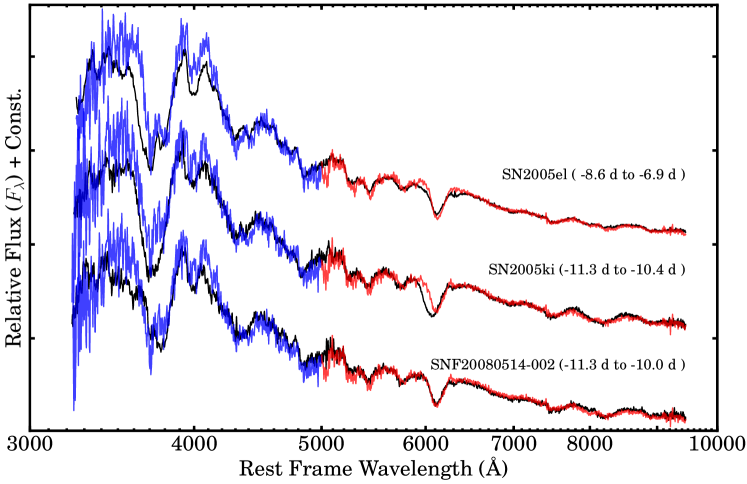
To see if this is at least a plausible hypothesis, we warp the spectral time series of SN 2005di according to the CCM dust law, fitting for the optimal differential that brings the spectra into detailed agreement above 5000 Å with each of SNe 2005el, 2005ki and SNF20080514-002. We make no attempt to constrain the differential and we assume a standard Milky Way value of 3.1. If we assume that the main difference between SN 2005di and the other SNe is the amount of dust extinction the former suffers, then correcting for it should bring the spectral time series into alignment. In the case of perfect “twin” SNe, the agreement above 5000 Å should be exquisite on a feature-by-feature basis, and the extrapolated flux below 5000 Å a good match.
The warping technique and a fully developed twin SN study are the subject of a future paper (Fakhouri et al., 2011), here we briefly describe the mechanics for 2 given objects. Spectral observations of the objects are paired based on phase, with similar phases being matched to each other. A linear interpolation correction to the fluxes accounts for overall flux difference arising from the small phase differences. A CCM dust law with fixed is fit to the ensemble of paired spectra, as well as an individual scale factor for each pair, to account for any small scatter. By fitting all of the pairs (extending from early epochs to late epochs) jointly for the appropriate dust law warping, we minimize the influence of any particular features on the fit at any given phase.
Figure 10 shows pairs of spectra that result when the time series of SN 2005di is warped to match the flux from another SN above 5000 Å, roughly matching by phase. The earliest pair of phases formed in each of the 3 cases is shown. The agreement above 5000 Å on a feature-by-feature basis is quite good, though there is a significant difference in the Si II 6355 absorption feature with respect to SN 2005ki — clearly an “intrinsic” difference. Blueward of the 5000 Å cut, the extrapolated color looks quite consistent. Thus, while we cannot prove definitively that SN 2005di is a dust-estranged member of the fast-decliner/blue-color family, there does seem to be a resemblance. Figure 9 includes the position of SN 2005di when corrected for the median derived differential is removed.
5. Discussion
To summarize, our most important findings are:
-
•
Definitive new detections of C II 6580 absorption notches in the pre-maximum spectra of 5 largely spectroscopically normal SNe Ia, at apparent blueshifts around km s-1, consistent with the velocity of the ejecta at the photosphere.
-
•
The observed notches fade with time without appreciable shift in wavelength, disappearing before maximum light. Detailed fitting shows that C II 6580 influences the formation of the spectrum beyond the immediate vicinity of the absorption notch.
-
•
Three of the 6 carbon-positive SNe Ia (including SN 2006D) in the full SNfactory sample group together in light curve shape and color space at the fast-decliner/blue-color corner. A further SN may belong to this family, plausibly separated from it by the effect of extrinsic dust reddening.
We consider 4 main questions in light of our results. First, factoring in the limitations of our sample and approach, what is the incidence of photospheric carbon in pre-maximum spectra of normal SNe Ia? Second, to what extent does carbon-positivity in SNe Ia predict a fast-declining light curves and blue color (or vice-versa), and what is the physical significance of such a connection? Third, what inferences can we make about the geometry of the ejected carbon in the SNe Ia studied here? Finally, what impact do our findings have on our understanding of the SN Ia explosion mechanism?
5.1. Incidence of C II
Our data suggest that unburned carbon, while far from ubiquitous, is also not particularly rare — in line with the result of Parrent et al. (2011). A detailed rate calculation is beyond the scope of this article, but we can try to estimate the frequency of photospheric-velocity carbon in normal SNe Ia based on the latest phase ( d) and lowest median S/N per 2.4 Å bin in the wavelength range of interest (11.7, that of SN 2005di at d) where C II 6580 is detected. 31 SNe Ia pass these cuts in the full SNfactory sample (which includes SN 2006D, Thomas et al., 2007), of which 2 are super-Chandrasekhar candidates and a further 2 are SN 1991T-like. Excluding these 4 SNe places the fraction of SNe Ia with C II 6580 that persists to d at % (Bayesian binomial confidence interval, see Cameron, 2010).
5.2. Carbon in SNe Ia
SN 2005el, SN 2005ki, SNF20080514-002, and perhaps SN 2005di could be members of a physically meaningful family of SNe Ia characterized by detectable carbon in their early spectra, relatively fast-declining light curves, and intrinsically blue colors. These 4 SNe were selected solely based on the presence of carbon signatures in their spectra, so we now reverse the selection and re-examine the early spectra of other objects with similar light curve or color parameters.
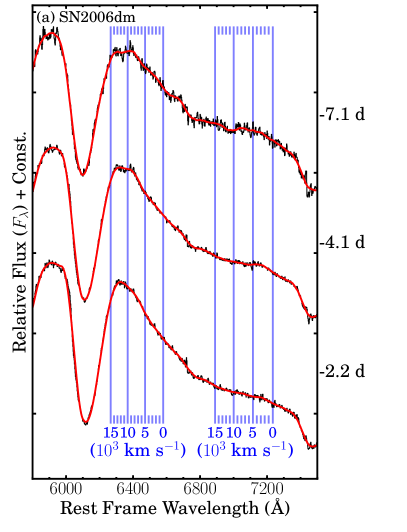
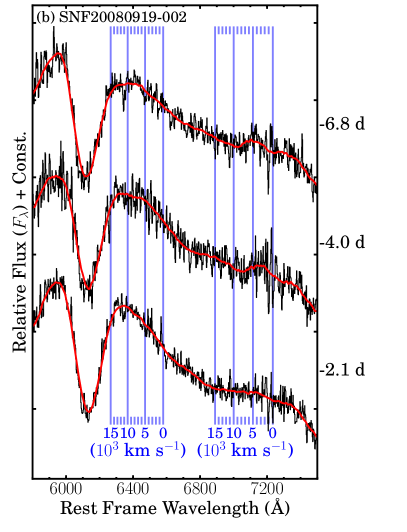
The most interesting results from our surveyed sample come from objects with similar light curve width. Figure 11 shows the 5800–7500 Å region of the pre-maximum spectra of SN 2006dm (Schwehr & Li, 2006) and SNF20080919-002. Neither case presents a robust notch, however the Si II 6355 emission peak looks somewhat “squashed” in the earliest spectra. The evidence is hardly decisively in favor of photospheric-velocity carbon in these 2 additional SNe Ia, but it is tantalizing. Carbon-positive SN 2006D (Thomas et al., 2007) is also plotted in Figure 9. It also has a SALT2 around but is redder than the objects uncovered by our survey here.
Returning to the Swift/UVOT color-curves in Figure 8, we identify SN 2008Q (Villi et al., 2008) and SN 2008hv (Pignata et al., 2008) as having UV colors similar to those of SNF20080514-002. All 3 of these targets separate from the rest of the Swift sample especially well in color space. While the spectroscopic classification announcements for neither SN 2008Q (Stanishev, 2008) nor SN 2008hv (Marion, Garnavich & Gerardy, 2008; Challis & Hora, 2008; Folatelli & Forster, 2008) mention C II 6580, the pre-maximum spectra of both objects include the absorption notch signature (V. Stanishev and G. H. Marion, private communication). Both Ganeshalingam et al. (2010) and Brown et al. (2010) report a faster-than-average decline rate (corresponding roughly to of and respectively) for SN 2008Q, suggesting that it could also belong with the fast-decliner/blue-color family. Optical light curve analysis for SN 2008hv is yet to be published, but a preliminary decline-rate estimate from the UVOT photometry appears to be faster than average.
Next, we consider whether normal SNe Ia with previous C II 6580 detections in the literature have a tendency towards narrow light curves and blue colors. A revisit of Parrent et al. (2011) yields mixed results, partially because of the lack of consistent light-curve fits across all the data sets. Of the 2 “definite” cases presented there, SN 1990N fails to fit the pattern (); the other is SN 2006D. The “probable” category (where data are available) is dominated by narrower light curves than average as well, but no strong tendency toward blue colors. The exact role that host galaxy dust extinction plays in the Parrent et al. (2011) sample is unconstrained, however. Overall, it would seem that the picture for unburned carbon in SNe Ia may be a complex one, where there are multiple subclasses and considerable variation between them.
Four of the 5 newly identified carbon-positive SNe Ia may indeed be representative of a meaningful subclass, but SN 2005cf stands apart. Its light curve shape is less extreme and its colors more red. It also lacks the large UV excess of SNF20080514-002 seen in Figure 8. HV ejecta signatures in the spectra of SN 2005cf are much stronger than in the other carbon-positive SNe Ia considered here. Though HV Ca II features may be “ubiquitous” (Mazzali et al., 2005), it is clear that there is considerable variation in the velocities and line strengths observed. Cases with the strongest HV Ca II IR triplet also seem to exhibit strong Si II 6355 absorption early on (Stanishev et al., 2007). The origin of the HV features remains unclear (Is it a density or composition enhancement in the ejecta, or is it swept-up circumstellar material? See e.g., Gerardy et al., 2004; Tanaka et al., 2008; Wang et al., 2009b). Evidence for a connection between carbon and the HV features is weak. The best candidate aside from SN 2005cf with HV features and a possible C II 6580 notch seems to be SN 2003du (Stanishev et al., 2007; Tanaka et al., 2008). On the other hand, SN 2009ig (also with HV features), appears to be a counter-example (not a distinct notch, so Parrent et al., 2011, label it at most a “possible” detection). SNF20071021-000, the non-detection example in Figure 4 is yet another.
A number of “peculiar” SNe Ia (or SN Ia-like objects) with carbon lines have been discussed in the literature. Here we compare our sample of normal SNe Ia with those objects.
C II features are a spectroscopic bellwether of candidate super-Chandrasekhar SNe Ia, where they seem to persist to maximum light and even beyond (Howell et al., 2006; Hicken et al., 2007; Scalzo et al., 2010; Yamanaka et al., 2009; Silverman et al., 2010). This has been interpreted as evidence supporting the super-Chandrasekhar hypothesis, where more total carbon is present in the progenitor and/or much remains after disruption. These objects are quite overluminous, and have much broader than normal light curves. Their spectra, while mostly consistent with one another, are quite different from those of objects considered here. Overall, if the super-Chandrasekhar candidates form a subclass of SNe Ia, it is distinct from the one proposed here.
With varying degrees of certainty, carbon is also occasionally detected in low-luminosity, short time-scale, or otherwise peculiar SNe Ia. Taubenberger et al. (2008) claim that C II 6580 is present in the spectra of SN 2005bl, a low-luminosity SN 1991bg-like SN Ia, but carbon is seldom remarked upon or observed in other members of this subclass. More unusual events like SN 2002cx (Li et al., 2003; Branch et al., 2004), SN 2005hk (Chornock et al., 2006; Phillips et al., 2007), SN 2007qd (McClelland et al., 2010), and SN 2008ha (Foley et al., 2009, 2010a; Valenti et al., 2009) have been conjectured to represent a distinct population of peculiar, low-luminosity SNe Ia. These SNe are quite sub-luminous (peak ), have light curves that evolve more rapidly than normal SNe Ia, and have spectra that exhibit many narrow absorption lines that suggest lower kinetic energies than typical. Pure white dwarf deflagrations or failed deflagrations may provide a plausible way to account for those observations, in which case carbon signatures may also be expected (e.g., Röpke et al., 2007). The carbon identifications in the spectra of these events are irregular, tentative in most cases, though SN 2008ha presents the most clear C II signatures (Foley et al., 2010a). Spectra of candidate “SNe .Ia” (Bildsten et al., 2007) SN 2002bj (Poznanski et al., 2010) and SN 2010X (Kasliwal et al., 2010) exhibit robust C II detections, but so far detailed simulations of SNe .Ia (Shen et al., 2010) do not predict observable carbon. All of the above cases are much dimmer than the SNe considered here, and much more exotic spectroscopically.
SN 2006bt (Foley et al., 2010b), however, merits specific attention. An outlier on the SN Ia light-curve-width/luminosity relation, SN 2006bt exhibits some spectroscopic peculiarities. Most interestingly, its earliest spectra possess a unique C II 6580 signature, a notch centered at km s-1, apparent in at least 2 consecutive observations. There is little, if any, evidence for emission to the red of the notch, and the vast difference between the apparent blueshift of the C II 6580 notch and the velocities of other ejected elements ( km s-1 for Si II 6355) is quite striking. Foley et al. (2010b) suggest that the discrepancy can be accounted for by an ejected blob moving at an angle to the line of sight. SN 2006bt at the present seems to be the strongest evidence for carbon ejecta distributed nonspherically in SNe Ia.
5.3. Geometry
Inspired by the characteristics of multi-dimensional explosion simulations with strong asymmetries, observers have searched for spectroscopic and spectropolarimetric indications of deviation from spherical composition symmetry in SNe Ia. Spectropolarimetry offers the best means for probing the geometry of SN ejecta, but opportunities for follow-up are relatively rare and the available sample is small. Wang & Wheeler (2008) describe spectropolarimetric observations of 2 SNe Ia in our carbon-positive sample, SNe 2005cf and 2005el (a single epoch each). In neither case is there a particularly strong case for deviation from basically spherical composition symmetry. A dominant axis in the Stokes Q/U diagram is at least identifiable for SN 2005el, suggestive of some combination of global and smaller scale asymmetries.
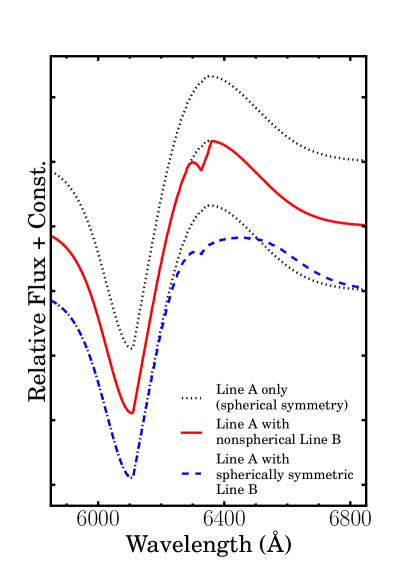
While spectropolarimetry may be more definitive for constraining the geometry of the unburned material, it is interesting to consider the constraints we can set with our pure flux measurements. The comparison of synthetic spectra with and without C II shown in Figure 7 suggests that the spatial distribution of unburned carbon in the ejecta may be quite consistent with spherical symmetry. Figure 12 demonstrates our reasoning simply, using toy model synthetic line profiles.
The classic SN spectroscopic feature formed by a single line is plotted at the top of Figure 12: Blueshifted absorption produced by material in front of the photosphere and expanding toward the observer, with an emission hump centered at the rest wavelength of the line arising from material adjacent to the photosphere in projection. For discussion purposes, we label this line “line A” and assign it a rest wavelength of 6355 Å.
Consider a second line, “line B” with rest wavelength 6580 Å, a Doppler shift of km s-1, a shift quite similar to the cases seen in the data. If the ejecta bearing the parent ions of line B are distributed in a “blob” that only partially covers the photosphere and/or line A emissivity in projection, it is quite easy to construct a line B absorption notch blended with the line A emission component. An example of the resulting blend appears in the middle of Figure 12, overlaid on the line A profile.
Now, suppose the line B ions are distributed spherically symmetrically. In this case, a quite different blended profile results. Line B notches can be produced, but not without additional disruption of the line A profile. Flux redward of the notch is suppressed and there is even a mild red emission feature relative to the single unblended line A case. Such a blend is depicted at the bottom of Figure 12, again overlaid on the single line A profile for comparison.
Because line B opacity does not encircle the photosphere in the blob case, its effect is restricted to wavelengths corresponding roughly to where the blob is optically thick in blueshift parallel to the line of sight. However, when line B ions are distributed under spherical symmetry, the photosphere is cocooned by them, and they scatter away continuum and line A photons alike over a larger range of projected velocity. This results in the notch, the flux suppression to the red of it, and the small emission further on. Essentially, the driving factor is the projected area over which line B photons screen continuum but also line A emissivity, at a given wavelength.
The fits in Figure 7 appear more consistent with the spherically symmetric case demonstrated in Figure 12. Our toy models are quite simple, but illustrate the leading-order screening effect quite clearly. At the very least, our results highlight the critical need for detailed spectroscopy and spectropolarimetry of SNe Ia at early phases to make the most definitive conclusions about the geometry of the carbon ejecta.
5.4. Implications for Explosion Models
The possible existence of a family of SNe Ia with similar properties to those demonstrated by SN 2005el, SN 2005ki, SNF20080514-002, and perhaps SN 2005di, is particularly intriguing. The combination of a narrow light curve, large UV excess or at least blue colors, and the presence of photospheric velocity carbon suggests a very particular conceptual picture. A faster than average decline rate indicates lower than average luminosity for a SN Ia, in turn suggesting a lower than average mass of freshly synthesized radioactive nickel. The blue colors suggest that the amount of iron-peak elements synthesized or mixed into the outer layers is low (suppressing line-blanketing at shorter wavelengths), and these elements are limited to lower velocities. Also, a relatively high carbon abundance in the material above the photosphere indicates less efficient processing of the white dwarf progenitor material.
The above picture is somewhat consistent with a subset or region of delayed-detonation model space. Estimates of the mass fraction of photospheric carbon in SNe Ia are generally low (of order 1%, e.g. Branch et al., 2003; Marion et al., 2006; Thomas et al., 2007; Tanaka et al., 2008; Maeda et al., 2010a), and are also generally consistent with most such models. Of particular interest is the recent grid of multi-dimensional models presented by Kasen, Röpke & Woosley (2009). In these models, a strong ignition (arising from numerous initiating sparks) raises the amount of burning that takes place during the initial sub-sonic deflagration phase. This allows the outer, unburned layers to pre-expand more relative to the weaker ignition case. When the later detonation wave passes through the pre-expanded material, nuclear burning is less efficient and the abundance of iron-peak elements is lower relative to the weak ignition case. This results in relatively lower radioactive nickel mass which is more centrally peaked in the ejecta.
However, the total amount of unburned carbon left in these models is below 1% by mass, and the S/N of the synthesized Monte Carlo spectra is too low to attempt to detect any carbon signatures in them. This result is actually at variance to earlier (one-dimensional) delayed-detonation models (e.g., Höflich et al., 2002), where some amount of unburned carbon can be left behind. Simply put, the multi-dimensional model grids may not yet be extensive enough.
In most of the carbon-positive SNe Ia discussed here, there seems to be intriguing evidence that the carbon is distributed roughly spherically symmetrically, and at velocities overlapping silicon. There may still be room for deviation from spherical symmetry in the distribution of unburned material that we cannot rule out here. For example, large scale asymmetries, such as proposed by Maeda et al. (2010b) to explain spectroscopic diversity, may allow for almost hemispherical covering of the photosphere by carbon. In that particular picture, an offset ignition in the white dwarf progenitor yields an asymmetric distribution of burning products. This scenario is proposed to explain the origin of “high-velocity gradient” (HVG) and “low-velocity gradient” (LVG) subclasses of SNe Ia, segregated by the rate of decrease in measured Si II 6355 blue-shift with time (Benetti et al., 2005). Viewed from the side closest to the ignition, one observes an LVG SN Ia; and viewed from the other an HVG SN Ia. Detonation products are distributed in the outer layers in all directions, but it is not yet clear how complete the burning is. Interestingly, Tanaka et al. (2008) remarked that of 3 LVG SNe Ia they studied, all had marginally detected C II 6580, and blue colors. Their analysis suggests that LVG SNe Ia undergo less intense burning than their counterparts. A systematic examination of Si II 6355 blueshift evolution of SNfactory SNe Ia is in progress, but our preliminary results indicate that all 5 objects identified here are also LVG members. Whether or not a Maeda et al. (2010b) scenario is capable of explaining all the observables, and can yield carbon amounts and distributions consistent with observations, remains to be seen through detailed multi-dimensional explosion modeling and radiative transfer.
6. Conclusion
We have presented new detections of carbon signatures in the spectra of several SNe Ia. For the most part, the carbon-positive SNe are normal spectroscopically, with the only significant deviation being the presence of HV Ca II and Si II in one of them. Four of the 5 objects discussed may form a robust subfamily of SNe Ia with a relatively fast decline rate and intrinsically blue colors. The carbon is detected at velocities consistent with the ejection velocity at the photosphere, and in the same velocity range as other freshly synthesized material. The distribution of carbon is apparently consistent with spherical or near-spherical symmetry. The behavior of most of the carbon-positive SNe Ia discussed here suggests strong radial abundance stratification, consistent with some delayed detonation models.
Only one of the objects uncovered in the course of our analysis has ever been previously identified in the literature as carbon-positive, either at the time of initial spectroscopic classification or in subsequent analysis. Our intent in pointing this out is not to criticize; indeed we have highlighted cases that earlier escaped our notice as well. Rather, we suggest that the C II 6580 notch signature is not well-known, easy to overlook, or easy to mistake for a reduction artifact. In fact, this is part of why we required 2 spectra for labeling detections as definitive. The examples provided here should help to sensitize observers to carbon signatures in early-phase SN Ia spectra.
Understanding the frequency, distribution, and amount of unburned carbon in SNe Ia is indeed a useful discriminator among competing explosion models, so constraints on theory depend on reliable and efficient early triggering of spectroscopic (and spectropolarimetric) follow-up of SNe Ia for detailed study. As current SN Ia cosmology efforts approach their limits in terms of calibration and empirical standardization, enhancing our understanding of SN Ia physics becomes all the more important. Wide-field and high-throughput robotic surveys have the power to grow the early-time data set, when coupled efficiently with ample spectroscopic follow-up resources. This opens new opportunities for fully exploiting the analysis of the outer layers of SN Ia ejecta to constrain explosion models.
Appendix A Notes on Individual Supernovae
A.1. SN 2005di
C II. The C II 6580 absorption notch is clearly visible in the d spectrum, located between roughly and km s-1 with a minimum around km s-1 in apparent blueshift. Almost 3 days later, the notch is barely discernible, and it is clearly absent by d. In the last spectrum, it is unlikely that the noise is obscuring a notch: The change in the shape of the spectrum between the last 2 spectra is overt. Examining the C II 7234 region, we detect an inflection in the shape of all 3 spectra, but its position is inconsistent across phase. This inconsistency may be a consequence of the low S/N of the observations. In the first spectrum, the flux depression is coincident with the 6580 notch in blueshift, but this is not the case in the later spectra. However, in all 3 spectra, a bump in the flux centered at a 7234 blueshift of km s-1 is clearly visible. Figure 3a also clearly shows the narrow rest-frame Na I D absorption, in the shaded rectangle.
SYNAPPS Fits. C II contributes to the spectrum on d and also in the next spectrum on d, but on d SYNAPPS finds no need for it. The SYNAPPS velocity at the photosphere () fits are , , and km s-1 respectively. HV Ca II opacity is invoked (at km s-1) though the signature is rather small — it is more important for fitting the IR triplet than the UV H&K feature. Ultimately, the case for HV Si II is uncompelling, which is not surprising since the blue side of the Si II 6355 absorption only extends to km s-1, in contrast to instances where HV Si II has been previously discussed (e.g., SN 2005cf, Garavini et al., 2007) and found to extend upwards of km s-1.
A.2. SN 2005el
C II. A C II 6580 absorption notch is readily seen in the d spectrum. As in SN 2005di, the notch is located in the apparent blueshift interval to km s-1. There is a clear depression in the flux around 6980 Å, possibly attributable to C II 7234 absorption, though the blueshift is not completely consistent with that for the 6580 notch. Both features disappear from the spectrum by the time of maximum light. As in SN 2005di, the red side of the Si II emission feature steepens as the SN ages and the C II 6580 dissipates. There is also an emission bump to the red of the 7234 notch, centered at a rest-frame blueshift of km s-1. Like the 2 notches, this bump disappears by maximum light.
SYNAPPS Fits. SYNAPPS requires C II only in the d spectrum, and not at maximum light. The value of changes from to km s-1 from the first spectrum to the second. HV Ca II and Si II opacity components were enabled as was done with SN 2005di. The results were similar, with some HV Ca II contributing to the IR triplet and the bluer feature of the H&K absorption blend, and HV Si II making only a minor contribution to the blue wing of the Si II 6355 absorption in the first spectrum.
A.3. SN 2005ki
C II. In the d spectrum, the C II 6580 notch appears slightly more blueshifted than in the first spectra of SNe 2005di and 2005el, extending just beyond km s-1. The same is true for Si II 6355 absorptions. As before, the carbon signatures dissipate as the SN brightens: Weaker by d and absent by d. Also, in the first spectrum, an emission plateau just redward of the notch is visible, asymmetric with respect to the rest wavelength of 6580, and again it weakens in parallel with the notch. A clear association for C II 7234 in this spectrum is quite problematic: The fading bump at 7100 Å is again visible, but there is no clear absorption notch.
SYNAPPS Fits. C II opacity is used in the and d spectra, but not in the d spectrum. SYNAPPS photospheric velocities for SN 2005ki are a bit higher than in the other SNe considered here, with fit at , , and km s-1. One major difference is that a distinct HV Ca II opacity component is not required to reproduce the Ca II features, especially at d: A single opacity profile extending to high velocity is sufficient.
A.4. SNF20080514-002
C II. The C II 6580 notch (apparent blueshift interval again to km s-1) is most apparent at and d, still discernable at d, and probably absent at d. The notch is accompanied by a modest and fading emission plateau to the red which is almost symmetric about the line rest wavelength. The 7234 blueshift region is again characterized by an inflection and bump centered blueward of 7234 Å, and again the strength of this bump decreases with time.
SYNAPPS Fits. C II opacity is needed in the , , and d fits, but not on day . The values of fit are , , and km s-1, respectively. Only a modest amount of HV Ca II opacity is used in these fits, and HV Si II proves to be unnecessary.
A.5. SN 2005cf
C II. The C II 6580 absorption notch shape is significantly different from that seen in the other carbon-positive SNe Ia studied here. The notch is more narrow, extending in apparent blueshift from to km s-1 in the d spectrum. The notch as faded away by d, a phase at which it is still present in the other carbon-positive SNe studied here.
SYNAPPS Fits. SYNAPPS uses C II for the d spectrum but not for the spectrum obtained a week later. SYNAPPS determines and then km s-1, respectively. The d spectrum requires both HV Si II and Ca II, though the HV Si II feature becomes optically thin by d. The HV component is also clearly quite important for the formation of the Ca II H&K absorption in both spectra. The strength of the HV features in SN 2005cf distinguishes it from the other SNe Ia considered here.
References
- Abazajian et al. (2009) Abazajian, K. N., et al., 2009, ApJS, 182, 543
- Aldering et al. (2002) Aldering, G., et al., 2002, SPIE, 4836, 61
- Aldering et al. (2006) Aldering, G., et al. 2006, ApJ, 650, 510
- Astier et al. (2006) Astier, P., et al., 2006, A&A, 447, 31
- Bacon et al. (1995) Bacon, R., et al., 1995, A&AS, 113, 347
- Bacon et al. (2000) Bacon, R., et al., 2000, in ASP Conf. Ser. 195, Imaging the Universe in Three Dimensions, ed. W. van Breugel & J. Bland-Hawthorn (San Francisco: ASP), 173
- Bacon et al. (2001) Bacon, R. et al. 2001, MNRAS, 326, 23
- Bailey et al. (2009) Bailey, S., et al., 2009, A&A, 500L, 17
- Benetti et al. (2005) Benetti, S., et al., 2005, ApJ, 623, 1011
- Bildsten et al. (2007) Bildsten, L., Shen, K. J., Weinberg, N. N., & Nelemans, G., 2007, ApJ, 662, 95
- Blondin et al. (2011) Blondin, S., Mandel, K. S., & Kirshner, R. P., 2011, A&A, 526, A81
- Branch et al. (2003) Branch, D., et al., 2003, AJ, 126, 1489
- Branch et al. (2004) Branch, D., et al., 2004, PASP, 116, 903
- Branch et al. (2005) Branch, D., et al., 2005, PASP, 117, 545
- Branch, Dang & Baron (2009) Branch, D., Dang, L., & Baron, E., 2009, PASP, 121, 238
- Branch, Fisher & Nugent (1993) Branch, D., Fisher, A., & Nugent, P., 2007, A&A, 466, 11
- Brown (2009) Brown, P. J., 2009, Ph.D. thesis, The Pennsylvania State University
- Brown et al. (2010) Brown, P. J., et al., 2010, ApJ, 721, 1608
- Burns et al. (2011) Burns, C. R., et al., AJ, 141, 19
- Cameron (2010) Cameron, E., 2010, PASA, accepted (arXiv:1012.0566)
- Cardelli et al. (1989) Cardelli, J. A., Clayton, G. C., & Mathis, J. S., 1989, ApJ, 345, 245
- Challis & Hora (2008) Challis, P., & Hora, J., 2008, CBET, 1604
- Chornock et al. (2006) Chornock, R., et al., 2006, PASP, 118, 722
- Contreras et al. (2010) Contreras, C., et al., 2010, AJ, 139, 120
- de Vaucouleurs et al. (1991) de Vaucouleurs, G., et al., 1991, Third Reference Catalogue of Bright Galaxies, Version 3.9
- Fakhouri et al. (2011) Fakhouri, H. K., 2011, BAAS, 217, 337.13
- Filippenko (1997) Filippenko, A. V., 1997, ARA&A, 35, 309
- Filippenko et al. (2001) Filippenko, A. V., et al., 2001, ASPC, 246, 121
- Fisher (2000) Fisher, A., 2000, Ph. D. Thesis, University of Oklahoma
- Folatelli & Forster (2008) Folatelli, G., & Forster, F., 2008, CBET, 1615
- Foley et al. (2009) Foley, R. J., et al., 2009, AJ, 138, 376
- Foley et al. (2010a) Foley, R. J., et al., 2010a, ApJ, 708, 61
- Foley et al. (2010b) Foley, R. J., et al., 2010b, ApJ, 708, 1748
- Foley & Kasen (2011) Foley, R. J. & Kasen, D., 2011, ApJ, 729, 55
- Gal-Yam, Sand & Leonard (2005) Gal-Yam, A., Sand, D., & Leonard, D., 2005, ATel, 581
- Gamezo et al. (2003) Gamezo, V., et al., 2003, Science, 299, 77
- Ganeshalingam et al. (2010) Ganeshalingam, M., et al., 2010, ApJS, 190, 418
- Garavini et al. (2004) Garavini, G., et al., 2004, AJ, 128, 387
- Garavini et al. (2007) Garavini, G., et al., 2007, A&A, 471, 527
- Gehrels et al. (2004) Gehrels, N., et al., 2004, ApJ, 611, 1005
- Gerardy et al. (2004) Gerardy, C. L., et al., 2004, ApJ, 607, 391
- Goldhaber et al. (2001) Goldhaber, G., et al., 2001, ApJ, 558, 359
- Gray & Kolda (2005) Gray, G., & Kolda, T., 2005, ACM Trans. Math Software, 32, 485
- Griffin & Kolda (2006) Griffin, J., & Kolda, T., 2006, (SAND2006-4621; Albuquerque: Sandia)
- Guy et al. (2007) Guy, J., et al., 2007, A&A, 466, 11
- Hauschildt, Baron & Allard (1997) Hauschildt, P. H., Baron, E., & Allard, F., 1997, ApJ, 483, 390
- Hicken et al. (2007) Hicken, M., et al., 2007, ApJ, 669, 17
- Hicken et al. (2009) Hicken, M., et al., 2009, ApJ, 700, 1097
- Hicken et al. (2009) Hicken, M., et al., 2009, ApJ, 700, 331
- Hillebrandt & Niemeyer (2000) Hillebrandt, W. & Niemeyer, J. C., 2000, ARA&A, 38, 191
- Hillier & Miller (1998) Hillier, D. J., & Miller, D. L., 1998, ApJ, 496, 407
- Höflich et al. (1990) Höflich, P., 1990, A&A, 229, 191
- Höflich et al. (2002) Höflich, P., et al., 2002, ApJ, 568, 791
- Höflich et al. (2010) Höflich, P., et al., 2010, ApJ, 710, 444
- Howell et al. (2006) Howell, D. A., et al., 2006, Nature, 443, 308
- Immler & Brown (2008) Immler, S., & Brown, P. J., 2008, ATel, 1535
- Jeffery & Branch (1990) Jeffery, D. J., & Branch, D., 1990, in Supernovae, Jerusalem Winter School for Theoretical Physics, ed. J. C. Wheeler, T. Piran, & S. Weinberg (Singapore: World Scientific), 149
- Kasen, Thomas & Nugent (2006) Kasen, D., Thomas, R. C., & Nugent, P., 2006, ApJ, 651, 366
- Kasen, Röpke & Woosley (2009) Kasen, D., Röpke, F. K., & Woosley, S. E., 2009, Nature, 460, 869
- Kasliwal et al. (2010) Kasliwal, M. M., et al., 2010, ApJ, 723, 98
- Kolda (2005) Kolda, T., 2005, SIAM J. Optim., 16, 563
- Kowalski et al. (2008) Kowalski, M., et al., 2008, ApJ, 686, 749
- Lantz et al. (2004) Lantz, B., et al., 2004, Proc. SPIE, 5249, 146
- Ponticello & Li (2005) Ponticello, N. J., & Li, W., 2005, CBET, 294
- Li et al. (2001) Li, W., et al., 2001, ApJ, 546, 734
- Li et al. (2003) Li, W., et al., 2003, PASP, 115, 453
- Madison, Baek & Li (2005) Madison, D. R., Baek, M., & Li, W., 2005, CBET, 233
- Maeda et al. (2010a) Maeda, K., et al., 2010, ApJ, 712, 624
- Maeda et al. (2010b) Maeda, K., et al., 2010, Nature, 466, 82
- Mandel et al. (2009) Mandel, K. S., et al., 2009, ApJ, 704, 629
- Mannucci et al. (2005) Mannucci, F., et al., 2005, A&A, 433, 807
- Marion et al. (2006) Marion, G. H., et al., 2006, ApJ, 645, 1392
- Marion, Garnavich & Gerardy (2008) Marion, G. H., Garnavich, P., & Gerardy, C. L., 2008, CBET, 1603
- Marion et al. (2009) Marion, G. H., et al., 2009, AJ, 138, 727
- Mathewson & Ford (1996) Mathewson, D. S., & Ford, V. L., 1996, ApJS, 107, 97
- Mazzali et al. (2005) Mazzali, P. A., et al., 2005, ApJ, 623, 37
- McClelland et al. (2010) McClelland, C. M., et al., 2010, ApJ, 720, 704
- Milne et al. (2010) Milne, P. A., et al., 2010, ApJ, 721, 1627
- Modjaz et al. (2005) Modjaz, M., Kirshner, R., Challis, P., & Berlind, P., 2005, CBET, 160
- Morrell, Folatelli & Hamuy (2005) Morrell, N., Folatelli, G., & Hamuy, M., 2005, CBET, 245
- Parrent et al. (2011) Parrent, J., et al., 2011, ApJ, 732, 30
- Perlmutter et al. (1999) Perlmutter, S., et al., 1999 ApJ, 517, 565
- Phillips et al. (2007) Phillips, M. M., et al., 2007, PASP, 119, 360
- Pignata et al. (2008) Pignata, G., et al., 2008, CBET, 1601
- Poznanski et al. (2010) Poznanski, D., et al., 2010, Science, 327, 58
- Poznanski et al. (2011) Poznanski, D., et al., 2011, MNRAS, in press (arXiv:1106.1469)
- Pugh & Li (2005a) Pugh, H. & Li, W., 2005a, CBET, 158
- Pugh & Li (2005b) Pugh, H. & Li, W., 2005b, CBET, 198
- Rau et al. (2009) Rau, A., et al., 2009, PASP, 121, 1334
- Riess et al. (1998) Riess, A., et al., 1998, AJ, 116, 1009
- Riess et al. (2007) Riess, A., et al., 2007, ApJ, 659, 98
- Roming et al. (2005) Roming, P. W. A., et al., 2005, Space Sci. Rev., 120, 95
- Röpke & Hillebrandt (2005) Röpke, F. K. & Hillebrandt, W. 2005, A&A, 431, 635
- Röpke et al. (2007) Röpke, F., et al., 2007, ApJ, 668, 1132
- Salvo et al. (2005) Salvo, M., et al., 2005, CBET, 200
- Savitzky & Golay (1964) Savitzky, A. & Golay, M. J. E., 1964, Analytical Chemistry, 36, 1627
- Scalzo et al. (2010) Scalzo, R. A., et al., 2010, ApJ, 713, 1073
- Scannapieco & Bildsten (2005) Scannapieco, E., & Bildsten, L., 2005, ApJ, 629, 85
- Schlegel et al. (1998) Schlegel, D. J., Finkbeiner, D. P., & Davis, M., 1998, ApJ, 500, 525
- Schwehr & Li (2006) Schwehr, J. & Li, W., 2006, CBET, 568
- Shen et al. (2010) Shen, K. J., et al., 2010, ApJ, 715, 767
- Silverman et al. (2010) Silverman, J. M., et al., 2010, MNRAS, 410, 585
- SNfactory (2005) The Nearby Supernova Factory, 2005, ATel, 659
- SNfactory (2008a) The Nearby Supernova Factory, 2008a, ATel, 1532
- SNfactory (2008b) The Nearby Supernova Factory, 2008b, ATel, 1624
- Stanishev et al. (2007) Stanishev, V., et al., 2007, A&A, 469, 645
- Stanishev (2008) Stanishev, V., 2008, CBET, 1232
- Sullivan et al. (2006) Sullivan, M., et al., 2006, ApJ, 648, 868
- Sullivan et al. (2011) Sullivan, M., et al., 2011, ApJ, submitted (arXiv:1104.1444)
- Suzuki et al. (2011) Suzuki, N., et al., 2011, ApJ, submitted (arXiv:1105.3470)
- Tanaka et al. (2008) Tanaka, M., et al., 2008, ApJ, 677, 448
- Taubenberger et al. (2008) Taubenberger, S., et al., 2008, MNRAS, 385, 75
- Thomas et al. (2007) Thomas, R. C., et al., 2007, ApJ, 654, 53
- Thomas, Nugent & Meza (2011) Thomas, R. C., Nugent, P. N., & Meza, J. C., 2011, PASP, 123, 237
- Valenti et al. (2009) Valenti, S., et al., 2009, Nature, 459, 674
- Villi et al. (2008) Villi, M., et al., 2008, CBET, 1228
- Wang & Wheeler (2008) Wang, L. & Wheeler, J. C., 2008, ARA&A, 46, 433
- Wang et al. (2009a) Wang, X., et al., 2009a, ApJ, 699, 139
- Wang et al. (2009b) Wang, X., et al., 2009b, ApJ, 697, 380
- Wood-Vasey et al. (2007) Wood-Vasey, W. M., et al., 2007, ApJ, 666, 694
- Wood-Vasey et al. (2008) Wood-Vasey, W. M., et al., 2008, ApJ, 689, 377
- Wong et al. (2005) Wong, D. S., et al., 2005, CBET, 235
- Yamanaka et al. (2009) Yamanaka, M., et al., 2009, ApJ, 707, 118