The study of the proton-proton collisions at the beam momentum 1628 MeV/c
Abstract
The detailed investigation of the single pion production reactions and at the incident proton momentum 1628 MeV/c has been carried out. The data are analyzed in the framework of the event-by-event maximum likelihood method together with the data measured earlier in the energy region below 1 GeV. At 1628 MeV/c the largest contributions stem from the , , , and initial partial waves.
pacs:
13.75.Cs Nuclon-nucleon interactions and 13.85.Lg Total cross sections and 25.40.Ep Inelastic proton scattering1 Introduction
Nucleon-nucleon interaction is one of the most important processes in nuclear and particle physics and extensively has been studied over a wide energy range. The single pion production in the interactions is the main inelastic process at energies below 1 GeV. Despite the fact that a lot of experiments have been performed, many questions on this process are not yet answered. One of them is the question about a contribution of the isoscalar () channel to the inelastic neutron-proton collisions. Since the neutron-proton scattering amplitude contains both isoscalar and isovector () parts, a detailed investigation of the single pion production in the collisions (isovector contribution only) might give the most accurate information about the isovector channel which, in combination with the neutron-proton data, would allow one to extract correctly the contribution of the isoscalar channel.
Various theoretical models, more or less successful, were put forward while the data on the pion production in the collisions were accumulated. Most of them are constructed for the energy region near the production threshold and can not be applied at higher energies. For the energy range about 1 GeV the one-pion exchange (OPE) model 1 assumes a dominance of the one-pion exchange contribution to the inelastic amplitude. Pole diagram matrix elements were calculated using a beforehand form factor. The form factor function was obtained by fitting experimental data, so in fact this was a semiphenomenological model. In addition, only the P33 partial wave was taken into account in the intermediate N channel 2 . Nevertheless, this model predicts (up to a normalization factors) with a reasonable accuracy the differential spectra of the and reactions in the energy range 600-1300 MeV 2 ; 3 . At the same time discrepancies between the measured total cross sections for these reactions and the model predictions are sizeable enough.
It should be noted that the experimental data on the differential spectra of pp pp reaction near the energy of 1 Gev are more scarce than the data for pp pn channel. The KEK data Shimizu:1982dx contain the information on total cross sections only. Our data on the differential spectra of the pp pp reaction at the energies 990 MeV and 900 MeV were published earlier 5 . It would be important to perform an accurate measurement of the differential cross sections in the middle of this energy region. Here we present our investigation of the pp pn and pp pp reactions at 940 MeV and determine contributions from various partial waves to the single pion production processes.
2 Experiment
The experiment was performed at PNPI 1 GeV synchrocyclotron. The events were registered by a 35 cm hydrogen bubble chamber disposed in the 1.48 T magnetic field. The proton beam (after corresponding degrader for the momentum 1628 MeV/c) was formed by three bending magnets and by eight quadrupole lenses. The incident proton momentum value was inspected by the kinematics of the elastic scattering events. The accuracy of the incident momentum value and momentum spread was about 0.5 MeV/c and 20 MeV/c (FWHM) correspondingly. A total of stereoframes were obtained. The frames were double scanned to search for events due to an interaction of the incident beam. The double scanning efficiency was determined to be 99.95%. Approximately 8 two-prong events were used for subsequent analysis.
The 2-prong events selected in the fiducial volume of the chamber were measured and geometrically reconstruc- ted. The reconstructed events were kinematically fitted to the following reaction hypotheses:
| (1) | |||||
| (2) | |||||
| (3) | |||||
| (4) | |||||
| (5) |
The identification of the events was performed on the criteria with confidence level less then 1. If the event had a good for the elastic kinematic (4C-fit), it was considered as elastic one. Stretch functions for the three kinematical variables of a track (the inverse of the momentum, the azimuthal and dip angles) were examined for elastic scattering events to make sure that their errors and the error for bubble chamber magnetic field were properly given. If there was only one acceptable fit for the event it was identified as belonging to this hypothesis (with a check of stopping track on the presence of the decay). If several inelastic versions revealed a good , we used visual estimation of the bubble density of the track to distinguish between proton (deuteron) and pion. For few events, even after repeated measurements, the fit revealed only one acceptable hypothesis but with a large . If such event had less than 50 for the 4-constraint fit or less than 20 for the 1-constraint fit, it was taken into account for the calculation of the cross section value of the process corresponding to this hypothesis but not included in differential spectra.
There were events which failed to fit any hypothesis. These no-fit events were investigated on the scanning table, and most of them appeared to be events with a secondary track undergoing one more scattering near a primary vertex.
There were also events unfit for the measurements, e.g. events with a bad vertex or superimposed tracks. The number of such events was counted approximately to be 7%. The total number of 2-prong events which did not pass the measurement and fitting procedures was counted to be less than 10%. These unidentified events were apportioned to the fraction of the fitted hypotheses for the total cross section measurements.
Missing mass distributions for accepted events show clear peaks - at zero for the elastic scattering, at the mass squared for single neutral pion production and at the neutron mass squared for the process with neutron in the final state.
The standard bubble chamber procedure was used to obtain absolute cross sections 3 for the elastic and single pion production reactions. These values together with statistic of the events are listed in Table 1.
| pp | pp | pn | pp | d |
|---|---|---|---|---|
| events | 3442 | 3014 | 696 | 80 |
| mb | 21.20.7 | 17.60.6 | 4.480.20 | 0.470.05 |
3 Experimental results and discussion
3.1 Elastic scattering
The measured differential cross section of the elastic pp-scattering in c.m.s. of the reaction is shown in Fig. 1. The elastic cross section value given in Table 1 was calculated as where is the coefficient in front of the Legender polynomial in fitting the angular distribution by the Legender expansion in the angular range -0.950.95.

This range was chosen in order to take into account a loss of events due to forward elastic scattering when a slow proton had a short recoil path and could not be seen in the bubble chamber (at the momentum less than 80 MeV/c) or was missed under the scanning. This interval was determined by examining the stability of the Legender coefficients with decreasing fitted range of the angular distribution. Our value of the total elastic cross section is less than that given in works Shimizu:1982dx ; 6 approximately by 13. We do not know the reason for this discrepancy: it could arise due to i) an insufficient control of the loss of events with small scattering angles or ii) an uncorrect calculation of the millibarn-equivalent in the chamber. To control the loss of events in the forward scattering we use the short-cut range for fitting of the differential cross section which should repair this shortcoming. Of course we have about 7 unmeasured events which were apportioned to the fraction of the fitted hypotheses for the cross section calculations. But it is difficult to believe that the fraction of missing elastic events is much larger. The missing events have superimposed second tracks: this topology is not the elastic scattering one, except for events with disposition of the scattering plane strongly in the normal direction to the frame of a film. As concerns the millibarn-equivalent calculation, we would like to pay attention that the values for the single pion production cross sections given in Table 1 are in a fairly good agreement with the above mentioned work Shimizu:1982dx .
3.2 The single pion production reactions. Comparison with OPE model
The OPE model 1 ; 2 describes the single pion production reactions by four pole diagrams with the or exchanges. The main evidence for pole diagram contributions would be an observation of a peak in the momentum transfer distribution from the target particle to the secondary proton in the process or, for example, to the secondary neutron in the process. Since there is no difference between final protons in the reaction, it is difficult to separate the contribution from a certain diagram experimentally.
Figures 2, 3 show the square momentum transfer distribution for the and reactions, where and are four-momenta of the target proton and one of the final nucleons correspondingly. The OPE model calculations, normalized to the total number of experimental events, are shown there as dashed lines and phase space distribution as dotted ones.


One can see that the OPE model describes qualitatively well the distribution for both reactions studied. It is remarkable, because only the wave is taken into account in the intermediate scattering. It could be that this distribution is mainly sensitive to the pole diagram propagator and a more complicated structure of the amplitude manifests itself in other distributions.


Figs. 4 and 5 present angular distributions of the final particles in the c.m.s. of the reaction as well as particle momentum distributions in the laboratory frame for the and reactions correspondingly. One can see again that the agreement of the OPE calculations with the experimental data is fairly good. The qualitative agreement is also observed for other spectra, except for angle distributions of the final particles in the helicity system.
As noted earlier in 3 , although the OPE model provides a qualitative description of most differential spectra, it disagrees with the total cross section values for the and reactions. It means that taking into account the P33 ( isobar) intermediate state only is not enough for an adequate description of these reactions and a comprehensive partial wave analysis is needed.
4 Partial wave analysis
To extract contributions from different partial waves we apply an event-by-event partial wave analysis (PWA) based on the maximum likelihood method.
For the production of three particles with the 4-momenta from two particles colliding with 4-momenta and , the cross section is given by:
| (6) |
where is the reaction amplitude, is the 3-momentum of the initial particle calculated in the c.m.s. of the reaction, and is the invariant three-particle phase volume.
The total amplitude can be written as a sum of partial wave amplitudes as follows:
| (7) |
Here are spin, orbital momentum and total angular momentum of the system, are spin, orbital momentum and total angular momentum of the two-particle system in the final state and are spin and orbital momentum between two-particle system and the third particle with momentum . The invariant mass of two-body system can be calculated as . The multiindex denotes all possible combinations of the and , is the transition amplitude and describes rescattering processes in the final two-particle channel (e.g. the production of ). In this spin-orbital momentum decomposition we follow the formalism given in 7 ; 8 ; 9 . The exact form of the operators for the initial states and final states can be found in 9 . Following this decomposition, we use spectroscopic notation for the description of the initial state, the system of two final particles and the system ”spectator and two-particle final state”. For the initial system, the states with total momenta and angular momenta between two protons are taken into account. For the final three-particle system, we restrict ourselves in the fitting procedure by angular momenta and . Due to nonresonant nature of the system in the energy region investigated here, there is no factorization of initial and final vertices, and the transition amplitude depends on all quantum numbers which characterize a partial wave (index ). Moreover, due to contribution of the triangle singularities, the production parameters can be complex-valued. The best description was obtained with the parameterization:
| (8) |
where ’s are real values. The parameter corresponds to a pole situated in the region of left-hand side singularities of the partial wave amplitudes. It is introduced to suppress the growth of the amplitudes at large .
We have also used another, more complicated parameterizations of the transition amplitude. However, we obtained either worse description of the data or similar one, with larger number of fitting parameters. In the latter case, these results serve us to determine systematical errors for the various contributions to the cross sections. For the system in the intermediate state, we introduce two resonances, and Roper . For the , we use relativistic Breit-Wigner formula with mass and width taken from PDG. The Roper state was parameterized in agreement with Breit-Wigner couplings found in the analysis our-roper . Let us note that the present analysis is not sensitive to the exact parameterization of the Roper resonance: only the low energy tail of this state can influence the data.
For the description of the final interaction we use a modified scattering-length approximation formula:
| (9) |
where multiindex denotes possible combinations of kinematical channel and quantum numbers , and ; is the -scattering length and is the effective range of the system. The is the Blatt-Weisskopf form factor (it is equal to 1 for and the explicit form for other partial waves can be found, for example, in 8 ) and is the relative momentum in the final two-nucleon system. For the S-waves this formula corresponds exactly to the scattering length approximation suggested in watson ; migdal . The scattering length was fixed on value determined in the analysis 16 . In the analysis of the data the scattering length and effective range were fixed for S-waves at fm, fm and fm, fm.
4.1 The PWA results and discussion
We minimized the log-likelihood value fitting the present data on the and reactions taken at the proton momentum 1628 MeV/c together with obtained earlier data on 3 ; 5 ; tubingen . The data 3 ; 5 were taken at PNPI and measured at nine energies covering the energy interval from 600 up to 1000 MeV. The high statistics data at the momentum 950 MeV/c taken by the Tübingen group tubingen were included to fix the low energy region.

The experimental data (points with error bars) and the results of the partial wave analysis (histograms) for the momentum 1628 MeV/c are shown in Figs. 6 and 7. The first row shows angular distributions of the final particles in the rest frame of the reaction and the second row shows effective two-body mass spectra. It is seen that our partial wave analysis describes these distributions rather well.

The quality of the partial wave analysis is also demonstrated in angular distributions in the helicity (third row) and Godfrey-Jackson (fourth row) frames. These frames are the rest frames of two final particle systems. In the helicity frame the angle is calculated between one of the constituent particles and the spectator particle. This frame is mostly suitable for the investigation of cascade processes, when two colliding particles form a system (e.g. resonance) which decays into a final two-body system (e.g. another resonance) and a spectator. In the Godfrey-Jackson frame the angle is calculated between one of the constituent particles and the beam. This system is mostly suitable to study production of the two-particle system due to the -channel exchange mechanism.
The initial partial wave provides only a small contribution to the reaction at the incident proton momentum 1628 MeV/c. The largest contributions come from two P-wave initial states: and (see Table 2). The initial state contributes about 10% to the total cross section and we found notable contributions from the and partial waves. The partial wave interferes rather strongly with the strongest wave and its contribution is defined with a rather large error.
All initial partial waves decay dominantly into the intermediate state. The contribution of channels with production is varied for the different partial waves from 65 up to 90%. The strongest non-resonant contribution is observed from the initial state: here the transition contributed in different fits from 20 to 35% (from the contribution of the partial wave). This instability appears due to a notable interference in this channel between the and intermediate states.
In the reaction at 1682 MeV/c, the contribution of the production to the cross section is even stronger than in the case of the neutral pion production. The non-resonant partial waves with isospin 1 contribute much less to the total cross section. For example, the transition was found to be less than 10% from the contribution of the initial state. However we observed a notable transition which is a dominant one for the initial state and an appreciable contribution from the transition.
| pp pp | pp pn | ||
|---|---|---|---|
| 1.00.5 % | 5.82.8 % | ||
| 10.00.9 % | 11.50.9 % | ||
| 26.07.7 % | 32.70.8 % | ||
| 44.01.6 % | 34.01.6 % | ||
| 8.01.1 % | 8.51.0 % | ||
| 11.47.7 % | 6.31.5 % |
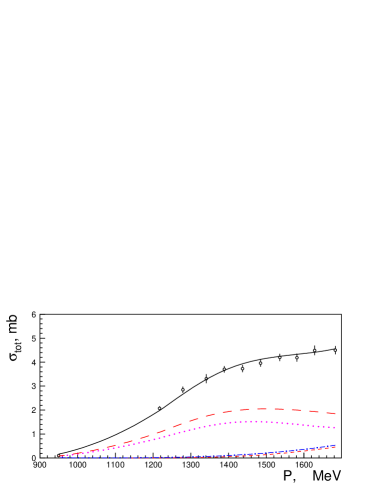
Our partial wave analysis defines relative contributions of the isovector waves to the total cross section of the single pion production processes at the energy interval 400–1000 MeV. Fig. 8 shows the experimental behavior of the cross section together with the result of the partial wave analysis and contributions of the dominant partial waves. It should be noted that although we use the data on the reaction at 1628 MeV/c only the found partial waves predict the total cross section at lower energies in a good agreement with values given in Shimizu:1982dx ).

The present measurement of the cross section for the reaction together with measurements of the cross section for the reaction allows us to obtain the isoscalar inelastic cross section by:
| (10) |
Figure 9 shows the result of such calculation at 1628 MeV/c using the value for the cross section interpolated from the experimental data 14 ; 15 (black square). The result of the work 16 where the partial wave analysis of the earlier data was performed together with the measurements taken with continues neutron beam is shown by the band. The isoscalar cross section calculated using the result of this analysis and new data at 1628 MeV is fully consistent with this band and is not shown here.
5 Conclusions
A detailed study of the differential cross section on the and reactions has been performed at the incident proton momentum 1628 MeV/c. The shape of the most distributions is described qualitatively well by the OPE model, although it fails to describe simultaneously the total cross sections for the and reactions.
The partial wave analysis of the single pion production reactions indeed reveals a dominant contribution from the intermediate state which explains a success of the OPE model. But, in addition, it allows us to obtain a combined description of all analyzed reactions and extract contributions from the transition amplitudes.
6 Acknowledgements
We would like to express our gratitude to the bubble chamber staff as well as to laboratory assistants, which toiled at the film scanning and measuring.
References
-
(1)
E. Ferrary and F. Selleri, Nuovo Cim. 27, 1450 (1963);
E. Ferrary and F. Selleri, Nuovo Cim. 21, 1028 (1961);
F. Selleri, Nuovo Cim. 40A, 236 (1965). - (2) V.K. Suslenko and I.I. Gaisak, Yad. Fiz. 43, 392 (1986).
- (3) V.P. Andreev et al., Phys. Rev. C 50, 15 (1994).
- (4) F. Shimizu, Y. Kubota, H. Koiso, F. Sai, S. Sakamoto, S. S. Yamamoto, Nucl. Phys. A386, 571 (1982).
- (5) V.V. Sarantsev et al., Eur. Phys. J. A 21, 303 (2004).
- (6) D.V. Bugg et al., Phys. Rev. 133, 1017 (1964).
- (7) A.V. Anisovich et al.,.Eur. Phys. J. A 24, 111 (2005).
- (8) A.V. Anisovich and A.V. Sarantsev, Eur. Phys. J. A 30, 427 (2006).
- (9) A.V. Anisovich et al., Eur. Phys. J. A 34, 129 (2007).
- (10) A.V. Sarantsev et al., Phys. Lett. B 659, 94 (2008).
- (11) K.M. Watson, Phys. Rev. 88, 1163 (1952).
- (12) A.B. Migdal, JETP 1, 2 (1955).
- (13) S. Abd El-Samad et al., Eur. Phys. J. A 30, 443 (2006).
- (14) V.V.Sarantsev et al., Eur. Phys. J. A 43, 11 (2010).
- (15) L.G. Dakhno et al., Phys.Lett. B 114, 409 (1982).
- (16) T. Tsuboyama et al., Nucl. Phys. A 486, 669 (1988).