Electron Transport Properties of Bilayer Graphene
Abstract
Electron transport in bilayer graphene is studied by using a first principles analysis and the Monte Carlo simulation under conditions relevant to potential applications. While the intrinsic properties are found to be much less desirable in bilayer than in monolayer graphene, with significantly reduced mobilities and saturation velocities, the calculation also reveals the dominant influence of extrinsic factors such as the substrate and impurities. Accordingly, the difference between two graphene forms are more muted in realistic settings although the velocity-field characteristics remain substantially lower in the bilayer. When bilayer graphene is subject to an interlayer bias, the resulting changes in the energy dispersion lead to stronger electron scattering at the bottom of the conduction band. The mobility decreases significantly with the size of the generated bandgap, whereas the saturation velocity remains largely unaffected.
pacs:
72.80.Vp,72.10.Di,72.20.Ht,73.50.DnI Introduction
Graphene has received much attention in the last few years due to its unique properties. In addition to the significant interests in fundamental physics, stemming in part from the relativistic-like behavior of the massless charge particles around the Dirac cone, this material is very attractive in many applications, particularly in high speed devices. Novoselov2004 ; Novoselov2005 ; Lin2010 ; Neto2009 However, the gapless electron spectrum of monolayer graphene (MLG) makes it difficult to turn off the electrical current due to tunneling. Bilayer graphene (BLG), on the other hand, can provide a finite band gap up to hundreds of meV, when the inversion symmetry between top and bottom layers is broken by an applied perpendicular electric field. McCann2006 ; Castro2007 ; Min2007 ; Zhang2009 A current on/off ratio of about 100 was observed at room temperature, Xia2010 offering a much needed control for nonlinear functionality. Unfortunately experimental studies have also indicated that the typical mobility of charge carriers in BLG may be substantially smaller than in MLG. Xiao2010 A recent work based on the first principles calculations has suggested that this discrepancy may start with the intrinsic transport properties, which results from substantial differences in electron-phonon coupling in these two materials. Borysenko2011 Additionally, it is widely accepted that extrinsic factors such as charged impurities, disorder, and surface polar phonons (SPPs) can significantly alter carrier transport in graphene on a substrate, a most commonly used configuration. Jang2008 ; Sarma2010 ; Fratini2008 Despite extensive research efforts, a comprehensive understanding of electron transport properties in BLG is still a work in progress.
The purpose of the present paper is to address this issue theoretically by taking advantage of a first principles analysis and the Monte Carlo simulation. Specifically, the impacts of substrate conditions and perpendicular electric fields are examined. The calculation results indicate that graphene in the bilayer form loses much of its advantage over conventional semiconductors in the low field transport, particularly when the band structure is modified to induce non-zero energy gap. The saturation drift velocity, on the other hand, can remain relatively high. Due to the screening, electrons in BLG appear less susceptible to the interactions with remote Coulomb sources, such as SPPs and impurities on the substrates, compared to the monolayer counterparts. Below, we begin with a brief overview of the models used to estimate the relevant scattering rates.
II Relevant Scattering Mechanisms
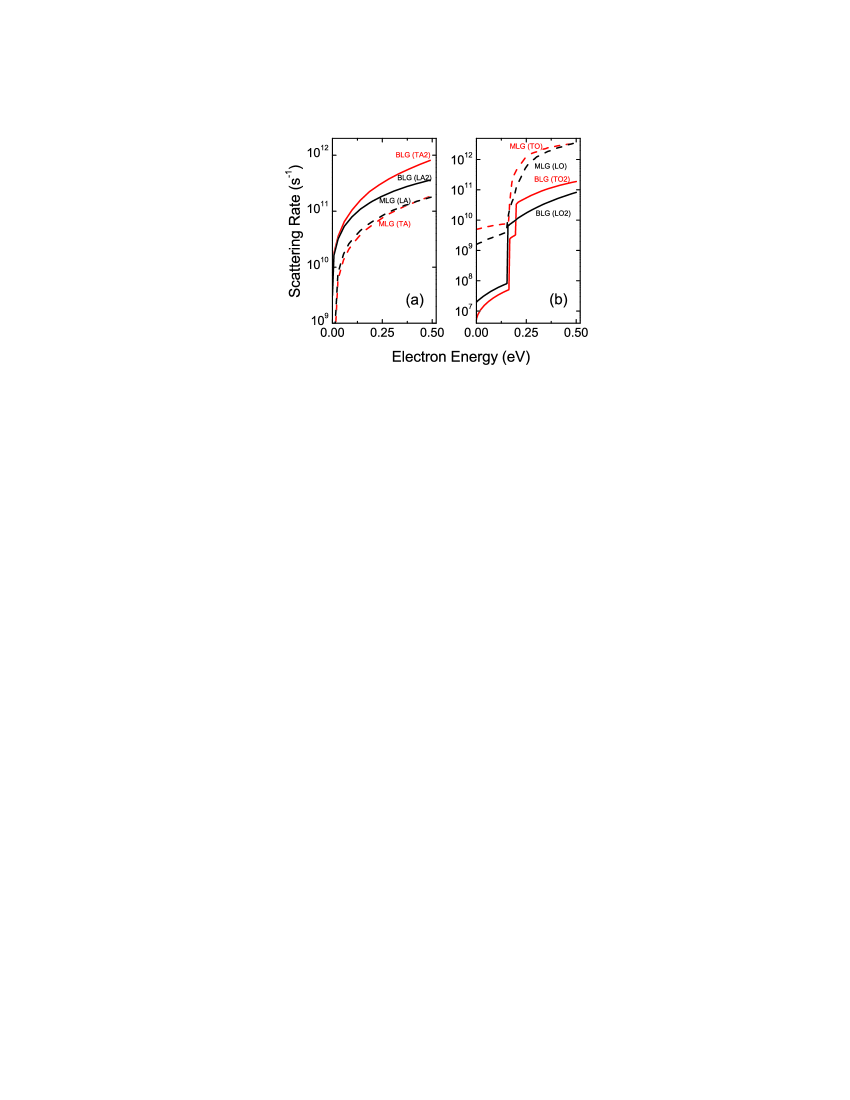
The strength of the electron-phonon coupling is estimated from the first principles by using the density functional theory. Borysenko2010 ; Borysenko2011 A comparative analysis reveals several qualitative differences in the intrinsic scattering of MLG and BLG. For one, MLG has six phonon branches with two carbon atoms in a unit cell, whereas these numbers double in BLG. Then, BLG may need to consider both the intraband and interband transitions due to the presence of a close second conduction band in addition to the lowest states. In addition, the optical phonons in BLG appear to be a relatively weak source of interaction unlike in MLG. Ultimately, the intrinsic scattering rate in BLG is dominated by the long wave acoustic phonons (intravalley scattering). Figure 1 illustrates this general trend; only the dominant branches are shown for clarity of presentation. The nomenclature for the phonon modes can be found in Refs. Borysenko2011, and Borysenko2010, .
In the presence of a polar substrate, the graphene electron interaction with SPPs can play a significant role as the earlier studies in MLG have illustrated comprehensively. Fratini2008 ; Konar2009 ; Li2010_2 A similar treatment can be extended to BLG. By assuming that the electrons are equally distributed in the two layers of BLG, we can derive the corresponding scattering rate as
| (1) |
where is the magnitude of the SPP momentum, () is the final (initial) electron energy, is the distance between the first layer and the substrate (0.4 nm), is the interlayer distance (0.34 nm), is the SPP energy, is the phonon occupation number, is the square of Fröhlich coupling constant, and is the dielectric function. The term comes from the overlap of the electron wave functions of the initial and final states with the scattering angle ; Wang2010 and are the band indices whose product is for the intraband (for example, -) and for the interband (-) transitions. comment For intrinsic BLG, for an arbitrary . When an interlayer bias of is applied, it is modified to satisfy , where is the effective mass of unbiased (or intrinsic) BLG at the or point. Wang2010 For MLG, . The static dielectric function in BLG at room temperature can be estimated by using the random phase approximation. In addition, contains the dependence on the high (low) frequency dielectric constant of the substrate (). The specific values for the relevant substrate parameters can be found in Refs. Fratini2008, , Konar2009, , and Perebeinos2010, . As for the remote impurity scattering, the charged impurities are assumed to be located on the surface of the substrate, in which case the scattering rate is given by
| (2) |
where is the background dielectric constant and is the impurity concentration. The other parameters are the same as defined in Eq. (II).
The dielectric function in BLG can be expressed as Sarma2008 ; Wang2010 with the bare Coulomb interaction and the electron-hole propagator
| (3) |
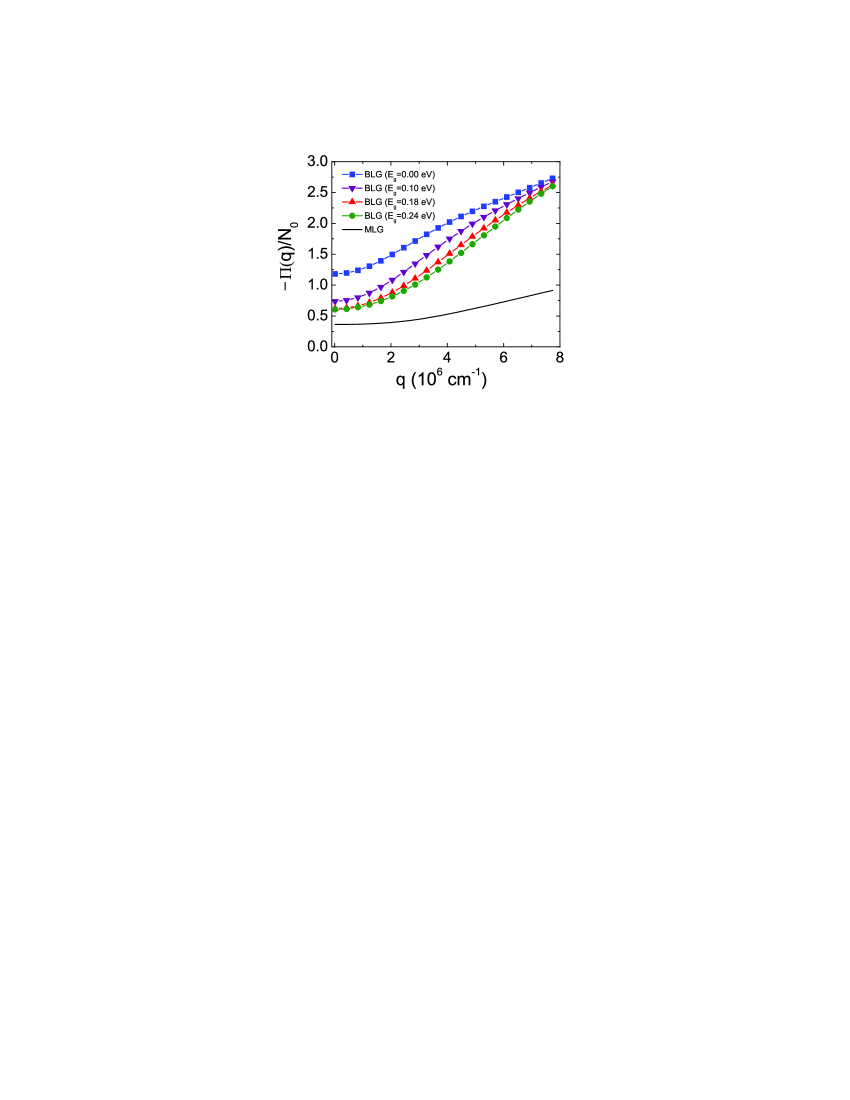
where is the electron distribution function in band and the factor of 2 takes into account the spin degeneracy. Figure 2 shows the numerically obtained propagators for MLG and BLG with the graphene electron density of cm-2 at 300 K. In this calculation [i.e., ], electron occupation in the states is ignored for its negligible contribution. Compared to MLG, the screening in BLG appears to be much stronger due mainly to the large density of state at the bottom of the conduction band (). Sarma2008 Additionally, the impact of the interlayer potential on the electron screening in BLG can be substantial and is a strong function of temperature.
III Electron Transport in BLG Vs. MLG
A full-band ensemble Monte Carlo calculation is used for evaluating electron transport characteristics self-consistently. The model takes into account the complete electron and phonon spectra in the first Brillouin zone. Specifically, both the graphene phonon dispersion and its interaction with electrons are obtained from the first principles calculations as discussed above, Borysenko2010 ; Borysenko2011 whereas analytical expressions from the tight binding approximation are used for the electronic energy bands in MLG and BLG (with the nearest-neighbor hopping energy eV and and the interlayer hopping energy eV). Li2009 The effect of degeneracy in the electronic system is taken into account by the rejection technique, after the final state selection. Electron scattering with the SPPs and remote impurities are also considered in the calculation as described above whenever necessary. Throughout the calculation, we assume cm-2 and K.
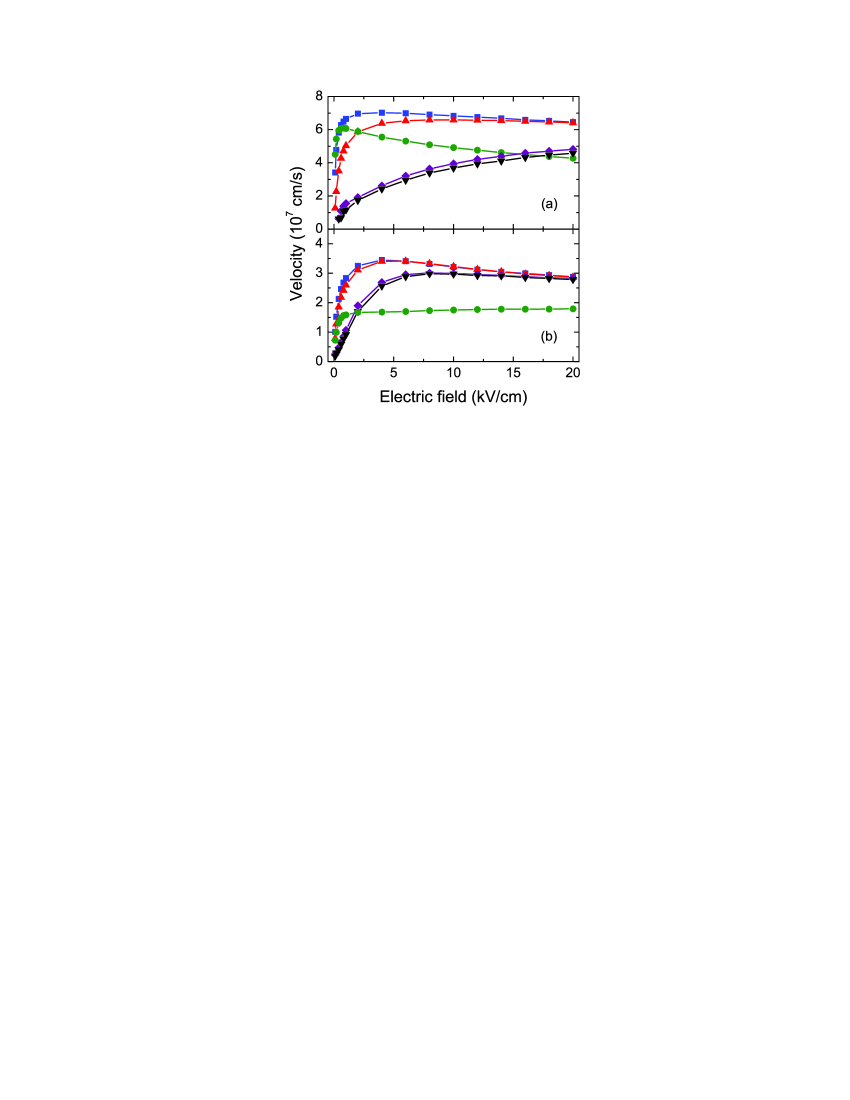
Figure 3 shows the electron drift velocity as a function of the electric field in MLG and BLG (with no interlayer bias). It provides a comparison of all examined cases: namely, intrinsic graphene and graphene on two different substrates, SiO2 and BN, for which a charged impurity density of cm-2 is considered along with the SPPs. As illustrated, intrinsic MLG (i.e., no substrate) shows remarkable transport properties, Li2010 ; Li2010_2 with the mobility and the saturation velocity as high as cm2/Vs and cm/s. An analogous calculation for BLG gives a substantially lower mobility of cm2/Vs and the saturation velocity of cm/s. These results for the intrinsic drift velocity are consistent with the scattering rates in Fig. 1; they demonstrate how acoustic and optical phonons affect the charge carriers in MLG and BLG at various electric fields.
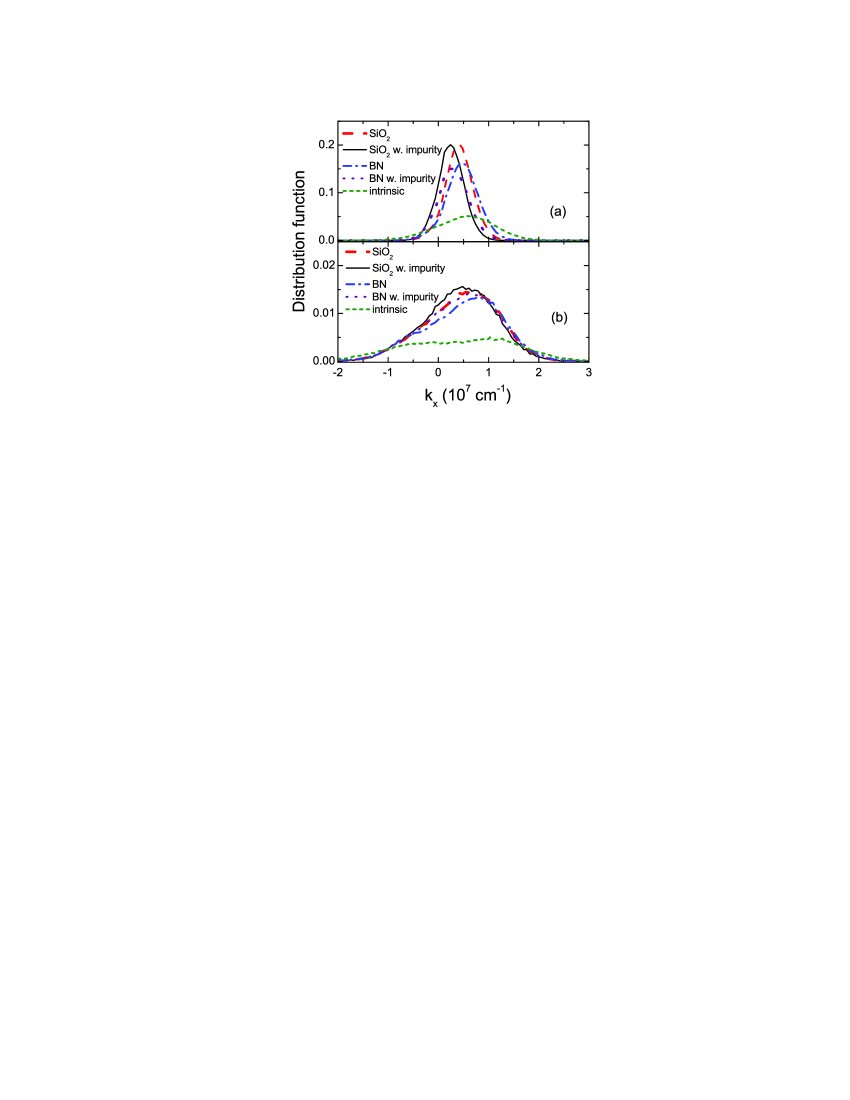
The lower mobility in BLG can be readily explained by the larger acoustic phonon scattering rates, as well as the lower electron speed near the bottom of the conduction band where all electrons tend to congregate at low electric fields. To understand the smaller saturation velocity in BLG, on the other hand, it is convenient to examine the distribution function at high electric field plotted in Fig. 4. As the electrons gain energy in the applied field, the distribution function shifts in the k-space along the direction of the drift. At the same time, increased scattering with the long-wave acoustic phonons leads to a further broadening of the electron distribution. The result of this interplay between the displacement and the broadening is the saturation of the drift velocity in intrinsic BLG, where the acoustic phonons dominate the scattering. In MLG, however, the velocity curve appears to demonstrate another pattern, which points to the presence of a competing intrinsic scatterer. Indeed, as we discussed earlier, the inelastic scattering via optical phonons is strong unlike in BLG, providing energy relaxation for hot electrons. Consequently, the distribution in MLG is prevented from shifting further towards higher energies, which in turn effectively curtails the momentum relaxing interactions and results in a higher saturation velocity.
A similar consideration applies when an additional source of optical phonon scattering comes into play. That is, the saturation velocity may be actually enhanced when graphene electrons are subject to the SPP scattering, as it provides another path for hot electron energy relaxation. Figure 3 clearly demonstrates this effect. In MLG, the SPP scattering can increase the saturation velocity up to cm/s if SiO2 or BN is used for the substrate material. This trend of the positive impact of the substrate on the saturation velocity was confirmed in recent studies. Perebeinos2010 ; Ashley2010 ; Li2010_2 In BLG, the saturation velocity can reach cm/s, which is about as 1.5 times large as the intrinsic value. Even though the screening in BLG is larger, leading to smaller SPP scattering rates, the enhancement of drift velocity is still prominent. This is due partly to the fact that the competing relaxation mechanism (i.e., intrinsic optical phonon scattering) is weak in BLG as discussed earlier.
When the charged impurity scattering is taken in account, the electron drift velocities in MLG and BLG are substantially reduced at low electric fields (see Fig. 3). If BN is used as the substrate, the low field mobility is cm2/Vs in MLG, and cm2/Vs in BLG. The drift velocity at the electric field of 20 kV/cm in MLG decreases to cm/s, while in BLG it stays nearly the same as the case without impurity scattering, cm/s. Clearly, the impact of ionized impurity scattering is much less severe in BLG. This is because the BLG electrons on average are more separated from the impurities (i.e., the surface of the substrate) and experience stronger screening. The calculated result in MLG on SiO2 shows a good agreement with the available experimental data; Ashley2010 the discrepancy may be attributed to the presence of additional sources of interaction such as neutral scatters on the substrate, ripples and other defects in graphene crystal lattice. Neto2009
IV Transport in BLG with interlayer bias
BLG with an interlayer bias offers the advantage of a tunable bandgap with potential applications to transistors, tunable photo-detectors and lasers. Castro2007 ; Xia2010 The band structure in this case changes to, McCann2006
| (4) |
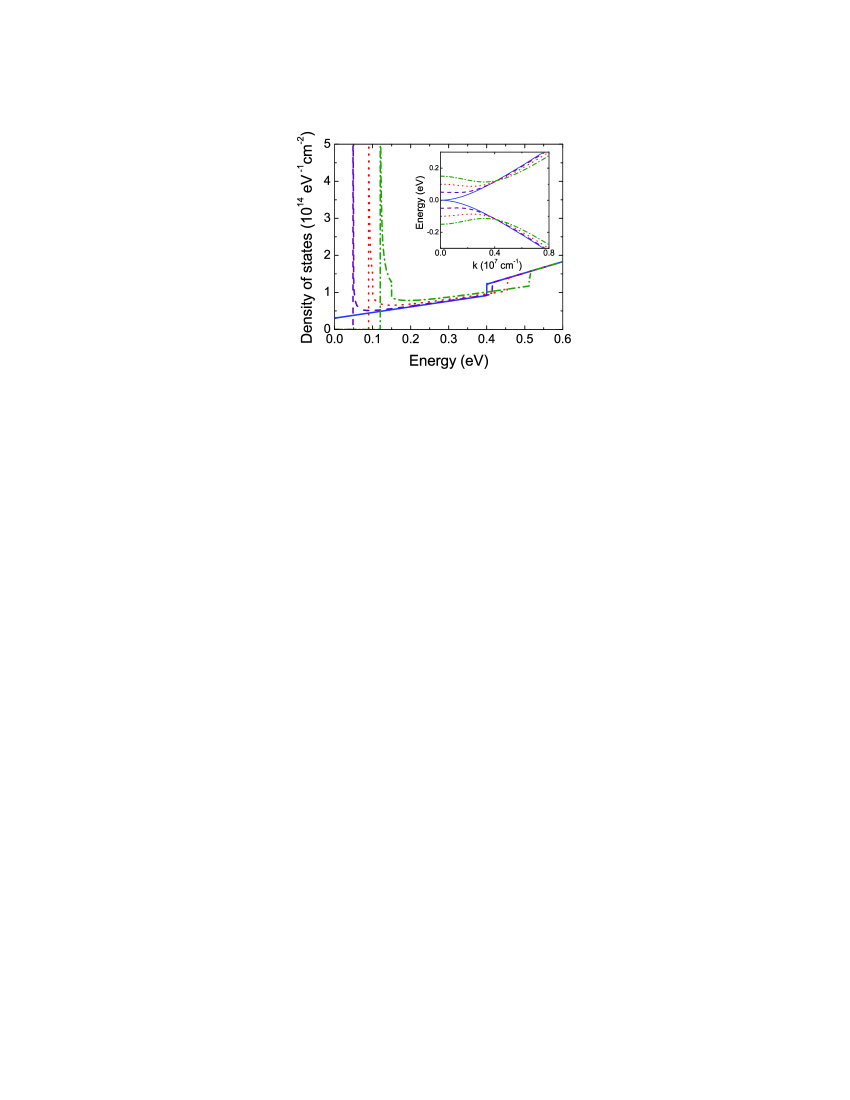
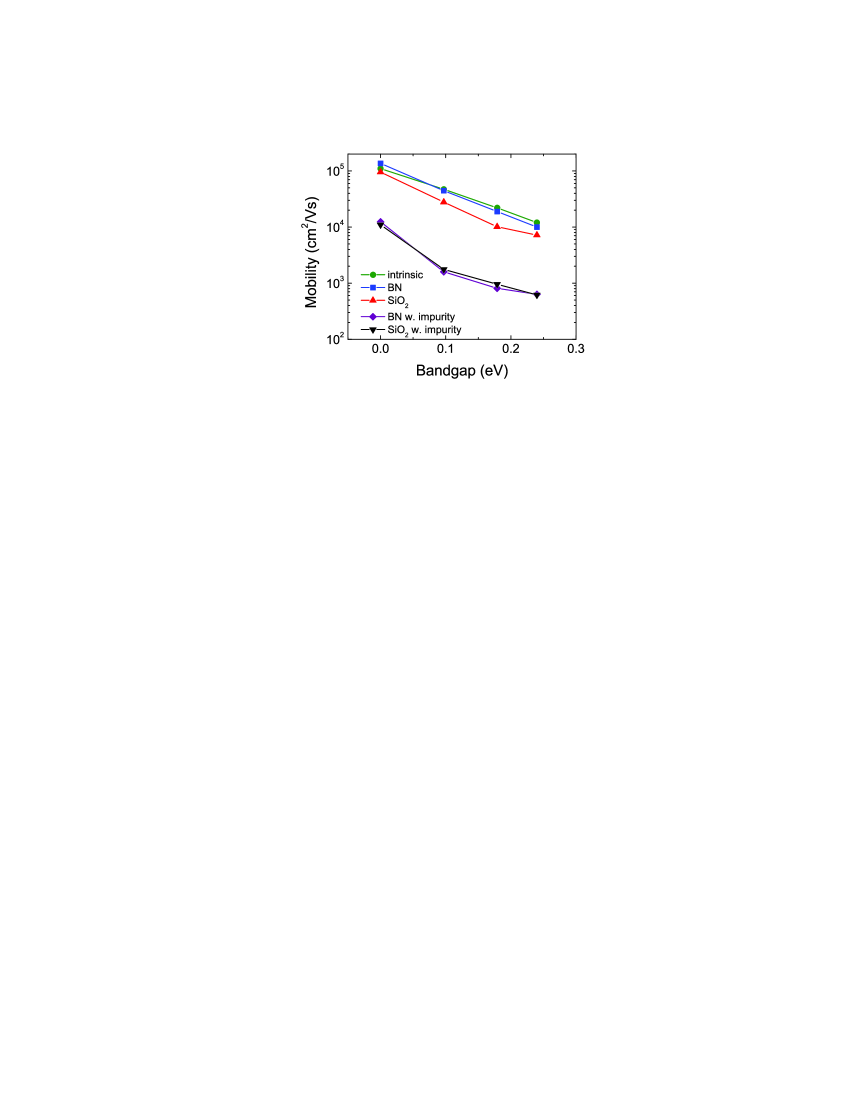
where is the difference between on-site energies in the two layers, cm/s is the Fermi velocity ( nm), and the minus and plus signs correspond the and conduction bands, respectively. However, this ability to tune the band gap comes at the expense of the material’s intrinsic transport properties. As the bandgap opens, the bottom of the lowest conduction band changes its shape from a hyperbola to a so-called ”Mexican hat” and the density of states exhibits a Van Hove singularity as shown in Fig. 5. The inserted figure shows the band structures for different bandgaps. Consequently, the increased density of states leads to stronger quasi-elastic electron interaction with the long-wavelength acoustic phonons at low electron energies. Figure 6 provides the dependence of the mobility on the size of the bandgap. When the bandgap is eV, the mobility drops as low as to cm2/Vs even without any external scattering mechanisms, which is one order of magnitude smaller than in the unbiased case. The reduction in the mobility becomes even more pronounced when the ionized impurity scattering is taken into account. The Van Hove singularity also enhances the impact of electron coupling with the remote impurities.
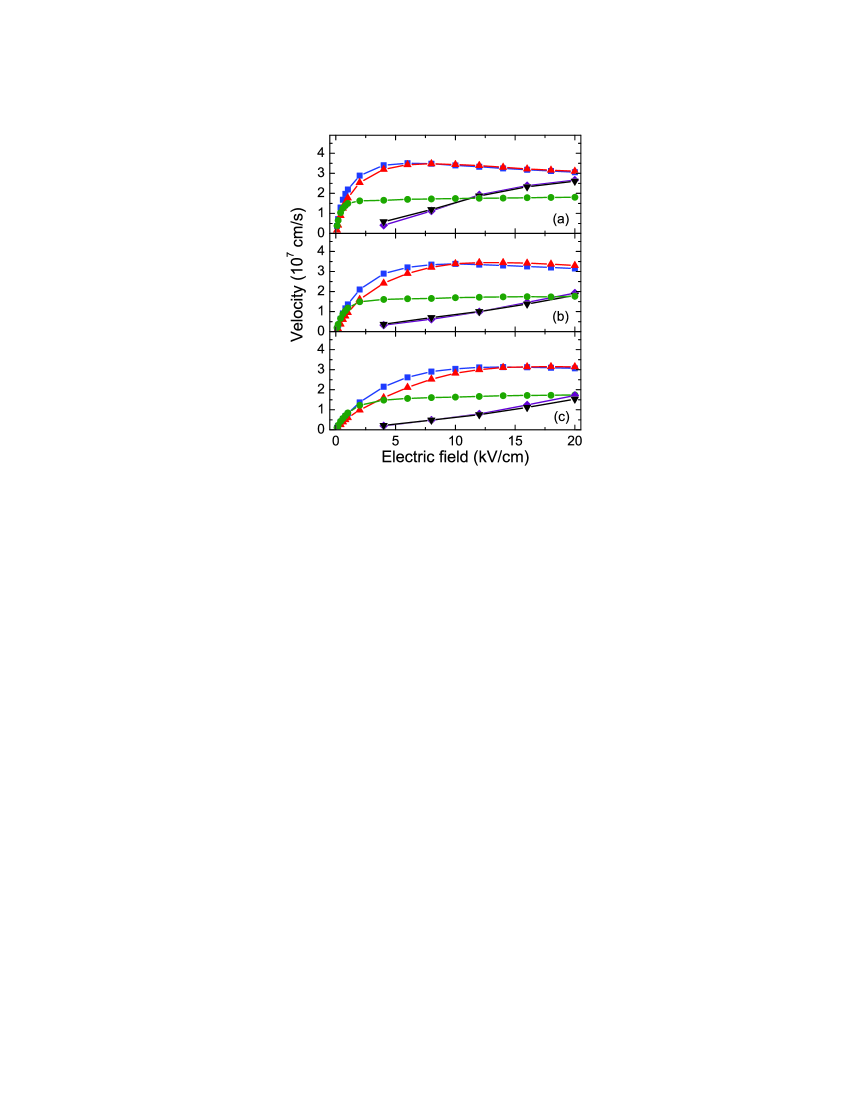
On the other hand, it appears that the velocities at high fields are mostly unaffected by the gap. Figure 7 shows the drift velocity for V, V, and V, which correspond to the bandgap of eV, eV, and eV, respectively. As the velocity saturation is associated with hot electrons, the changes of the electron spectrum on the bottom of the conduction band have little to no effect on the charge carriers located much higher in energies. Similarly, the impact of the SPP scattering on the drift velocity, as it is felt primarily via the high energy electrons, is not affected by the gap in the electron energy spectrum. Figure 7 demonstrates this point as no appreciable difference is observed in the SPP contribution for three different choices of . When the ionized impurity scattering is included, the velocity saturation is progressively pushed to a higher field due to the reduction in the mobility (i.e., the slope) that was discussed above.
It should be noted that the mobilities obtained in the presented Monte Carlo simulation may have a limited accuracy, for lack of an available adequate model for the electron-electron scattering. It might be especially important in case of biased BLG, where the divergence of the density of states results in difficulties of reproducing electron thermal equilibrium in Monte Carlo simulation.
V Summary
Electron transport properties of BLG are studied under realistic conditions in the presence of the SPPs and charged impurities. Overall, BLG has a lower mobility and saturation velocity than MLG, due to the stronger acoustic phonon scattering, weaker optical phonon scattering, and nonlinear dispersion at the bottom of the conduction band. It is also shown that SPPs can improve the saturation velocity in BLG by effectively dissipating the electron energy. The impurity scattering has a strong effect of decreasing the drift velocities in both MLG and BLG. However, BLG appears more resistant to impurity scattering than MLG, due to a stronger screening and larger effective distance between electrons and the impurities. In BLG with a interlayer bias, the changes in the band structure result in drastically reduced mobilities, especially in the presence of charged impurities. This may limit the chances of utilizing BLG in device applications.
Acknowledgements.
This work was supported, in part, by the DARPA/HRL CERA, ARO, and SRC/FCRP FENA programs. MBN wishes to acknowledge partial support from the Office of Basic Energy Sciences, US DOE at Oak Ridge National Lab under contract DE-AC05-00OR22725 with UT-Battelle, LLC.References
- (1) K. S. Novoselov, A. K. Geim, S. V. Morozov, D. Jiang, Y. Zhang, S. V. Dubonos, I. V. Grigorieva, and A. A. Firsov, Science 306, 666 (2004).
- (2) K. S. Novoselov, A. K. Geim, S. V. Morozov, D. Jiang, M. I. Katsnelson, I. V. Grigorieva, S. V. Dubonos, and A. A. Firsov, Nature 438, 197 (2005).
- (3) Y.-M. Lin, C. Dimitrakopoulos, K. A. Jenkins, D. B. Farmer, H.-Y. Chiu, A. Grill, and Ph. Avouris, Science 327, 662 (2010).
- (4) A. H. Castro Neto, F. Guinea, N. M. R. Peres, K. S. Novoselov, and A. K. Geim, Rev. Mod. Phys. 81, 109 (2009).
- (5) E. McCann, Phys. Rev. B 74 161403(R) (2006).
- (6) E. V. Castro, K. S. Novoselov, S. V. Morozov, N. M. R. Peres, J. M. B. Lopes dos Santos, J. Nilsson, F. Guinea, A. K. Geim, and A. H. Castro Neto, Phys. Rev. Lett. 99, 216802 (2007).
- (7) H. Min, B. Sahu, S. K. Banerjee, and A. H. MacDonald, Phys. Rev. B 75, 155115 (2007).
- (8) Y. Zhang, T. Tang, C. Girit, Z. Hao, M. C. Martin, A. Zettl, M. F. Crommie, Y. R. Shen, and F. Wang, Nature, 459, 820 (2009).
- (9) F. Xia, D. B. Farmer, Y.-M. Lin, and Ph. Avouris, Nano Lett. 10, 715 (2010).
- (10) S. Xiao, J.-H. Chen, S. Adam, E. D. Williams, and M. S. Fuhrer, Phys. Rev. B 82, 041406(R) (2010).
- (11) K. M. Borysenko, J. T. Mullen, X. Li, Y. G. Semenov, J. M. Zavada, M. Buongiorno Nardelli, and K. W. Kim, Phys. Rev. B 83, 161402(R) (2011).
- (12) C. Jang, S. Adam, J.-H. Chen, E. D. Williams, S. Das Sarma, and M. S. Fuhrer, Phys. Rev. Lett. 101, 146805 (2008).
- (13) S. Das Sarma, E. H. Hwang, and E. Rossi, Phys. Rev. B 81, 161407(R) (2010).
- (14) S. Fratini and F. Guinea, Phys. Rev. B 77, 195415 (2008).
- (15) K. M. Borysenko, J. T. Mullen, E. A. Barry, S. Paul, Y. G. Semenov, J. M. Zavada, M. Buongiorno Nardelli, and K. W. Kim, Phys. Rev. B 81, 121412(R) (2010).
- (16) A. Konar, T. Fang, and D. Jena, Phys. Rev. B 82, 115452 (2010).
- (17) X. Li, E. A. Barry, J. M. Zavada, M. Buongiorno Nardelli, and K. W. Kim, Appl. Phys. Lett. 97, 232105 (2010).
- (18) X. F. Wang and T. Chakraborty, Phys. Rev. B 81, 081402(R) (2010).
- (19) This expression for is also applied to the - scattering even though it is only approximate. the treatment does not alter the calculation results due to the small contribution of the electrons in the band.
- (20) V. Perebeinos and Ph. Avouris, Phys. Rev. B 81, 195442 (2010).
- (21) E. H. Hwang and S. Das Sarma, Phys. Rev. Lett. 101, 156802 (2008).
- (22) Z. Q. Li, E. A. Henriksen, Z. Jiang, Z. Hao, M. C. Martin, P. Kim, H. L. Stormer, and D. N. Basov, Phys. Rev. Lett. 102, 037403 (2009).
- (23) X. Li, E. A. Barry, J. M. Zavada, M. Buongiorno Nardelli, and K. W. Kim, Appl. Phys. Lett. 97, 082101 (2010).
- (24) A. M. Dasilva, K. Zou, J. K. Jain, and J. Zhu, Phys. Rev. Lett. 104, 236601 (2010).
- (25) E. H. Hwang and S. Das Sarma, Phys. Rev. B 75, 205418 (2007).