Spectrum evolution in binary pulsar B125963/LS 2883 Be star and gigahertz-peaked spectra.
Abstract
We study the radio spectrum of PSR B125963 orbiting around the Be star LS 2883 and show that the shape of the spectrum depends on the orbital phase. At frequencies below 3 GHz PSR B125963 flux densities are lower when measured near the periastron passage than those measured far from periastron. We suggest that an interaction of the radio waves with the Be star environment accounts for this effect. While it is quite natural to explain the pulsar eclipse by the presence of an equatorial disk around LS 2883, this disk alone cannot be responsible for the observed spectral evolution of PSR B125963 and we, therefore, propose a qualitative model which explains this evolution. We consider two mechanisms that might influence the observed radio emission: free-free absorption and cyclotron resonance. We believe that this binary system can hold the clue to the understanding of gigahertz-peaked spectra of pulsars.
keywords:
(stars:) pulsars: general – radiation mechanism: non-thermal – pulsars: individual: B125963, B105462, J18091917,B182222, B182313, B182811, – stars: winds, outflows1 Introduction
Generally, the observed radio spectra of most pulsars can be modelled as a power law with negative spectral indices of about (Maron et al., 2000). If a pulsar can be observed at frequencies low enough (i.e. 100 - 600 MHz) it may also show a low frequency turn-over in its spectrum (Sieber, 1973; Malofeev et al., 1994).
On the other hand Lorimer et al. (1995) mentioned three pulsars which have positive spectral indices in the frequency range MHz. Later Maron et al. (2000) reexamined spectra of these pulsars taking into account the data obtained at higher frequencies (above GHz) and consequently were the first to demonstrate a possible existence of spectra with turn-over at high frequencies, about 1 GHz. Motivated by this unusual spectral feature Kijak & Maron (2004) selected several pulsars which showed a decreasing flux density at frequencies below 1 GHz. Kijak et al. (2007) used multifrequency flux measurements for these candidate pulsars and presented the first direct evidence of a high frequency turn-over. A frequency at which such a spectrum shows the maximum flux was called the peak frequency.
Based on their observations of these pulsars Kijak et al. (2011) provided a definite evidence for a new type of pulsar radio spectra. These spectra show the maximum flux above 1 GHz, while at higher frequencies the spectra look like a typical pulsar spectrum. At lower frequencies (below 1 GHz) the observed flux decreases, showing a positive spectral index. They called these objects the gigahertz-peaked spectra (GPS) pulsars.
Kijak et al. (2011) also indicated that the GPS pulsars are relatively young objects and they usually adjoin such interesting environments as HII regions or compact pulsar wind nebulae (PWN). Additionally they seem to be coincident with the known but sometimes unidentified X-ray sources from 3rd EGRET Catalogue or HESS observations. We can assume that the GPS appearance owes to the environmental conditions around the neutron stars rather than to the radio emission mechanism. The issue of our interest PSR B125963 was also inscribed by Lorimer et al. (1995) in the list of pulsars with positive spectral indices. Therefore, B125963 seems a natural candidate to be classified as the GPS pulsar. This pulsar was discovered by Johnston et al. (1992) in 1990 during a large-scale high frequency ( GHz) survey of the Galactic plane. It is important to mention that PSR B125963 is the only known radio pulsar orbiting a massive main-sequence Be star.
PSR B125963 has a short period of 48 ms and a characteristic age of 330 kyr. Its average DM is about 147 pc cm-3 and the corresponding distance is about 2.75 kpc. The companion star LS 2883 is a 10-mag massive Be star with a mass of about 10 M☉ and a radius of 6 R☉. Let us note that Be stars are generally believed to have a hot tenuous polar wind and a cooler high density equatorial disk. Johnston et al. (1994) and Melatos et al. (1995) suggested the presence of the disk around LS 2883. Its density is quite high near the star and falls off as a power law with the distance from the star. The disk is likely to be highly tilted with respect to the pulsar orbital plane, and PSR B125963 is eclipsed for about 35 days as it goes behind the disk. The pulsar has a long orbital period of 1237 days and a large eccentricity of 0.87 with a projected semi-major axis, of 2.6 AU.
The PSR B125963/LS 2883 is a unique binary system, which emits unpulsed non-thermal emission over a wide range of frequencies ranging between radio and rays and its flux varies with orbital phase. Chandra observed this system in 2009 (shortly after the apastron passage) and failed to detect any pulsation with a period equal to that of the pulsar (Pavlov et al., 2011). The broadband emission from this system is generally believed to be produced by the ultra-relativistic electrons accelerated in the bow-shock that appears while the relativistic pulsar wind (PW) collides with the dense non-relativistic outflow of the companion star, producing the Pulsar Wind Nebula (PWN) (Kong et al., 2011).
In this paper we analyse the available published data of PSR B125963 radio flux measured during three periastron passages (in 1997, 2001 and 2004) and present detailed study of the pulsar spectrum.
2 Pulsars with the GPS
To compare various shapes of the B125963 spectrum observed at different orbital phases with that of the GPS pulsars we use the same fitting method. This method was previously used by Kuzmin & Losovsky (2001) for pulsar spectra with turn-over at low frequencies. Using the data of flux measurements with errors for several GPS pulsars (or at least showing a signature of this unusual spectral feature) taken from Kijak et al. (2007) and Kijak et al. (2011) we analysed the spectra using a function
| (1) |
We carried out fitting of the data using an implementation of the nonlinear least-squares Marquardt-Levenberg algorithm.
In Table 1 we present the values of fitting parameters , and , the reduced , the peak frequency calculated using the method described above and are taken from Kijak et al. (2011). The fitted spectra are presented in Fig. 1.
| PSR | a | b | c | |||
|---|---|---|---|---|---|---|
| 1 | -7.28 | -1.95 | 1.94 | 4.40 | 1.0 | 0.73 |
| 2 | -3.96 | 2.80 | -0.10 | 2.91 | 1.7 | 2.25 |
| 3 | -1.30 | 0.40 | 0.41 | 1.59 | 1.4 | 1.43 |
| 4 | -1.18 | 0.52 | 0.56 | 2.35 | 1.6 | 1.66 |
| 5 | -2.09 | -0.55 | 0.12 | 1.69 | 1.2 | 0.74 |

3 Be star/pulsar binary and PSR B125963 spectrum evolution
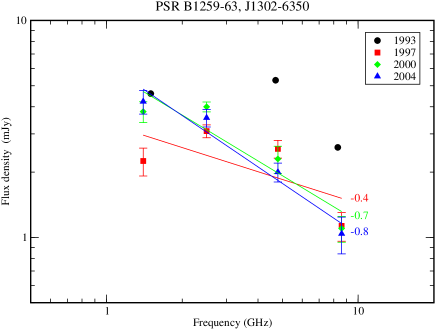
To demonstrate the unusual spectral behaviour of B125963 let us fit its spectra applying the typical power law method. Using the available measurements of the pulsed flux (Manchester & Johnston, 1995; Johnston et al., 1999; Connors et al., 2002; Johnston et al., 2005), we have constructed spectra of PSR B125963 for few different orbital epochs (see Fig. 2). The obtained values of spectral indices differ significantly from the typical value of about (Maron et al., 2000). However, Fig. 2 shows that this approximation is apparently inaccurate as the spectra clearly show the peaked frequency for the corresponding periastron passages (see Fig. 1 for comparison). Therefore, we have decided to study variation of the observed radio flux with orbital phases.
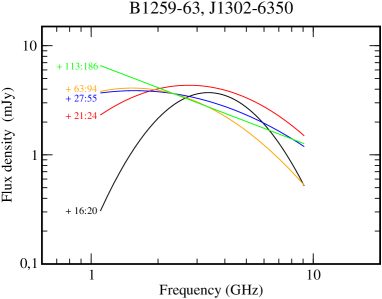
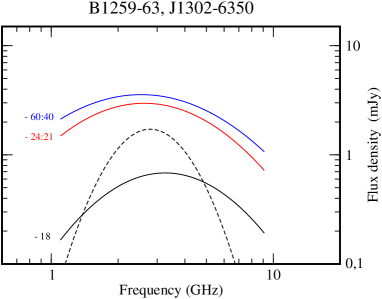
Using the same database (1997, 2000 and 2004) we have calculated an average flux density for four given frequencies and for each chosen interval of orbital phases. Fig. 3 shows the spectra for various orbital phase ranges, determined by the chosen days prior to or past the periastron passage. It is clear that the flux at the given frequency apparently changes with orbital phases. When the pulsar is close to periastron, the flux generally decreases at all observed frequencies, but its drastic decrease is observed at the lowest frequency. The spectrum for the furthest orbital epoch during of which the pulsar was observed so far (i.e. from 113 to 186 days past periastron; see the green thickened segment in Fig. 4, bottom panel) is consistent with a typical pulsar spectrum described by a power-law function (see Fig. 3 panel c and Fig. 4 left panel). On the other hand, the spectral index for this orbital epoch is of about which is less than the average value () for the pulsar population and one can argue that it rather resembles a broken type spectrum (Maron et al., 2000). Thus, it cannot be ruled out that this spectrum is still affected by the stellar wind. Observations of the pulsar near the apastron passage can clarify this problem.
| days | a | b | c | ||
|---|---|---|---|---|---|
| (GHz) | |||||
| -60 : -40 | -1.70 | 1.38 | 0.27 | 0.74 | 2.54 |
| -24 : -21 | -2.10 | 1.76 | 0.10 | 0.10 | 2.62 |
| -18 | -2.77 | 2.84 | -0.89 | 3.26 | |
| 16 : 20 | -4.59 | 4.84 | -0.71 | 0.01 | 3.37 |
| 21 : 24 | -1.72 | 1.51 | 0.31 | 0.01 | 2.75 |
| 27 : 55 | -0.88 | 0.34 | 0.55 | 1.49 | 1.57 |
| 63 : 94 | -1.48 | 0.55 | 0.56 | 0.04 | 1.53 |
To analyse the spectrum evolution in more details we have used the method of fitting described in Section 2. Consequently, we have calculated fitting parameters for function (1) and constructed radio spectra for the chosen orbital epochs. The fitting parameters, the reduced and the calculated peak frequencies are presented in Table 2, while the shapes of the spectrum are presented in Fig. 4, left and right panels. Let us note that we have used an additional black dashed line in the right panel of Fig. 4 to indicate a fit with an additional predicted data point which corresponds to the probable flux at frequency 2.6 GHz as there are no observations for this particular orbital phase (+18 day) at this frequency. The solid black line corresponds to the fit obtained using only three data points from Fig. 3. On the other hand one can see that the flux at 2.6 GHz does not change significantly for all orbital phases (see Fig. 3). Thus, in order to use the same kind of fitting for all chosen orbital epochs we have calculated the extrapolated flux at 2.6 GHz based on a power law fitting of two data points at higher frequencies (Fig. 3, panel a).
The small (much less than unity) values of the reduced in Table 2 are caused by rather large uncertainties in the flux measurements for four orbital epochs (see Fig.3 for comparison). Let us note, that is especially small (of about ) for and epochs when the relative uncertainties of the measured flux are quite large (see Fig. 3b). On the other hand, in the case of epochs when the uncertainties (for all frequencies) are relatively small (see the blue filled dots in Fig. 3a and the blue empty diamonds in Fig. 3c) the value of is close to unity. We hope to reduce the uncertainties significantly by gathering more flux measurements during these orbital epochs.
To clarify the spectrum evolution we have presented the corresponding orbital epochs in the bottom panel of Fig. 4. Our analysis shows that the shape of the PSR B125963 spectrum depends on the orbital phase and therefore it definitely undergoes evolution. It should be underlined that the peak frequency also depends on the pulsar orbital phase. Comparing Figs 1 and 4 (left and right panels) we can conclude that the spectra of B125963 resemble those of the GPS pulsars. Moreover, we can see that the shapes of the B125963 spectrum at different orbital phase intervals mimic those of various gigahertz-peaked spectra.

4 Discussion
Multi-wavelength observations showed that some pulsars with turn-over in the spectra at high frequencies have very interesting environments. For example, PSR B105462 lies behind or within a dense HII region (Koribalski et al., 1995), while PSR B182313 surroundings appear to show some peculiar properties in radio (Gaensler et al., 2003), as well as in X-ray observations (Pavlov et al., 2008), which may indicate the existence of a compact Pulsar Wind Nebula (PWN). The same holds for the GPS pulsar J18091917 (Kargaltsev & Pavlov, 2007). This could suggest that the phenomenon of the turn-over at high frequencies is associated with environmental conditions around the neutron stars rather than with the radio emission mechanism. Because of more or less stable environmental conditions around the GPS pulsars the shapes of their spectra do not vary on observable timescales. But in the case of B125963, the pulsar environment considerably changes due to high orbital eccentricity while it goes through various orbital phases. The distance of the pulsar from the Be star varies from 4.8 AU in apastron to 0.34 AU in periastron (by a factor of 14). Be stars have a strong stellar wind and possibly a strong magnetic field and both the disk density and the magnetic field decrease as the distance from the star increases. Thus, it is natural to expect that the inhomogeneous environment alters the spectrum of B125963 in different ways.
At present it is difficult to construct a detailed theory of the spectra evolution as we lack observational data especially near apastron (see Fig. 4). These data must be important because the pulsar spectrum is the least affected by the environment near apastron and this spectrum could be used as a reference spectrum. However, from the available limited observations we can still deduce general conclusions about the main factors that influence variations of the observed spectra.
Generally, both the hot stellar wind (by means of thermal absorption) and the magnetic field may provide absorption at low frequencies (Sieber, 1973; Khechinashvili & Melikidze, 1997; Khechinashvili et al., 2000). While the eclipse itself can be naturally explained by free-free absorption in the stellar disk (Melatos et al., 1995), the disk alone is not enough to explain the spectra evolution.
The sign of the GPS feature first appears as early as about 60 days prior to periastron and it is still observed during at least 90 days after periastron. It is clear that the stellar disk cannot extend that far. It seems that the polar wind is the only factor that can affect the spectrum of the pulsar. Preliminary estimations show that free-free absorption due to the stellar wind can be responsible for this effect before the eclipse as well as after it (see Fig. 4). The optical depth of free-free absorption can be expressed as (Rybicki & Lightman, 1979):
| (2) |
where is the electron density in cm-3, is the temperature in K, is the frequency in GHz and is the distance in AU. The exact value of depends on the geometry of the binary system as well as on the density and temperature of the stellar wind. One can note that the shapes of spectra are not fully symmetric with respect to the periastron point. To some extent, the spectrum plotted by the green curve in the left panel of Fig. 4 can be used as a reference spectrum. This spectrum is obtained while the pulsar is in the orbital epoch designated by the thickened green segment in the bottom panel of Fig. 4. It is the furthest orbital phase at which the pulsar is observed so far, but the spectrum still does not look exactly like a typical pulsar spectrum. Indeed, the waves emitted before the eclipse travel longer distance through the stellar wind, thus they are stronger attenuated by free-free absorption, than the waves emitted after the eclipse (see Fig. 4). This is in agreement with DM and RM variations presented by Melatos et al. (1995). The most significant change of the spectrum shape occurs during a couple of days just before the eclipse as well as immediately afterwards (the thickened black segments in the bottom panel, Fig. 4). One can see that the difference between the red and black curves on the left as well as on the right panel of Fig. 4 is much more noticeable than the difference between the red and blue curves in the same panels.
In addition, we have shown (see Table 2) that the peak frequency (as it follows from the fitting procedure) also depends on the orbital phase. This effect suggests that the peak frequency varies with the changes of the pulsar environment. We argue that such behaviour can be explained by the radio-wave absorption in the magnetic field associated with the disk. In this case the radio waves should pass through the ‘magnetosphere’ of the disk. Magnetic field lines just above the stellar disk are populated by the electrons and positrons of the pulsar wind. Such kind of environment affects the pulsar spectra in the same way as it does in the case of those eclipsing pulsars whose eclipse duration depends on the observed frequency (Khechinashvili & Melikidze, 1997; Khechinashvili et al., 2000). The frequency of waves which are affected by the cyclotron dumping can be expressed in the following way:
| (3) |
where is the value of the magnetic field associated with the disk, is the Lorentz factor of the secondary electron-positron pairs of the pulsar wind and is the angle between the wave vector and magnetic field direction.
Finally let us underline that the PSR B125963/LS 2883 binary system can hold the clue to the understanding of the GPS pulsars. As we mentioned in Section 3 the spectrum of B125963 at the various orbital phases mimics that of the pulsars with GPS. Thus, we can conclude that the GPS feature should be caused by some external factors rather than by the emission mechanism. On the other hand, the GPS pulsars are isolated radio pulsars and therefore, we cannot draw a direct analogy between the PSR B125963/LS 2883 system and the the GPS pulsars, as the latter have no companion stars and/or disks. But the GPS pulsars apparently are surrounded by some kind of environment that can affect the spectra of those pulsars in the same way as the stellar wind affects the B125963 spectrum. As an example we can take the cases of B182313 which is surrounded by a compact pulsar wind nebula Pavlov et al. (2011), or PSR B1054-62 which lies behind or within a dense HII region (Koribalski et al., 1995). All GPS pulsars have relatively high Dispersion Measures that in some cases, are too large to be accounted for by the Galactic electron density, and thus, we can speculate that there is a quite high particle density in the vicinity of these pulsars (see also Kijak et al., 2011). As soon as all the necessary observational data are available, we will model the physical conditions which cause the evolution of the B125963 spectrum. Consequently, we will be able to estimate the particle density, temperature and magnetic field that are necessary to form the spectra shown in Fig. 4. We believe that the same physical processes (i.e. free-free and/or cyclotron absorption) are responsible for both B125963 and the GPS pulsars spectra, therefore, we will be able to estimate characteristic values for the GPS pulsar surroundings in a similar way. The only difference could be an invariable shape of the gigahertz-peaked spectra, in contrast with the B125963 spectrum, which undergoes evolution due to orbital motion.
 |
 |
 |
|
5 Summary
Finally, we can conclude that the B125963 spectrum undergoes evolution while the pulsar orbits around the Be star LS 2883. The most significant change of the spectrum shape occurs during a couple of days just before the eclipse as well as immediately afterwards (the thickened black segments in the bottom panel, Fig. 4). We argue that the observed variation of the spectra is caused by a combination of two effects: the free-free absorption in the stellar wind and the cyclotron resonance in the magnetic field. This field is associated with the disk and is infused by the relativistic particles of the pulsar wind. Having noticed the apparent resemblance between the B125963 spectrum and the GPS, we suggest that the same mechanisms should be responsible for both cases. Thus, the case of B125963 can be treated as a key factor to explain the GPS phenomenon observed for the solitary pulsars with interesting environments. Therefore, the binary system B125963/LS 2883 seems to be an important astrophysical laboratory to study the interaction between pulsar and their environments, such as bow-shocks and pulsar wind nebulae (Pavlov et al., 2011).
Acknowledgments
We are grateful to anonymous referee for useful comments. This work was partially supported by the the Polish State Committee for Scientific Research under Grant N N203 391934. GM was partially supported by the Georgian NSF grant ST08/4-442. We thank M.Margishvili for the language editing of the manuscript.
References
- Connors et al. (2002) Connors T. W., Johnston S., Manchester R. N., McConnell D., 2002, MNRAS, 336, 1201
- Gerhz & Woolf (1970) Gerhz R.D., Woolf N.J., 1970, ApJ, 161, L213
- Gaensler et al. (2003) Gaensler B. M., Schulz N. S., Kaspi V. M., Pivovaroff M. J., Becker W. E., 2003, ApJ, 588, 441
- Hobbs et al. (2004) Hobbs G. et al., 2004, MNRAS, 352, 1439
- Johnston et al. (1992) Johnston S., Lyne A. G., Manchester R. N., Kniffen D. A., D’Amico N., Lim J., Ashworth M., 1992, MNRAS, 255, 401
- Johnston et al. (1994) Johnston S., Manchester R. N., Lyne A. G., Nicastro L., Spyromilio J., 1994, MNRAS, 268, 430
- Johnston et al. (1999) Johnston S., Manchester R. N., McConnell D., Campbell-Wilson D., 1999, MNRAS, 302, 277
- Johnston et al. (2005) Johnston S., Ball L., Wang N., Manchester R. N., 2005, MNRAS, 358, 1069
- Kargaltsev & Pavlov (2007) Kargaltsev O., Pavlov G. G., 2007, ApJ, 670, 655
- Khechinashvili & Melikidze (1997) Khechinashvili D., Melikidze G., 1997, A&A, 320, L45
- Khechinashvili et al. (2000) Khechinashvili D., Melikidze G., Gil J., 2000, ApJ, 541, 335
- Kijak & Maron (2004) Kijak J., Maron, O., 2004, in Camilo F., Gaensler B.M., eds, Proc. IAU Symp. 218, Young Neutron Stars and Their Environments. Astron. Soc. Pac., San Francisco, p. 339
- Kijak et al. (2007) Kijak J., Gupta Y., Krzeszowski K., 2007, A&A, 462, 699
- Kijak et al. (2011) Kijak J., Lewandowski W., Maron O., Gupta Y., Jessner A., 2011, A&A, 531, A16
- Kong et al. (2011) Kong S. W., Yu Y. W., Huang Y. F., Cheng K. S., 2011, MNRAS, in press
- Koribalski et al. (1995) Koribalski B., Johnston S., Weisberg J. M., Wilson W., 1995, ApJ, 441, 756
- Kuzmin & Losovsky (2001) Kuzmin A. D., Losovsky B. Ya., 2001, A&A, 368, 230
- Lorimer et al. (1995) Lorimer D. R., Yates J. A., Lyne A. G., Gould D. M., 1995, MNRAS, 273, 411
- Malofeev et al. (1994) Malofeev V. M., Gil J., Jessner A., Malov I. F., Seiradakis J. H., Sieber W., Wielebinski R., 1994, A&A, 285, 201
- Manchester & Johnston (1995) Manchester R. N., Johnston S., 1995, ApJ, 441, L65
- Maron et al. (2000) Maron O., Kijak J., Kramer M., Wielebinski R., 2000, A&A S, 147, 195
- Melatos et al. (1995) Melatos A., Johnston S., Melrose, D., 1995, MNRAS, 275, 381
- McLaughlin et al. (2002) McLaughlin M. A. et al., 2002, ApJ, 564, 333
- Pavlov et al. (2008) Pavlov G.G., Kargaltsev O., Brisken W.F., 2008, ApJ, 675, 683
- Pavlov et al. (2011) Pavlov G. G., Chang, C., Kargaltsev O., 2011, ApJ, 730, 2p
- Rybicki & Lightman (1979) Rybicki G. P., Lightman A. P., 1979, Radiative processes in Astrophysics , Wiley-Interscience, New York
- Sieber (1973) Sieber W., 1973, A&A S, 28, 237