The Near-Infrared Coronal Line Spectrum of 54 Nearby Active Galactic Nuclei
Abstract
The relationship between emission of coronal lines (CLs) and nuclear activity in 36 Type 1 and 18 Type 2 active active galactic nuclei (AGNs) is analyzed, for the first time, based on near infrared (0.8-2.4 m) spectra. The eight CLs studied, of Si, S, Fe, Al and Ca elements and corresponding to ionization potentials (IP) in the range 125 – 450 eV, are detected (3) in 67% (36 AGNs) of the sample. Our analysis show that the four most frequent coronal lines − [Si vi] 1.963m, [S viii] 0.9913m, [S ix] 1.252m and [Si x] 1.430m, − display a narrow range in luminosity, with most lines located in the interval log 39 - 40 erg s-1. We found that the non-detection is largely associated with either a lost of spatial resolution or increasing object distance: CLs are essentially nuclear and easily loose contrast in the continuum stellar light for nearby sources or get diluted by the strong AGN continuum as the redshift increases. Yet, there are AGNs where the lack of coronal emission, i.e., lines with IP 100 eV, may be genuine. The absence of these lines reflect a non-standard AGN ionising continuum, namely, a very hard spectrum lacking photons below a few Kev.
The analysis of the line profiles points out to a trend of increasing FWHM with increasing IP up to energies around 300 eV, where a maximum in the FWHM is reached. For higher IP lines, the FWHM remains nearly constant or decreases with increasing IP. We ascribe this effect to an increasing density environment as we approach to the innermost regions of these AGNs, where densities above the critical density of the CLs with IP larger than 300 eV are reached. This sets a strict range limit for the density in the boundary region between the narrow and the broad region of 10 cm-3.
A relationship between the luminosity of the coronal lines and that of the soft and hard X-ray emission and the soft X-ray photon index is observed: the coronal emission becomes stronger with both increasing x-ray emission (soft and hard) and steeper X-ray photon index, i.e. softer X-ray spectra. Thus, photoionization appears as the dominant excitation mechanism. These trends hold when considering Type 1 sources only; they get weaker or vanish when including Type 2 sources, very likely because the X-ray emission measured in the later is not the intrinsic ionising continuum.
1 Introduction
Coronal lines (CLs) are emission features arising from forbidden transitions of excited states of highly ionized species ( 100 eV), implying the existence of very energetic processes occurring in or near the narrow line region (NLR). Torus (Pier & Voit, 1995), close or in part of the broad line region (Shuder & Osterbrock, 1981; Cohen, 1983), NLR (Pelat, Alloin & Bica, 1987; Appenzeller & Östreicher, 1988) and extended narrow line region (ENLR) (Korista & Ferland, 1989; Murayama, Taniguchi & Iwasawa, 1998) have being proposed as possible locations for the formation of these lines in active galactic nuclei (AGNs).
CLs, also referred by some authors as Forbidden High Ionization Lines (FHILs), are excited by collisions. What it is not clear is the type of mechanism responsible of the high ionization of the species. Two basic processes has been proposed in order to explain the high level of ionization: photoionization due to the central source, which emits an intense ionizing continuum, particularly hard UV and soft X-ray (Shields & Oke, 1975; Grandi, 1978; Penston et al., 1984; Korista & Ferland, 1989; Ferguson et al., 1997; Oliva, Marconi & Moorwood, 1999); and shocks between high velocity clouds and the narrow line region gas, i.e., collisional ionization much alike of the process occurring in the solar corona (Osterbrock & Parker, 1964; Oke & Sargent, 1968). There exists a third intermediate possibility: a combination of the above two processes (Viegas-Aldrovandi & Contini, 1989). Recent works conclude that although nuclear photoionization is the main excitation mechanism, in order to reproduce adequately the observed emission line ratios, a contribution of shocks is necessary (Rodríguez-Ardila et al., 2006; Geballe et al., 2009).
Since the mid 70s, it has been claimed that optical CLs tend to be broader than lower ionization forbidden lines and its centroid position blueshifted with respect to the systemic velocity of the galaxy (Grandi, 1978; Cooke et al., 1976; Penston et al., 1984). Indeed, a correlation is found between the ionization potential (IP) necessary to create the ionized specie and the line width (Wilson, 1979; Pelat, Alloin & Fosbury, 1981; Evans, 1988). All together, this result is interpreted as the coronal region be located between the narrow and the broad line region and subjected to radial motions in some cases, probably associated to outflows (Penston et al., 1984; Ward & Morris, 1984).
With the recent generation of high-sensitive detectors in the near infrared region (NIR), observations of a significant number of Seyfert galaxies has now been possible (Giannuzzo, Rieke & Rieke, 1995; Prieto & Viegas, 2000; Lutz et al., 2002; Rodríguez-Ardila et al., 2002; Reunanen, Kotilainen & Prieto, 2003; Riffel, Rodríguez-Ardila & Pastoriza, 2006; Geballe et al., 2009; Müeller Sánchez et al., 2011). As a consequence, new CLs have been added up to list (i.e., [S viii], [S ix], [Fe xiii], [Si vi], [Si vii], [Si ix], [Si x], [Ca viii]) allowing a revision of previous findings and a more consistent analysis of a complex emitting region. Among the most important results that can be mentioned are that the CLR is not restricted to the unresolved nucleus although it does not extended to the kpc range. Prieto et al. (2004); Rodríguez-Ardila et al. (2006), for instance, detect CLs at distances of up to a few hundreds of parsecs from the nucleus. These authors also report that the highest ionized species show the smallest emitting region size of the NLR, which is in agreement with photoionization from the nucleus. These results gathered additional support by the recent work of Müeller Sánchez et al. (2011), who studied the spatial distribution and kinematics of the NLR and CLR of seven AGN usign SINFONI and OSIRIS near-IR AO-assisted integral field spectroscopy at spatial scales ranging from 4 to 36 pc. They found that the two regions present a bright compact core and extended emission, with the CLR being more compact than the NLR, with typical sizes of the former between 80 and 150 pc in radius. Moreover, both regions display a similar dispersion velocity although the high-ionization gas presents more deviant behavior with velocity fields dominated by non-circular motions, associated to outflows.
The aims of this paper are twofold. First, to carry out the largest compilation of CLs published to date in the near infrared region (0.8-2.4 m) and second, from the study of this database, to draw clues about the excitation mechanisms of these lines by looking for a connection between their luminosity and broad-band measurements in other spectral regions. As the sample contains a significant number of Type 1 (Ty1, hereafter) and Type 2 (Ty2, hereafter) AGNs, a discussion of viewing angle effects and thus the most likely location of the CLR will be done. This paper is structured as follows. Section 2 describes the selection of the sample; Section 3 presents the main results, with emphasis of the relation between FWHM and IP; the relation of CLs with soft and hard X-rays is discussed in section 4 and Section 5 contains the Summary and main conclusions.
2 Sample Selection
The sample of AGNs chosen for this work was selected primarily from the galaxies studied by Riffel, Rodríguez-Ardila & Pastoriza (2006, RRAP06). It includes 47 Seyferts and quasars observed in the wavelength interval 0.8-2.4 m and collected using cross-dispersed spectroscopy at IRTF. Description of the conditions of the observations, instrumentation details and reduction process can be found in RRAP06.
RRAP06 sample was complemented with an additional sub-sample of active galaxies with published data on CLs covering a similar wavelength interval. These objects are: Circinus (Oliva et al., 1994; Müeller Sánchez et al., 2006), NGC 1068 (Marconi et al., 1996; Thompson, 1996; Rodríguez-Ardila et al., 2006), Mrk 335, Mrk 1044, Ton S180, NGC 863 (Rodríguez-Ardila et al., 2002), Mrk 766 (Rodríguez-Ardila, Contini & Viegas, 2005), Mrk 1210 (Mazzalay & Rodríguez-Ardila, 2007) and Mrk 78 (Ramos-Almeida et al., 2006). Basic information of the selected galaxies is shown in Table 1. The objects are listed in increasing order of right ascension. The final sample is composed of 54 AGNs: 36 of Ty1 (19 of which are narrow line Seyfert 1, NLS1) and 18 of Ty2. Values of redshifts were taken from the NED database. The last column indicates whether or not the galaxy displays at least one CL (at 3 detection) in the 0.82.4 m region. Objects marked with “N” do not show CLs in the the NIR spectrum. Yet, some of the them have CLs in other spectral ranges: these are: Mrk 334 ([Fe x] , Osterbrock & Martel (1993) and [Ne v] 14.3 m, Prieto & Viegas (2000)), NGC 1144 ([Ne v] 14.3 m, Prieto & Viegas (2000)), NGC 2110 ([Fe vii] and [Fe x] , Shuder (1980)), NGC 5929 ([Fe x] , Osterbrock & Martel (1993)) and Mrk 493 ([Fe vii] , Crenshaw et al. (1991)). All other AGN marked with “N”, to our knowledge, do not display any coronal lines either in the NIR or in any other wavelength region.
3 Results
3.1 Frequency of coronal lines
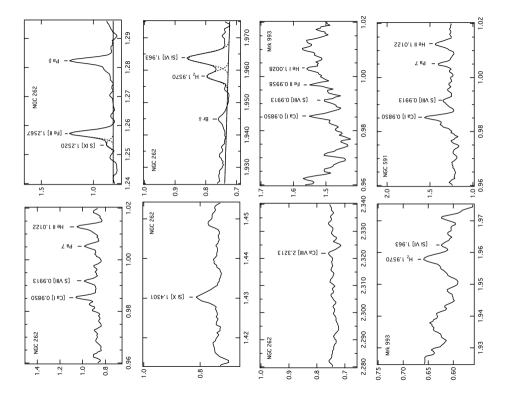
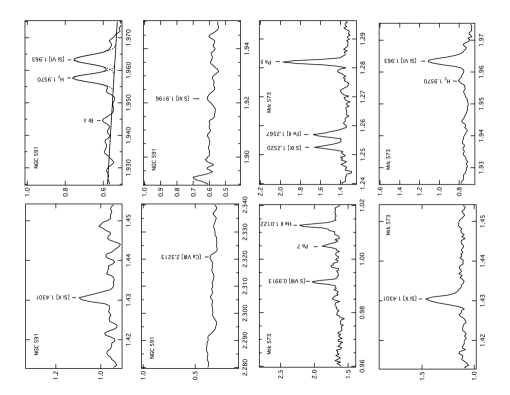
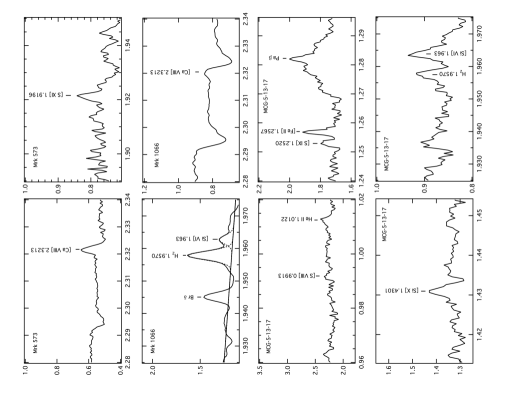
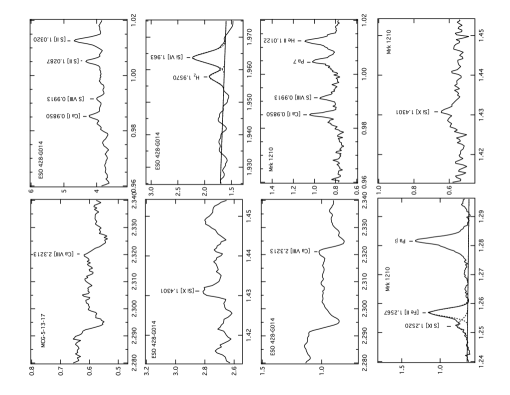
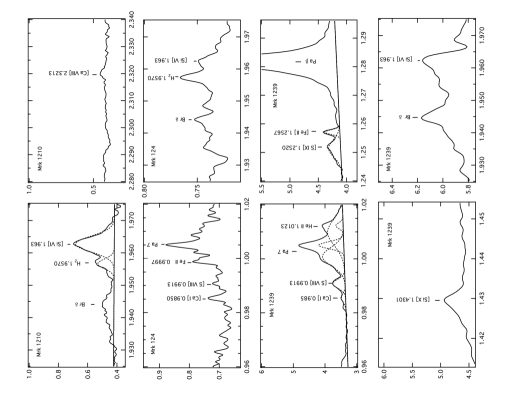
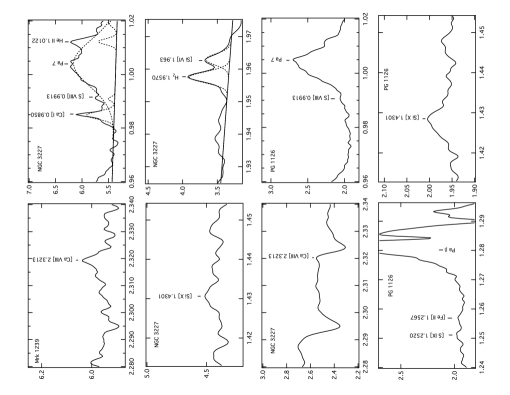
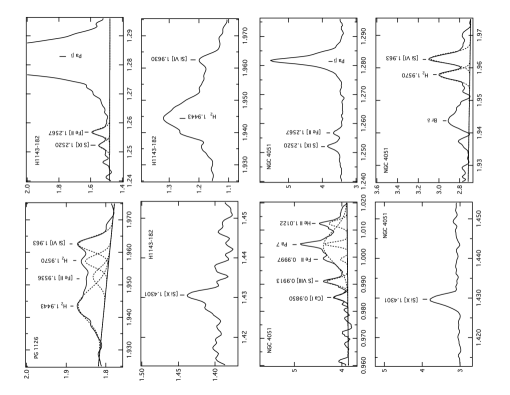
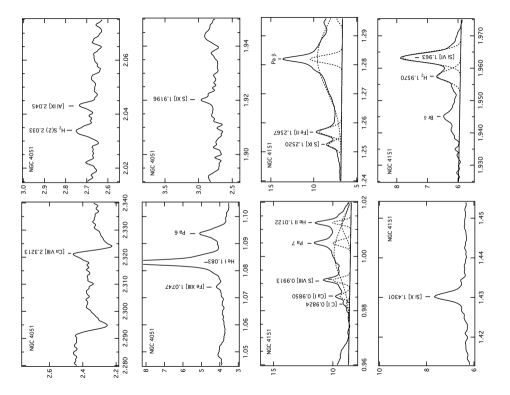
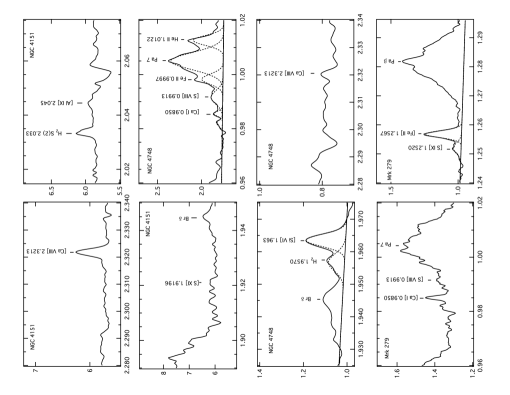
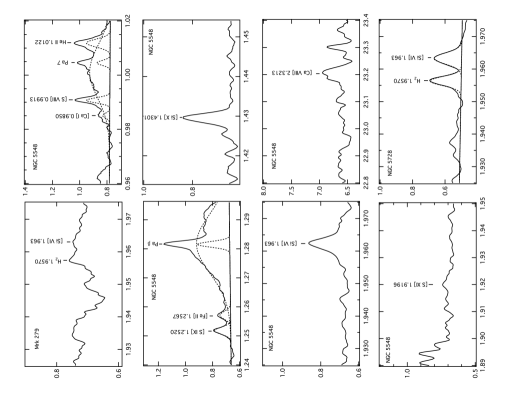
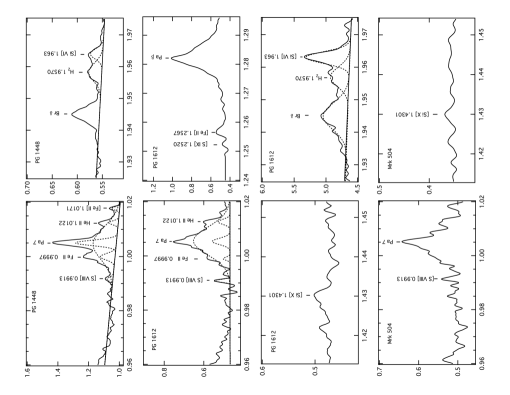
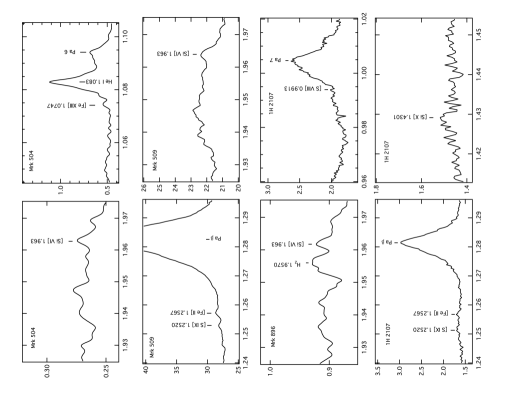
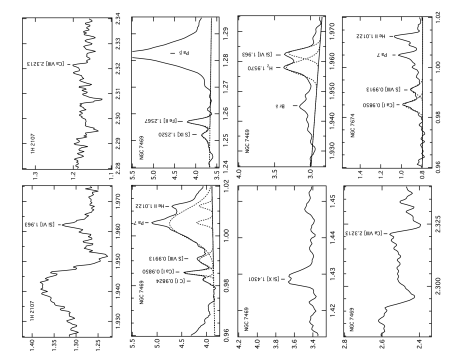
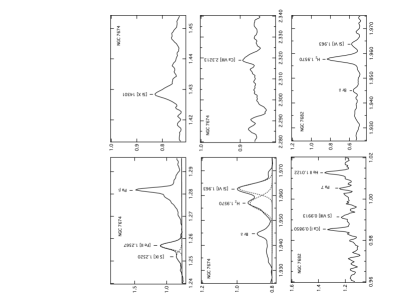
The CLs that fall in the spectral window 0.82.4 m are [S viii] 0.9913 m, [Fe xiii] 1.0747 m, [S ix] 1.252 m, [Si x] 1.4301 m, [S xi] 1.9196 m, [Si vi] 1.9630 m, [Al ix] 2.0450 m and [Ca viii] 2.3213 m (See Tab 3). Few objects in the sample display all them simultaneously. For each object with at least one CL detected, Figures 1 to 7 show a zoom of the spectral region containing the CL. We found that 36 out of 54 galaxies (66%) display at least one CL. Of the remaining 18 sources, five of them show CLs in other spectral ranges (optical and/or mid-IR), as reported in the literature (see Sect. 2). Adding these 5 objects, the number of AGN with at least one CL - i.e. from ions with IP 100 eV - in any range of the spectrum increases to 41, that is, 76% of the sample.
Table The Near-Infrared Coronal Line Spectrum of 54 Nearby Active Galactic Nuclei lists the CLs fluxes measured in sample along with fluxes of the narrow components of Pa and Br, except when indicated. Because of discrepancies either in the line fluxes or in the uncertainties relative to the values published by RRAP06 in some cases, we have reviewed all their measurements and these are the ones presented in Table The Near-Infrared Coronal Line Spectrum of 54 Nearby Active Galactic Nuclei. In cases of line blending, a multiple Gaussian fit was applied. Upper limits are reported for the expected position of the lines if they were not detected above 3 level.
It is easy to see from Table The Near-Infrared Coronal Line Spectrum of 54 Nearby Active Galactic Nuclei that for all 3- detections, the most frequent and conspicuous CLs in the sample are those of silicon and sulfur, and among those, the ones with the lowest IP ( 300 eV) are the strongest. CLs from other elements, e.g., Ca, Al or Fe, are less frequent and weaker, the former two being affected by metallicity effects and depletion onto dust, while the later may be not be that much affected. Indeed, the iron optical coronal lines are rather strong. [Fe vii] 6087Å for instance, is even stronger than the strongest NIR CL [Si vi] 1.963m (e.g. Rodríguez-Ardila et al. (2006)). Yet, the [Fe xiii] 1.0747m line traced in this work is located in wing of the strongest NIR line, He i 1.0830m, which most probably hampers its detection in most cases. Overall, [Si vi] 1.963m, [S viii] 0.991m, [Si x] 1.431m and [S ix] 1.252m are the lines with the largest number of detections, being observed in 30, 24, 22 and 20 objects, respectively. For that reason, the rest of the analysis shall focus on these lines only.
Figure 8 shows a histogram with the number of galaxies per bin in luminosity (full line for Ty1 and dashed line for Ty2) in each of the above four lines. Upper limits are not included. Broadly speaking, the distribution in luminosity for both types of AGNs is similar, with most lines located in the interval log 39-40 erg s-1 and the whole sample spanning 3 dex in full-width around that interval. Note that the numbers above are similar to the range of [Fe x] 6374 Å luminosity reported by Gelbord et al. (2009) using a sample of 63 AGN with strong high-ionization emission lines, none of them common to our sample. Figure 8 also suggests a similar percentage between the two types of AGNs that display [Si x] and [S ix] (40% and 35%, respectively). Ty2, however, slightly outnumbers Ty1s in the lower ionization CLs [Si vi] and [S viii]: 67% vs 50% and 56% vs 39%, respectively. These differences can be attributed to the relatively higher redshift - - of Ty1 objects, making the detection of CLs more difficult due to the poorer spatial resolution sampling. In addition, when , both lines start falling in low atmospheric transmission zones or strong telluric absorption, hindering their detection. Note that only one Ty2 of the sample (Mrk 78) has while 35% of Ty1s exceeds this redshift.
Similar results on the frequency of coronal line emission in Seyfert galaxies regardless of their type have been reported in the literature, albeit on the basis of smaller samples. Most of these works are conducted in the NIR (e.g Prieto & Viegas, 2000; Reunanen, Kotilainen & Prieto, 2003; Rodríguez-Ardila et al., 2006; Prieto, Marco & Gallimore, 2005) and mid -IR (e.g. Prieto & Viegas, 2000). They all sample CLs from elements including Si and Mg, which could get easily depleted from the gas phase if dust is present. Yet, all these works show that Ty2 objects show as rich and strong CL spectra as those of Ty1. However, analysis done on the basis of the optical CL spectrum, mainly on iron lines, indicate opposite results. Works done by Murayama & Taniguchi (1998); Nagao, Taniguchi & Murayama (2000) and Gelbord et al. (2009), for instance, remark a significant weaker optical CL in Ty2 than in Ty1s. These authors argue that the frequency and strength of the CL spectrum should thus depend on the orientation of the torus with the line of sight, being in Ty2 sources partially or totally obscured. As a consequence, the CLR should form at the inner face of the torus.
Two relevant issues may explain these conflicting results. First, the extinction in the NIR is a factor 10 lower than in the optical. As Ty2 sources are more absorbed, this has a definitive impact on the detection and the measurement of optical CLs, mostly considering that they are relatively weak features. Indeed, a recent discovery of a Ty2 quasar with an outstanding high-ionization spectrum and zero internal extinction (Rose et al., 2011) supports this argument. In moving to the NIR, the situation changes dramatically for strongly reddened sources. Prototype Ty2 AGNs such as NGC 1068 or Circinus, not only show the full spectrum of CLs (i.e., Si, Al, Ca, among others), but in addition, these are the dominant lines in their spectra (Moorwood et al., 1996; Reunanen, Kotilainen & Prieto, 2003; Müeller Sánchez et al., 2009, 2011).
Second, spatial resolution should be taken into account in Ty2s for CL detection, especially in the optical but also in the NIR. Circumnuclear star formation, which is often more relevant in Ty2s, increases the continuum level with the corresponding lost of line contrast. A stoning illustration of this effect is the nucleus of Centaurus A. It shows no CLs either in optical or in the NIR in seeing limited conditions (Reunanen, Kotilainen & Prieto, 2003). But observations with adaptive optics reveal the K-band CLs of [Si vi] 1.963 m and [Ca viii] 2.34 m (Neumayer et al., 2007).
Additional arguments against the CLR being obscured by the torus can be gathered from Circinus, NGC 1068 and Centaurus A. They all are extreme Compton thick sources even in the hard X-rays. Under that condition, it is difficult that any optical CL emission could be seen if their bulk is produced in the inner face of the torus. Moreover, the high spatial resolution studies conducted by Rodríguez-Ardila et al. (2006) and Mazzalay, Rodríguez-Ardila & Komossa (2010) show that Ty2 sources display strong [Fe vii], [Fe x] and [Fe xi] lines, with emitting regions extending to distances of a few hundred parsecs from the centre in the case of NGC 1068. That is, well beyond the expected size of the putative torus. Moreover, a dusty CLR implies in a very weak coronal line spectrum because of the absorption of the incident continuum by dust at large U(H) Ferguson et al. (1997). Although we do not rule this later hypothesis for those objects where no coronal lines are seen, at least those that displays CLs should have the bulk of the CLR outside the torus.
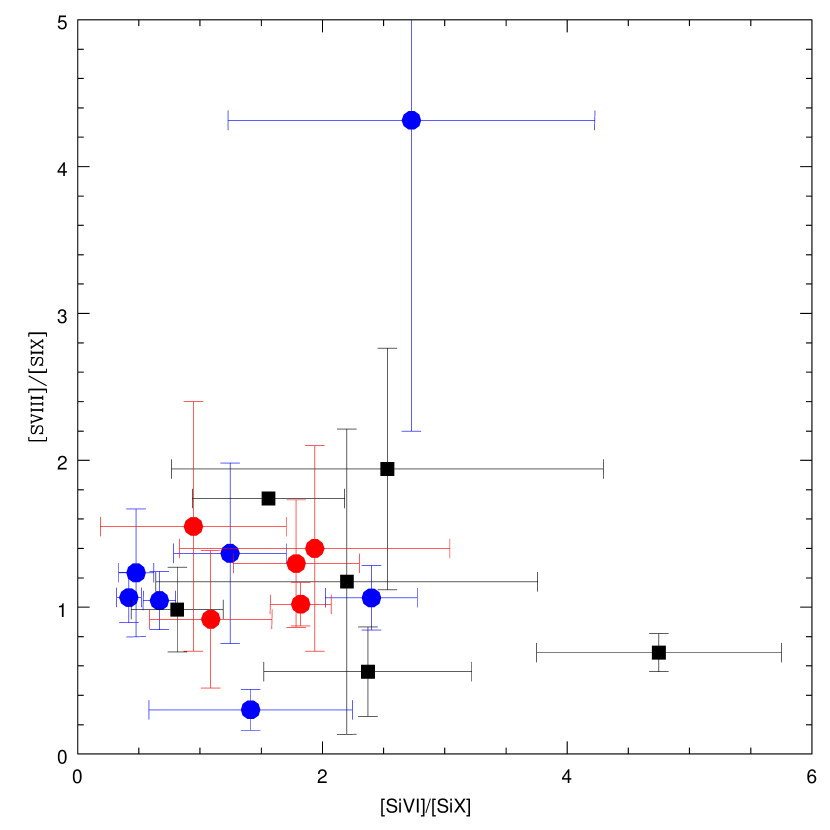
In spite of the difference in coronal line luminosity between the galaxies, covering 3 dex in each of the four lines considered (see Fig. 8), the flux ratios [Si vi]/[Si x] and [S viii]/[S ix] are distributed in a very narrow interval of values, as can be seen in Fig 9. Moreover, no distinction between Ty1 and Ty2 AGNs is observed in both ratios, giving additional support to our previous finding of similar frequency of CLs in both type of objects. Note that these two ratios are independent of the metallicity as they contain ions of the same element. The abscissa is strongly sensitive to the form of the ionizing continuum because the difference in IP between [Si vi] and [Si x] is 184 eV (see Table 3) while the ordinate ([S viii]/[S ix]) is not: the difference in IP between both ions is only 50 eV. It is easy to see that the scatter is the former ratio is restricted to 0.7 dex, with an average value of the ratio equal to 1.4. For the later, it is no larger than 0.4 dex, with an average of 1.1. Clearly, the bulk of CL fluxes should be produced outside the torus region because the two ratios and their scatter are very similar in Ty1 and Ty2 AGNs. Observational evidence of this scenario was recently obtained by Müeller Sánchez et al. (2011). They quantified the extent of the CLR by means of azimuthal averages within circular radial annuli of the flux distribution of [Si vi] in a sample of seven AGNs, four of them common to our sample (Circinus, NGC 1068, NGC 4151 and NGC 7469). Their results show that the flux distribution is resolved and extended, supporting an origin of the CLs in the inner part of the NLR or in the transition region between the BLR and the NLR.
Recent studies (Whittle et al., 2005; Schlesinger et al., 2009; Mazzalay, Rodríguez-Ardila & Komossa, 2010) have pointed out photoionization as the main driver for the coronal lines. Yet, we note that detailed analysis of CL flux ratios as done in Rodríguez-Ardila et al. (2006) on the basis of [Fe x]/[Fe vii] vs [Fe xi]/[Fe vii] or [Fe xi]/[Fe x] show that photoionization alone is not enough. Photoionization models predict the general trend of these ratios but specific values are not matched even if considering new calculations of collision strengths for iron. Rodríguez-Ardila et al. (2006) show that adding the extra power of shocks of different velocities to photoionization improves the match between the observed iron ratios and those predicted. Note that AO observations of the CLR carried out by Müeller Sánchez et al. (2011) support this picture. They found kinematic signatures of outflows in NIR high-ionization lines of a sample of nearby AGNs, with the radio jet clearly interacting with the ISM, indicative of a link between jet power and outflow power.
The lack of coronal lines above certain energies may be related to a deficient ionizing continuum. This would explain why some objects display [Si vi] (IP=166 eV) and [S viii] (IP=280 eV) but not lines of higher IP. Examples of this among the nearest objects in the sample are Mrk 1066, NGC 5728 - both lacking lines with IP 166 eV or NGC 3227 and NGC 7682 - both lacking lines of IP 280eV (see Table The Near-Infrared Coronal Line Spectrum of 54 Nearby Active Galactic Nuclei). A similar argument applies to some of the objects studied by Mazzalay, Rodríguez-Ardila & Komossa (2010) on HST/STIS spectra: some of their objects, including NGC 3227, display [Ne v] and [Fe vii], both with IP 100 eV, but not higher optical ionization lines. The results for NGC 3227 are further supported by Rodríguez-Ardila et al. (2006), who report on the non detection of [Fe xi] 7892Å ( IP=260 eV).
Distance should also play a major role in the detection of CLs: these are relatively weak features and loose of contrast over the stellar continuum light in low-luminosity nearby AGNs hampers their detection. This argument is supported by results derived from Riffel et al. (2009), who modeled the NIR continuum emission of AGNs in terms of stellar population, AGN featureless continuum and hot dust in 9 Ty1 and 15 Ty2 galaxies. These 24 sources are also studied in this work using the same set of data. Cross-crossing Riffel et al.’s results with ours allow us to conclude that for most Ty1 and Ty2 objects where no CLs are detected, the contribution of the stellar population dominates the observed NIR continuum (see Table 3 of Riffel et al., 2009). For example, in the Ty1 sources NGC 1097 and Arp 102 B, 96% and 89%, respectively, of the observed continuum is due to stars. Similarly, in the Ty2s NGC 1144, NGC 5929 and NGC 5953, more than 90% of the observed continuum is due to that component.
In high-luminosity AGNs, the strong continuum emitted by the central source would also dilute the CLs, in a similar way the stellar population affects the CLs in nearby sources. Note that the effect of dilution, in this case, gets severe with increasing . Observational evidence of this hypothesis can be gathered by examining the work of Glikman, Helfand & White (2006), who constructed the first quasar composite spectrum in the NIR using a sample of 27 quasars with between 0.118 - 0.418. A close examination to Glikman et al.’s data shows that no coronal lines are observed either in the individual sources nor in the composite template. Indeed, the only forbidden line that is clearly detected is [S iii] 0.906 m. Under the assumption that photoionization by the central engine is the dominant source of gas excitation, dilution by the AGN continuum would preferentially affect lines emitted by the NLR. Thus, the line flux ratio Pa/[S iii] 0.906 m can be used as a metric for this effect. Note that the total flux (narrow + broad) of Pa can be employed here as the broad component of that line dominates the line flux in Ty1 sources.
The value of the above ratio measured in the composite NIR quasar spectrum of Glikman, Helfand & White (2006) is 12.4 (See Table 6 of that work). Dilution would tend to increase that value. In our sample, nearby Ty1 sources have ratios approaching 4 at most (1H 1934-063, NGC 4748 for instance) while PG 1612+261 (=0.1309) has a ratio of 11.6. In very luminous objects like Mrk509 (=0.034), that ratio reaches to 30. These results evidence that the AGN continuum indeed dilutes the features emitted by the NLR in luminous sources. Note that [S iii] 0.906 m is the strongest forbidden line observed in the NIR, being at least 5 stronger than [Si vi] 1.963 m, the strongest coronal line of our survey.
The range of our sample is 0.0015 0.5, median 0.02, 1420 pc (Table 1), and in general, most objects with 0.005, 1 110 pc, show CLs, although not always in the full range of ionization potentials. Above this , there are a size able number of objects with coronal emission, some with a remarkable spectrum, e.g. Mrk 573 (Ty2), 1360 pc, whereas others at equivalent or inferior distances do not show emission despite of the high Signal-to-Noise ratio (S/N) of the spectra, eg. NGC 1275 (Ty2) or NGC 1144 (Ty2), both at similar distance as Mrk 573 (Table 2).
All the above suggest that aside physical parameters (ionizing continuum, metalicity, gas density or dust) observational issues like S/N or the spatial scale in the sky, strongly influence the detection of coronal lines. In the following sections we will collect information from the NIR to increase our knowledge of the physics of the CLs to complement the picture already gathered from the visible region.
3.2 Kinematics of the coronal line region
This section explores the correlation between the ionised gas velocity, as measured by the line FWHM, and the ionization level of the gas, as measured by the IP of the corresponding line. If photoionization is the major mechanism, a correlation between these two parameters is expected. This is because the highest the gas ionization level (high IP), the closer to the nucleus is its location, therefore, the greatest is its motion within the gravitational potential wells of the super massive black hole and host galaxy. Coronal lines are very suitable to study this prediction given the high range of IPs they cover. Most of the results published to date have been drawn from the study of small number of objects and CLs. The larger number of galaxies examined here and the inclusion of eight CLs of different ions and wide range of IP allow us to investigate the FWHM-IP relationship in more detail.
In the late 70s, Wilson (1979) reported for NGC 3783 a strong correlation between FWHM and ionization potential of various optical forbidden lines, with the CLs showing the largest FWHM and low or medium ionization lines the smallest ones. Later works reported a similar trend in other active galaxies with either optical or NIR lines (Osterbrock, 1981; Pelat, Alloin & Fosbury, 1981; Penston et al., 1984; Thompson, 1995). Conversely, Giannuzzo, Rieke & Rieke (1995) found that CLs show an ample variety of FWHMs, leading to the conclusion that the CLR occupies different regions in different galaxies. Reunanen, Kotilainen & Prieto (2002, 2003) study the CLs in the 1.5-2.5 m range in 14 Seyfert galaxies. In only four of them a positive correlation between FWHM and IP could be established. Rodríguez-Ardila et al. (2002) in a sample of six galaxies (5 classified as NLS1), found a positive correlation in three of them. Other observations have also shown that CLs can display no correlation at all or even an anti-correlation between FWHM and IP. Such is the case of NGC 4151 (Knop et al., 1996), where [S xi] 1.9196 m has a FWHM significantly lower than the narrow component of Pa. Similarly, Marconi et al. (1996) reported for NGC 1068 FWHM values for [Fe xi] 0.7892 m and [Si ix] 3.9350 m smaller than those of [Fe ii] 1.257 m whereas Rodríguez-Ardila et al. (2006) and this work (Table The Near-Infrared Coronal Line Spectrum of 54 Nearby Active Galactic Nuclei) find the opposite: low- and intermediate- ionization lines present FWHMs smaller or at least comparable to those of the optical and near-IR CLs.
Table The Near-Infrared Coronal Line Spectrum of 54 Nearby Active Galactic Nuclei lists the FWHM of the CLs (corrected from instrumental width, 360 km s-1) along with the FWHM of [S iii] 0.953 m and [Fe ii] 1.257 m, two of the strongest medium- to low-ionization lines detected in the galaxy sample. In order to measure the FWHM the emission lines were assumed to be well represented by a single or a combination of Gaussians profiles (see Figs. 1 to 7). The LINER routine (Pogge & Owen, 1993) was used in this process.
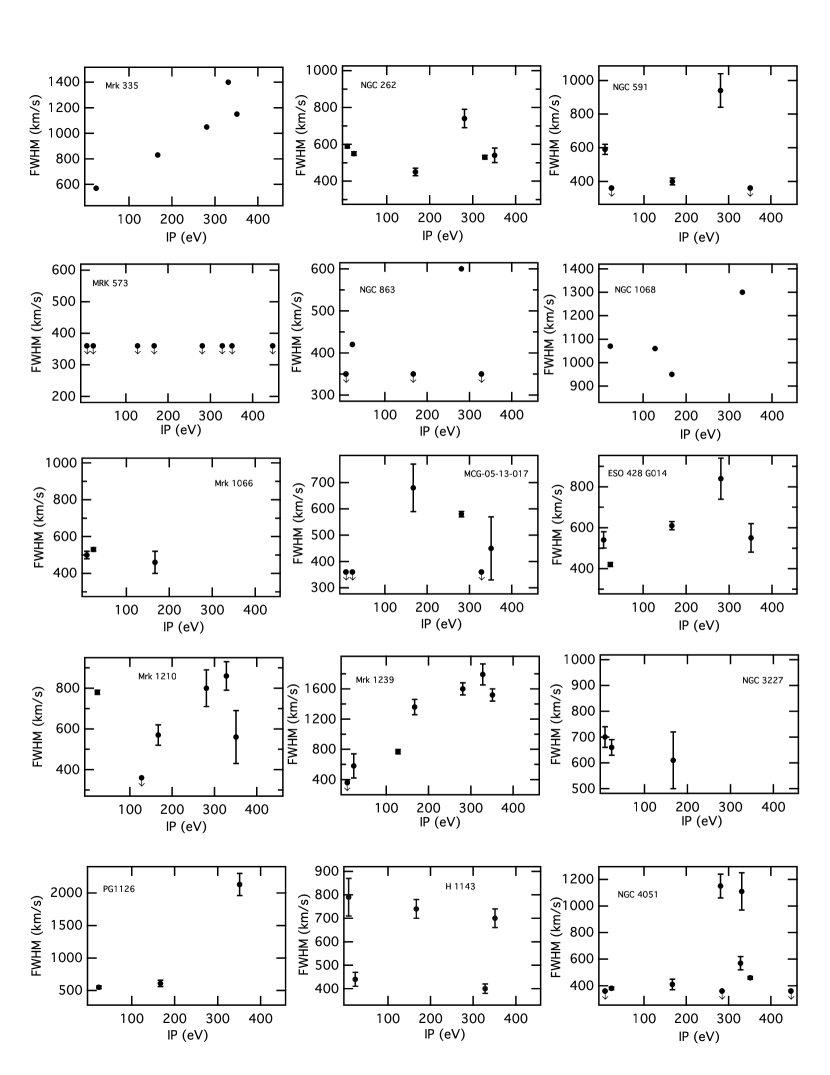
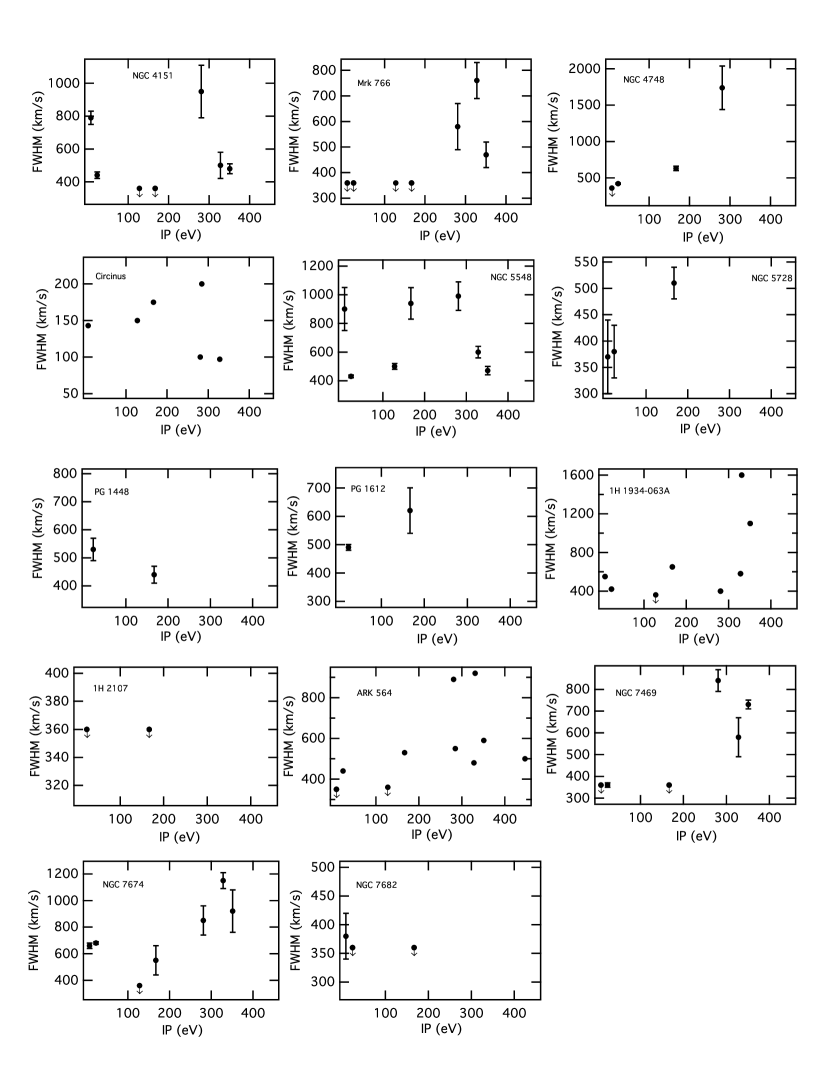
Figures 10 and 11 show plots of FWHM vs IP for each of the galaxies in the sample that display at least two coronal lines. For comparison purposes, the FWHM of the lower ionization lines [S iii] 0.953m and [Fe ii] 1.257m are also included. It can be seen that in some of the AGNs with sufficient number of CLs, a trend of increasing FWHM with IP is observed but up to energies of about 200300 eV. In following this trend, we focus on the strongest CLs, namely those from Si and S, and ignore those of Fe and Ca as they are overall weaker and their FWHM more difficult to measure or subjected to larger uncertainties. At higher energies the FWHM, in particular of the most conspicuous and frequent lines, namely [S ix] and [Si x], remains constant or start decreasing with increasing IP. These are, for example, the cases of Mrk 335, ESO 428-G14, Mrk 1210, Mrk 1239, NGC 4051, Mrk 766, Ark 564, NGC 7469, NGC 7674 and tentatively, Circinus, We have labeled these objects as “P” (peak at about 300 eV) in the last column of Table The Near-Infrared Coronal Line Spectrum of 54 Nearby Active Galactic Nuclei. In contrast, NGC 4151 and NGC 5548, two of the galaxies with the highest S/N in the sample, the FWHM shows no dependence with IP. In both objects, some CLs have widths comparable or even smaller than those displayed by low-ionization lines, confirming previous results reported by Knop et al. (1996). All other remaining objects do not show a trend or it is difficult to evaluate it because all emission lines are unresolved.
Table The Near-Infrared Coronal Line Spectrum of 54 Nearby Active Galactic Nuclei and Figures 10 and 11 allow us to state that overall, no particular trend between FWHM and IP is seen in regard to the type of AGN. The subset of galaxies that we have labeled “P” contains similar proportion of both types of objects. Similarly, for the objects where no trend in seen, no difference between Ty1 and Ty2 is observed, reinforcing the results already discussed in the preceding section. That is, a CLR located outside the torus region. Differences observed from object to object is rather due to variations in the physical properties rather than to a viewing angle dependence.
The increase of FWHM with IP up to a peak energy of about 300 eV is interpreted as due to a combined effect of increasing electron density gradient towards the centre and spatial extension of the CL gas. The critical density of [S viii] (IP=280.9 eV) and that of [S ix] (IP=328.2 eV), two of the most common lines in the sample, are the highest among the CLs studied: = 4 and 2.5 cm-3, respectively. Thus, their critical density sets up an upper limit for the in the coronal line region to be cm-3. However, the CLs with higher IP (i.e., [Si x], [S xi] and [Fe xiii]) have critical densities lower than the above values, by almost an order of magnitude (see Table 3). Therefore, if the density increases steeply towards the center to values cm-3, these later two high IP lines might get severely suppressed. Specifically, their high-velocity component would not be observed due to collisional de-excitation. Only their low velocity component - which should arise further out from the center - would be seen. This would explain the observed decrease or constancy of the line FWHM with IP.
It is difficult to ascribe the absence of high velocity component in high IP lines to dust: absorption of the ionising photons will affect low and high velocity gas components alike. Depletion of the gas phase on dust is also not realistic as that will tend, if any, to reduce the low velocity component of the gas, which is formed further out from the dust sublimation radii, instead of the high velocity one (see Ferguson et al. 1997). In this respect, silicon lines, which should be largely depleted, show [Si x] 1.43 m (IP=351 eV) with FWHM comparable to that of [Si vi] 1.963 m (IP =167 eV) but still smaller than that measured for [S viii] (IP=280) which is little affected by depletion. Clear examples are NGC 262, MCG 05-13-17, ESO 428-G014, Mrk 1210, NGC 4151, Mrk 766, NGC 5548 and NGC 7469.
The results above allow us to conclude that (i) a strict limit for the density in the interface region between the coronal and the broad line region can be set in the range 10 cm-3; (ii) the expected FWHM-IP correlation is modulated by the critical density of the corresponding ion. If a wide range of densities is present in the NLR - CLR region, we may indeed expect a strong correlation between the FWHM and the critical density, as already put forward by Pelat, Alloin & Fosbury (1981); Penston et al. (1984); De Robertis & Osterbrock (1986) and Ferguson et al. (1997).
4 The relation between the coronal and X-ray emissions
In order to produce the observed CLs, ionizing energies in the range 127450 eV are necessary. If photoionization by a central source is the dominant excitation mechanism, a positive relation between X-ray strength and the coronal line luminosity is expected. Attempts have been made in order to look for connections between X-rays and CLs intensities but with conflicting results. Penston et al. (1984) found no correlation between [Fe x] and the X-ray 210 keV luminosity, L2-10keV. Porquet et al. (1999) found, based on numerous data extracted from literature, a clear correlation between the luminosity of [Fe x] and the ROSAT X-ray luminosity, L0.1-2.4keV. Similarly, a positive trend, both in flux and luminosity, between the CLs [O iv] 25.9 m and [Ne v] 14.3 m and the ROSAT L0.1-2.4keV emission is found by Prieto, Pérez García & Rodríguez Espinosa (2002). However, these authors found no correlation when considering the hard X-ray 210 keV luminosity.
Considering the large dataset gathered in this work, the possible relationship between the soft and/or the hard X-ray and the CL emission is explored in more detail. We choose [Si vi] 1.963 m and [S viii] 0.991 m as representative lines of the coronal region as they are the most frequent in the sample. Moreover, this comparison allows us to see if there are differences between coronal lines emitted by refractory and non-refractory elements.
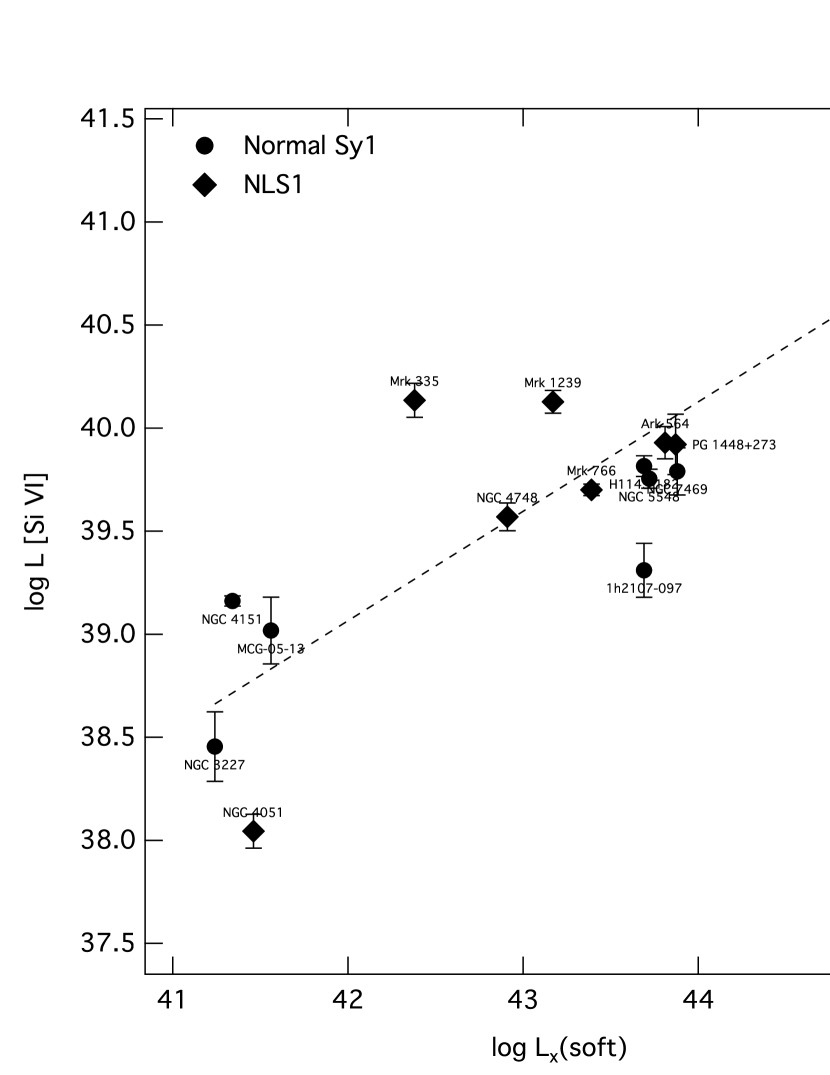
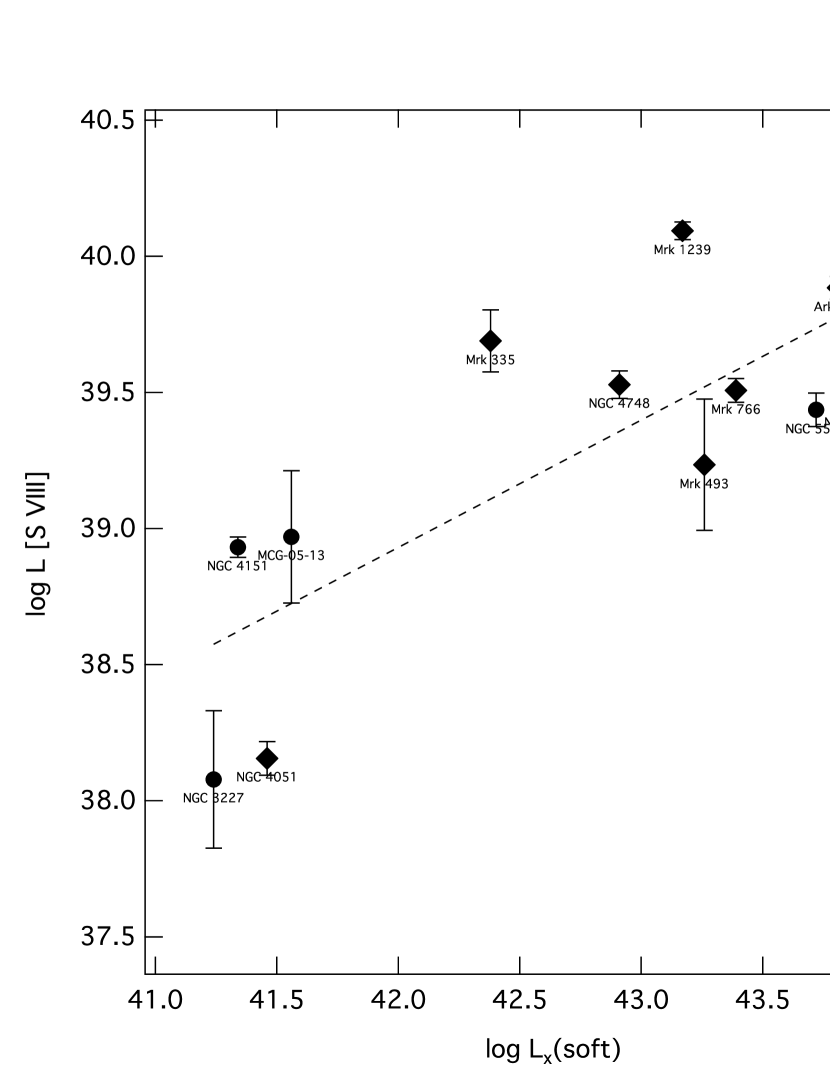
Figures 12 and 13 display the soft X-ray luminosity, Lx [soft], integrated either over the 0.12.4 keV or the 0.52.0 KeV interval, corrected by absorption, versus the luminosity of [Si vi] 1.963 m, and [S viii] 0.991 m, respectively. Only Ty1 sources are included. The nature of the soft X-rays in Ty2 sources is questionable, in particular, in view of Chandra and XMM spectra, which show the X-ray emission resolved in emission lines (e.g. Bianchi, Guainazzi & Chiaberge, 2006). Under low level activity, a few Ty1 sources have also shown a soft X-ray emission line spectrum (e.g. Nucita et al., 2010, and references therein). Still, the bulk of their emission is expected to be dominated by the AGN continuum light.
It can be seen from Figs. 12 and 13 a trend of increasing CL with soft X-ray luminosity. The linear correlation coefficient is 0.8 and 0.77, respectively, determined using all points, with no distinction between normal and NLS1 galaxies. The soft X-ray spans four orders of magnitude whereas the coronal luminosity just two, so the distance factor that stretch both axis should not be the major driver of the trend. These results are consistent with the trend found by Gelbord et al. (2009) using the luminosity of [Fe x] 6374 Å line and that of the 0.1-2.4 keV band .
Figures 14 and 15 show the power law photon index, , of the soft X-rays as defined by Walter & Fink (1993) versus the coronal line luminosity for the same two lines. The linear correlation indices in these cases is lower: 0.31 and 0.62, respectively, very likely due to the scatter introduced by NLS1 galaxies, which are usually characterized by a prominent soft excess. Indeed, note that they have the largest values of and a higher CL luminosity.
To our knowledge, only Erkens, Appenzeller & Wagner (1997) have explored the incidence of on the CLs. They found that the values for the photon index are related to the equivalent width of [Fe x] 0.6375 m, concluding that strong CL emission is present predominantly in AGNs with a soft excess ( 2.5). Figures 14 and 15 also suggest a photon index threshold: most objects have above 2. NGC 3227 has a harder spectrum (see both figures), meaning that it has a deficiency in high energy EUV photons when compared to sources with above 2. It is interesting to note that its CL spectrum has also a clear threshold in IPs, as CLs with IP 166 eV are barely detected (see Fig. 3 and Sect 3).
Regarding the hard X-rays, Figure 16 shows the absorption-corrected luminosity, , versus the luminosity in [Si vi] 1.963 m. For illustrative purposes, Ty2 sources are now included in the figure. There is a large scatter in the plot but it may be noticed that this is introduced by the Ty2 sources mostly, normal Ty1s and NLS1s follow a narrower trend, with a linear correlation index of 0.97. The number of objects with available hard X-emission is smaller, hence the reduced number of points in the figure as compared with those in Fig. 12 or 13. The same behavior is revealed when comparing with the [S viii] luminosity - not shown. The positive trends found reinforce the scenario of photoionization by the central source as the main mechanism for the formation of the coronal lines. The diagnosis fails however for Ty2 sources because of their heavy absorption, even in the hard x-rays some are Compton thick, e.g NGC 1068, Circinus so that their measured X-ray luminosity is not accounting for the true intrinsic value.
The results above firmly support a relationship between soft and hard X-rays and NIR coronal lines, explored for the first time in the literature here. They agree with previous findings obtained in other wavelength intervals (optical and mid-IR) claiming a correlation between the luminosity of the CLs and the X-ray emissions (soft and hard) (Porquet et al., 1999; Prieto, Pérez García & Rodríguez Espinosa, 2002; Gelbord et al., 2009). We should keep in mind that the X-ray and NIR observations are not contemporaneous but that should not affect the outcome. This is because, on average, the largest uncertainty comes from the model dependence inherent in converting X-ray count rates to fluxes rather than to variability itself Gelbord et al. (2009).
On the other hand, to be an X-ray AGN emitter is not condition to be also a CL emitter. Indeed, all the sources in the sample are X-ray emitters. As discussed in Sect. 3, insufficient spatial resolution, specially for the more distant sources, hampers the detection of CLs. However, that is not always the reason. A clear counter example is NGC 1097, one of the nearest AGN in the sample, with L(0.1- 2 keV) = 5.0 x 1040 erg s-1 (Terashima et al., 2002) and no CLs so far detected (Table 2), even at distances from the centre of 10 pc (Muller-Sanchéz et al. 2010, submitted). There are also AGNs with a truncated CL spectrum at lines with IP above certain energy. Examples include NGC 3227, with barely detected CLs with IP 166 eV in the optical and IR (Rodriguez-Ardila et al. 2006, this work, see sect.3); Mrk 3, with no CLs with IP 100 eV within 10 pc from the centre (Mazzalay, Rodríguez-Ardila & Komossa, 2010). Some possibilities for the CL absence may include a particular type of ionizing continuum, i.e., one that is intrinsically different from that of an standard AGN, or is modified by intervening material located in between the central source and the CL region. Such material could be the the warm absorber seen in some Seyfert galaxies (Nandra & Pounds, 1994; Reynolds, 1997), which could significantly modify the form of the input ionizing continuum. Porquet et al. (1999) proposed that this structure can also be a source of coronal lines.
Another possibility is that the ionised gas in Ty2 galaxies have different distributions in different sources (Sambruna et al., 2001a, b). This hypothesis was raised in the light of Chandra observations of Mrk 3 and Circinus. While in the former most of the line emission in X-rays is spread over several hundred parsecs, this is not the case in the latter, where the ionized gas is highly concentrated, with most of the flux originating within the central 15 pc.
5 Summary
The first study aimed at studying the physical properties of near-IR CLs spanning the energy range 130 450 eV are derived for the first time on a sizable sample of AGNs (54 sources). The main results are as follows.
CLs in the 0.82.4 m interval with IP 127 eV are detected in 2/3 (36 AGNs) of the galaxy sample. CLs are formed very close to the central source. Due to lost of line contrast in an increasing continuum level, their detection depends largely on source distance. However, we confirm the existence of nearby objects, e.g. NGC 1097, NGC 5963, where the absence of CLs is genuine. These objects must have a suppressed ionising continuum lacking photons with energies 100 eV.
Among the CLs and species studied in this work, from S, Si, Fe, Ca and Al, those coming from the the most abundant elements are the most frequent, namely Si and S. And among these, those from the lowest IP, i.e [Si vi] 1.963m (IP=166 eV) and [S viii] 0.991 mm (IP=280 eV) are the most common ones. On the basis of these two lines, Ty2 sources with CLs outnumber Ty1 by 17%. However, this discrepancy is attributed to differences in : Ty1 sources have significantly larger than Ty2 and the two lines fall in regions of poor atmospheric transmission when 0.035. Focusing on the highest ionization lines, which are believed to be formed at the innermost regions of the AGN, their presence in both types of AGNs in similar proportions (Fig. 8) implies that their spatial location has to be outside the inner face of the torus. Thus, orientation effects do not play a role in the detection of coronal lines.
The luminosity of the coronal emission is distributed in a narrow interval, covering 3 dex at most. Moreover, the luminosity distribution of the four most frequent coronal lines studied ([Si vi], [S viii], [Si x] and [S ix]) is strongly peaked, with the largest number of objects located between Log 39 and 40 erg s−1 cm−2. [Si vi] 1.963 m is the most luminous of the coronal lines analyzed, confirming previous studies that use it as an indicator of nuclear activity.
A strong prediction of photoionization models, assuming a simple relation between the cloud distance and its velocity, is a correlation between the line FWHM and the IP of the corresponding ion. We see a trend of increasing FWHM with IP but up to energies of about 300 eV (Table 4). Above this peak energy, the FWHM remains constant or decreases with IP. We ascribe this effect to a combination of increasing electron density towards the center and the spatial extension of the coronal gas. In a photoionized gas, the highest the IP the closer to the center a line is produced. Coronal lines with the highest IP have critical densities approaching 108 cm−3. If the density in the innermost region of the NLR is significantly higher than that, those lines will be severely affected by collisional de-excitation and their high-velocity component will get suppressed. Accordingly, only their lower velocity component, which might come from a further region from the center, would be seen. This would explain why the FWHM of [S viii] is the highest for most sources: it is the coronal line with the highest critical density. Its intensity is not affected by collisional de-excitation as the lines of higher IP likely are. This scenario sets a strict limit for the density in the boundary region between the narrow and the broad regions of 10 cm-3.
Further support to photoionization as the main mechanism to excite the CLs arises from the positive trends found between the X-ray luminosity soft and hard, the soft power-law photon index and the coronal line luminosity. In particular, objects with the softest X-ray spectrum tend to have strong CLs, this being expected considering that the CLs surveyed in this work require energies in the 0.1 - 0.5 keV interval. These trends hold when considering Ty1 sources only; they get weaker or vanish when including Ty2 sources. We believe this is because the X-ray emission measured in these cases is not representative of the intrinsic AGN power. Some of the Ty2 sources are, indeed, Compton thick so even their 2-10 Kev spectrum may just be reprocessed emission. Other sources, like circumnuclear star formation, line emission and bremstrahlung are dominating the emission even in the hard X-rays.
The presence of truncated CL spectra in some objects, i.e., lacking CLs above a certain IP, could be ascribed to a specific geometrical configuration, where the line of sight between the NLR gas and the soft X-ray continuum is blocked by material that absorbs photons above a certain energy (a warm absorber, for example). It may also be possible that centrally illuminated ionized gas in Seyfert galaxies can have very different distributions in different sources. Alternatively, these objects may have an special type of ionizing spectrum, lacking ionizing photons above a certain energy threshold. However, neither the corresponding X-ray spectral index nor the X-ray luminosity differentiate objects with and without CLs because they both share similar values in these two properties.
References
- Alexander, Young & Hough (1999) Alexander D. M., Young S., Hough J. H. 1999, MNRAS, 304, L1
- Appenzeller & Östreicher (1988) Appenzeller I., Östreicher R. 1988, AJ, 95, 45
- Bassani et al. (1999) Bassani L., Dadina M., Maiolino R., Salvati M., Risaliti G., Della Ceca R., Matt G., Zamorani G. 1999, ApJS, 121, 473
- Bianchi, Guainazzi & Chiaberge (2006) Bianchi, S., Guainazzi, M., Chiaberge, M. 2006, A&A, 448, 499
- Cappi et al. (2006) Cappi M. et al. 2006, A&A, 446, 459
- Cohen (1983) Cohen R. D. 1983, ApJ, 273, 489
- Cooke et al. (1976) Cooke B. A., Elvis M., Maccacaro, T., Ward M. F., Fosbury A. E., Penston M. V. 1976, MNRAS, 177, 121P
- Crenshaw et al. (1991) Crenshaw D. M., Peterson B. M., Korista K. T., Wagner R. M., Aufdenberg, J. P. 1991, AJ, 101, 1202
- De Robertis & Osterbrock (1986) De Robertis, M. M., Osterbrock, D. E. 1986. ApJ, 301, 727
- Erkens, Appenzeller & Wagner (1997) Erkens U., Appenzeller I., Wagner S. 1997, A&A, 323, 707
- Evans (1988) Evans I. N. 1988, ApJS, 67, 373
- Ferguson et al. (1997) Ferguson, J. W., Korista, K. T., Ferland, G. J. 1997, ApJS, 110, 287
- Ferland (1993) Ferland G. J. 1993, Department of Physics and Astronomy Internal Report, University of Kentucky
- Geballe et al. (2009) Geballe, T., Mason, R., Rodríguez-Ardila, A., Axon, D. 2010, ApJ, 701, 1710
- Gelbord et al. (2009) Gelbord, J. M., Mullaney, J. R., Ward, M. J. 2009, MNRAS, 397, 172
- Giannuzzo, Rieke & Rieke (1995) Giannuzzo E., Rieke G. H., Rieke M. J. 1995, ApJ, 446, L5
- Glikman, Helfand & White (2006) Glikman, E., Helfand, D. J., White, R. L. 2006, ApJ, 640, 579
- Grandi (1978) Grandi S. A. 1978, ApJ, 221, 501
- Guainazzi, Matt & Perola (2005) Guainazzi M., Matt G., Perola G. C. 2005, A&A, 444, 119
- Kaspi et al. (2005) Kaspi S., Maoz D., Netzer H., Peterson B., Vestergaard M., Jannuzi B. T. 2005, ApJ, 629, 61
- Knop et al. (1996) Knop R. A., Armus L., Larkin J. E., Matthews D. L., Shupe D. L., Soifer B. T. 1996, AJ, 112, 81
- Korista & Ferland (1989) Korista K. T., Ferland G. J. 1989, ApJ, 343, 678
- Leighly (1999) Leighly K. M. 1999, ApJS, 125, 317
- Levenson, Weaver & Heckman (2001) Levenson N. A., Weaver K. A., Heckman T. M. 2001, ApJ, 550, 230
- Lutz et al. (2002) Lutz D., Maiolino R., Moorwood A. F. M., Netzer H., Wagner S. J., Sturm E., Genzel R. 2002, A&A, 396, 439
- Maiolino et al. (1998) Maiolino R., Krabbe A., Thatte N., Genzel R. 1998, ApJ, 493, 650
- Marconi et al. (1996) Marconi A., van der Werf P. P., Moorwood A. F. M., Oliva E. 1996, A&A, 315, 335
- Mazzalay & Rodríguez-Ardila (2007) Mazzalay X., & Rodríguez-Ardila A. 2007, A&A, 463, 445
- Mazzalay, Rodríguez-Ardila & Komossa (2010) Mazzalay X., Rodríguez-Ardila A., Komossa, S. 2010, MNRAS, 405, 1315
- Moorwood et al. (1996) Moorwood A. F. M., Lutz D., Oliva E., Marconi A., Netzer H., Genzel R., Sturm E., de Graauw Th. 1996, A&A, 315, L109
- Müeller Sánchez et al. (2006) Müller-Sánchez F., Davies R. I., Eisenhauer F., Tacconi L. J., Genzel R., Sternberg A. 2006, A&A, 454, 481
- Müeller Sánchez et al. (2009) Müller-Sánchez, F., Davies, R. I., Genzel, R., Tacconi, L. J., Eisenhauer, F., Hicks, E. K. S., Friedrich, S., Sternberg, A. 2009, ApJ, 696, 448
- Müeller Sánchez et al. (2011) Müller-Sánchez, F., Prieto, A., Hicks, E. K. S., Vives-Arias, H., Davies, R. I., Malkan, M., Tacconi, L. J., Genzel, R. 2011, Accepted in ApJ, arXiv:1107.3140.
- Murayama & Taniguchi (1998) Murayama T., Taniguchi Y. 1998, ApJ, 497, L9
- Murayama, Taniguchi & Iwasawa (1998) Murayama T., Taniguchi Y., Iwasawa K. 1998, AJ, 115, 460
- Nagao, Taniguchi & Murayama (2000) Nagao T., Taniguchi Y., Murayama T. 2000, AJ, 119, 2605
- Nandra & Pounds (1994) Nandra, K., Pounds, K. A. 1994, MNRAS, 268, 405
- Neumayer et al. (2007) Neumayer, N., Cappellari, M., Reunanen, J., Rix, H.-W., van der Werf, P. P., de Zeeuw, P. T., Davies, R. I. 2007, ApJ, 671, 1329
- Nucita et al. (2010) Nucita, A. A., Guainazzi, M., Longinotti, A. L., et al. 2010, A&A, 515A, 47
- Oke & Sargent (1968) Oke J. B., Sargent W. L. 1968, ApJ, 151, 807
- Oliva et al. (1994) Oliva E., Salvati M., Moorwood A. F. M., Marconi A. 1994, A&A, 288, 457
- Oliva, Marconi & Moorwood (1999) Oliva E., Marconi A., Moorwood A. F. M. 1999, A&A, 342, 87
- Oliva et al. (2001) Oliva E. et al. 2001, A&A, 369, L5
- Osterbrock & Parker (1964) Osterbrock D. E., Parker R. A. 1964, ApJ, 141, 892
- Osterbrock (1969) Osterbrock D. E. 1969, Astrophys. Lett., 4, 57
- Osterbrock (1981) Osterbrock D. E. 1981, ApJ, 246, 696
- Osterbrock & Martel (1993) Osterbrock D. E., Martel A. 1993, ApJ, 414, 552
- Panessa et al. (2006) Panessa F., Bassani L., Cappi M., Dadina M., Barcons X., Carrera F. J., Ho L. C., Iwasawa K. 2006, A&A, 455, 173
- Pelat, Alloin & Fosbury (1981) Pelat D., Alloin D., Fosbury R. A. E. 1981, MNRAS, 195, 787
- Pelat, Alloin & Bica (1987) Pelat D., Alloin D., Bica E. 1987, A&A, 182, 9
- Penston et al. (1984) Penston M. V., Fosbury A. E., Boksenberg A., Ward M. J., Wilson A. S. 1984, MNRAS, 208, 347
- Pfefferkorn, Boller & Rafanelli (2001) Pfefferkorn F., Boller Th., Rafanelli P. 2001, A&A, 368, 797
- Pier & Voit (1995) Pier E. A., Voit G. M. 1995, ApJ, 450, 628
- Pogge & Owen (1993) Pogge R. W., Owen J. M. 1993, Ohio State Uni. Int. Rep., 93-01
- Porquet et al. (1999) Porquet D., Dumont A.M., Collin S., Mouchet M. 1999, A&A, 341, 58
- Prieto & Viegas (2000) Prieto M. A., Viegas S. M. 2000, ApJ, 532, 238
- Prieto, Pérez García & Rodríguez Espinosa (2002) Prieto M. A, Pérez García A. M., Rodríguez Espinosa J. M. 2002, MNRAS, 329, 309
- Prieto et al. (2004) Prieto M. A., Meisenheimer, K., Marco, O., et al. 2004, ApJ, 614, 135
- Prieto, Marco & Gallimore (2005) Prieto M. A, Marco O., Gallimore J. 2005, MNRAS, 364, L28
- Ramos-Almeida et al. (2006) Ramos-Almeida C., Pérez García A.M., Acosta-Pulido J.A., Rodríguez Espinosa J.M., Barrena R., Manchado A. 2006, ApJ, 645, 148
- Reunanen, Kotilainen & Prieto (2002) Reunanen J., Kotilainen J. K., Prieto M. A. 2002, MNRAS, 331, 154
- Reunanen, Kotilainen & Prieto (2003) Reunanen J., Kotilainen J. K., Prieto M. A. 2003, MNRAS, 343, 192
- Reynolds (1997) Reynolds, C. S. 1997, MNRAS, 286, 513
- Riffel, Rodríguez-Ardila & Pastoriza (2006) Riffel R., Rodríguez-Ardila A., Pastoriza M. G. 2006, A&A, 457, 61
- Riffel et al. (2009) Riffel, R., Pastoriza, M. G., Rodríguez-Ardila, A., Bonatto, C. 2009, MNRAS, 400, 273
- Rodríguez-Ardila et al. (2002) Rodríguez-Ardila A., Viegas S. M., Pastoriza M., Prato L. 2002, ApJ, 579, 214
- Rodríguez-Ardila, Contini & Viegas (2005) Rodríguez-Ardila A., Contini M., Viegas S. M. 2005, MNRAS, 357, 220
- Rodríguez-Ardila et al. (2006) Rodríguez-Ardila A., Prieto M. A., Viegas S. M., Gruenwald R. 2006, ApJ, 653, 1098
- Rose et al. (2011) Rose, M., Tadhunter, C. N., Holt, J., Ramos Almeida, C., Littlefair, S. P. 2011, MNRAS, 414, 3360
- Rush et al. (1996) Rush B., Malkan M. A., Fink H. H., Voges W. 1996, ApJ, 471, 190
- Sambruna et al. (2001a) Sambruna, R. M., Brandt, W. N., Chartas, G., Netzer, H., Kaspi, S., et al. 2001, ApJ, 546, L9
- Sambruna et al. (2001b) Sambruna, R. M., Netzer, H., Kaspi, S., Brandt, W. N., Chartas, G., et al. 2001, ApJ, 546, L13
- Shields & Oke (1975) Shields G. A., Oke J. B. 1975, ApJ, 1975
- Shinozaki et al. (2006) Shinozaki K., Miyaji T., Ishisaki Y., Ueda Y., Ogasaka Y. 2006, AJ, 131, 2843
- Schlesinger et al. (2009) Schlesinger, K., Pogge, R. W., Martini, P., Shields, J. C., Fields, D. 2009, ApJ, 699, 857
- Shuder (1980) Shuder J. M. 1980, ApJ, 240, 32
- Shuder & Osterbrock (1981) Shuder J. M., Osterbrock D. E. 1981, ApJ, 250, 55
- Storchi-Bergmann et al. (1999) Storchi-Bergmann T., Winge C., Ward M. J., Wilson A. S. 1999, MNRAS, 304, 35
- Terashima et al. (2002) Terashima, Yuichi; Iyomoto, Naoko; Ho, Luis C.; Ptak, Andrew F.
- Thompson (1995) Thompson R. I. 1995, ApJ, 445, 700
- Thompson (1996) Thompson R. I. 1996, ApJ, 459, L61
- Viegas-Aldrovandi & Contini (1989) Viegas-Aldrovandi S. M., Contini M. 1989, A&A, 215, 253
- Walter & Fink (1993) Walter R., Fink H. H. 1993, A&A, 274, 105
- Ward & Morris (1984) Ward M., Morris S. 1984, MNRAS, 207, 867
- Wilson (1979) Wilson A. S. 1979, Proc. R. Soc. Lond., A366, 461
- Whittle et al. (2005) Whittle, M., Rosario, D. J., Silverman, J. D., Nelson, C. H., Wilson, A. S. 2005, AJ, 129, 104


.
Galaxy
Type
/pc
CL
Mrk 334
Sy1
0.021940
460
N
Mrk 335*
NLS1
0.025785
500
Y
NGC 262
Sy2
0.015034
290
Y
Ton S180*
NLS1
0.061980
1200
N
Mrk 993
Sy2
0.015537
300
Y
NGC 591
Sy2
0.015167
290
Y
Mrk 573
Sy2
0.017179
330
Y
NGC 863*
Sy1
0.026385
550
Y
Mrk 1044*
NLS1
0.016451
320
N
NGC 1068*
Sy2
0.003793
75
Y
NGC 1097
Sy1
0.004240
90
N
NGC 1144
Sy2
0.028847
560
N
Mrk 1066
Sy2
0.012025
230
Y
NGC 1275
Sy2
0.017559
340
N
MCG-05-13-017
Sy1
0.012445
260
Y
NGC 2110
Sy2
0.007789
150
N
ESO 428-G014
Sy2
0.005664
110
Y
Mrk 78*
Sy2
0.037150
720
Y
Mrk 1210
Sy2
0.013496
260
Y
Mrk 124
NLS1
0.056300
1090
Y
Mrk 1239
NLS1
0.019927
380
Y
NGC 3227
Sy1
0.003859
80
Y
PG 1126-041
NLS1
0.060000
1160
Y
H1143-182
Sy1
0.032949
680
Y
NGC 4051
NLS1
0.002336
45
Y
NGC 4151
Sy1
0.003319
70
Y
Mrk 766
NLS1
0.012929
250
Y
NGC 4748
NLS1
0.014630
280
Y
Ton 0156
QSO
0.549000
11400
N
Mrk 279
NLS1
0.030451
590
Y
Circinus*
Sy2
0.001448
30
Y
NGC 5548
Sy1
0.017175
360
Y
PG 1415+451
Sy1
0.113587
2350
N
Mrk 684
Sy1
0.046079
950
N
Mrk 478
NLS1
0.079055
1530
N
NGC 5728
Sy2
0.009353
180
Y
PG 1448+273
NLS1
0.065000
1250
Y
PG 1519+226
NLS1
0.013700
2650
N
NGC 5929
Sy2
0.008312
160
N
NGC 5953
Sy2
0.006555
130
N
Mrk 291
NLS1
0.035198
680
N
Mrk 493
NLS1
0.031328
610
N
PG 1612+261
Sy1
0.130916
2700
Y
3C 351
QSO
0.371940
7700
N
Mrk 504
NLS1
0.035888
700
Y
Arp 102B
Sy1
0.024167
500
N
1H 1934-063A
NLS1
0.010254
200
Y
Mrk 509
Sy1
0.034397
710
Y
Mrk 896
NLS1
0.026424
510
Y
1H 2107-097
Sy1
0.026525
550
Y
Ark 564
NLS1
0.024684
480
Y
NGC 7469
Sy1
0.016317
340
Y
NGC 7674
Sy2
0.028924
560
Y
NGC 7682
Sy2
0.017140
330
Y
**footnotetext: Data taken from the literature.
aafootnotetext: No coronal lines were detected in the 0.82.4 m
region but other authors have reported coronal lines in other
spectral regions. See Sect 2 for further details.
| Pa | Br | [Ca VIII] | [Si VI] | [S VIII] | [Al IX] | [S IX] | [Fe XIII] | [Si X] | [S XI] | |
|---|---|---|---|---|---|---|---|---|---|---|
| Galaxy | 1.8750 m | 2.1654 m | 2.3213 m | 1.9630 m | 0.9913 m | 2.0450 m | 1.2520 m | 1.0747 m | 1.4301 m | 1.9196 m |
| Mrk 334 | *** | |||||||||
| Mrk 335 | … | |||||||||
| NGC 262 | ||||||||||
| Ton S180 | … | * | ||||||||
| Mrk 993 | ** | *** | ||||||||
| NGC 591 | *** | |||||||||
| Mrk 573 | ||||||||||
| NGC 863 | … | |||||||||
| Mrk 1044 | … | ** | ||||||||
| NGC 1068 | 450 | … | ||||||||
| NGC 1097 | ** | *** | ** | |||||||
| NGC 1144 | *** | |||||||||
| Mrk 1066 | *** | |||||||||
| NGC 1275 | ||||||||||
| MCG-05-13-017 | ** | *** | ||||||||
| NGC 2110 | ||||||||||
| ESO 428-G014 | *** | |||||||||
| Mrk 78 | ||||||||||
| Mrk 1210 | ||||||||||
| Mrk 124 | * | |||||||||
| Mrk 1239 | ||||||||||
| NGC 3227 | ||||||||||
| PG 1126-041 | * | |||||||||
| H1143-182 | ||||||||||
| NGC 4051 | ||||||||||
| NGC 4151 | ||||||||||
| Mrk 766 | ||||||||||
| NGC 4748 | ||||||||||
| Ton 0156 | * | * | * | * | * | |||||
| Mrk 279 | ** | |||||||||
| Circinus | 48 | 51.5 | 11 | 10.8 | 20 | |||||
| NGC 5548 | ** | |||||||||
| PG 1415+561 | * | ** | ||||||||
| Mrk 684 | * | |||||||||
| Mrk 478 | * | |||||||||
| NGC 5728 | ||||||||||
| PG 1448+273 | * | |||||||||
| PG 1519+226 | * | * | ||||||||
| NGC 5929 | ** | |||||||||
| NGC 5953 | *** | |||||||||
| Mrk 291 | *** | |||||||||
| Mrk 493 | ||||||||||
| PG 1612+261 | * | * | ||||||||
| 3C 351 | * | * | * | * | ** | * | * | |||
| Mrk 504 | ||||||||||
| Arp 102B | ||||||||||
| 1H 1934-063A | ||||||||||
| Mrk 509 | ** | |||||||||
| Mrk 896 | ||||||||||
| 1H 2107-097 | ||||||||||
| Ark 564 | ||||||||||
| NGC 7469 | ||||||||||
| NGC 7674 | ||||||||||
| NGC 7682 |
References. — Rodríguez-Ardila et al. (2002), Marconi et al. (1996), Rodríguez-Ardila et al. (2006), Oliva et al. (2001), Thompson (1996), Ramos-Almeida et al. (2006), Mazzalay & Rodríguez-Ardila (2007), Rodríguez-Ardila, Contini & Viegas (2005), Müeller Sánchez et al. (2006), Oliva et al. (1994), Reunanen, Kotilainen & Prieto (2003), Maiolino et al. (1998)
| Line | , IP | Line | , IP | ||||
|---|---|---|---|---|---|---|---|
| (m) | (eV) | (cm-3) | (m) | (eV) | (cm-3) | ||
| [S iii] | 0.9530 | 23.3 | 5.8 | [Si x] | 1.4301 | 351.1 | 8.8 |
| [S viii] | 0.9913 | 280.9 | 10.6 | [S xi] | 1.9196 | 447.1 | 8.5 |
| [Fe xiii] | 1.0747 | 330.8 | 8.8 | [Si vi] | 1.9630 | 166.8 | 8.8 |
| [S ix] | 1.2520 | 328.2 | 9.4 | [Al ix] | 2.0450 | 284.6 | 8.3 |
| [Fe ii] | 1.2570 | 7.9 | 5.0 | [Ca viii] | 2.3213 | 127.7 | 7.9 |
| [Fe II] | [S III] | [Ca VIII] | [Si VI] | [S VIII] | [Al IX] | [S IX] | [Fe XIII] | [Si X] | [S XI] | T | |
|---|---|---|---|---|---|---|---|---|---|---|---|
| Galaxy | 1.257 m | 0.953 m | 2.3213 m | 1.9630 m | 0.9913 m | 2.0450 m | 1.2520 m | 1.0747 m | 1.4301 m | 1.9196 m | |
| Mrk 335 | 570 | 830 | 1050 | † | 1400 | 1150 | P | ||||
| NGC 262 | L | ||||||||||
| Mrk 993 | |||||||||||
| NGC 591 | N | ||||||||||
| Mrk 573 | |||||||||||
| NGC 863 | 350 | 420 | 350 | 600 | 350 | † | P | ||||
| NGC 1068 | 1070 | 1060 | 950 | 1300 | N | ||||||
| Mrk 1066 | L | ||||||||||
| MCG-05-13-017 | N | ||||||||||
| ESO 428-G014 | † | N | |||||||||
| Mrk 78 | |||||||||||
| Mrk 1210 | N | ||||||||||
| Mrk 124 | |||||||||||
| Mrk 1239 | P | ||||||||||
| NGC 3227 | † | L | |||||||||
| PG 1126-041 | †† | I | |||||||||
| H1143-182 | N | ||||||||||
| NGC 4051 | ††† | P | |||||||||
| NGC 4151 | N | ||||||||||
| Mrk 766 | P | ||||||||||
| NGC 4748 | I | ||||||||||
| Mrk 279 | |||||||||||
| Circinus | 143 | 150-540 | 175-300 | 200-300 | 97 | P | |||||
| NGC 5548 | N | ||||||||||
| NGC 5728 | I | ||||||||||
| PG 1448+273 | †† | ||||||||||
| PG 1612+261 | ††† | †† | |||||||||
| Mrk 504 | |||||||||||
| 1H 1934-063A | 550 | 420 | 350 | 650 | 400 | 1600 | 1100 | P | |||
| Mrk 509 | 500 | ||||||||||
| Mrk 896 | |||||||||||
| 1H 2107-097 | |||||||||||
| Ark 564 | 350 | 440 | 350 | 530 | 890 | 480 | 920 | 590 | P | ||
| NGC 7469 | ††† | P | |||||||||
| NGC 7674 | N | ||||||||||
| NGC 7682 | L |