The intriguing H i gas in NGC 5253:
an infall of a diffuse, low-metallicity H i cloud?††thanks:
The observations were obtained with the Australia Telescope which is
funded by the Commonwealth of Australia for operations as a National
Facility managed by CSIRO.
Abstract
We present new, deep H i line and 20-cm radio continuum data of the very puzzling blue compact dwarf galaxy NGC 5253, obtained with the Australia Telescope Compact Array as part of the ‘Local Volume H i Survey’ (LVHIS). Our low-resolution H i maps show, for the first time, the disturbed H i morphology that NGC 5253 possesses, including tails, plumes and detached H i clouds. The high-resolution map reveals an H i plume at the SE and an H i structure at the NW that surrounds an H shell. This latter structure is related to an expanding bubble in the ISM, but it will almost certainly not originate a galactic wind. We confirm that the kinematics of the neutral gas in NGC 5253 are highly perturbed and do not follow a rotation pattern. We discuss the outflow and infall scenarios to explain such disturbed kinematics, analyze the environment in which NGC 5253 resides, and compare it properties with those observed in similar star-forming dwarf galaxies. The radio-continuum emission of NGC 5253 is resolved and associated with the intense star-forming region located at the center of the galaxy. We complete the analysis using multiwavelength data extracted from the literature, which includes X-ray, GALEX far-ultraviolet, optical - and -band and H, near-infrared -band, and far-infrared data. We estimate the star-formation rate using this multiwavelength approach, and compare the results with other galaxy properties. NGC 5253 does not satisfy the Schmidt-Kennicutt law of star-formation, has a very low H i mass-to-light ratio when comparing with its stellar mass, and seems to be slightly metal-deficient in comparison with starbursts of similar baryonic mass. Taking into account all available multiwavelength data, we conclude that NGC 5253 is probably experiencing the infall of a diffuse, low-metallicity H i cloud along the minor axis of the galaxy, which is comprising the ISM and triggering the powerful starburst. The tidally disturbed material observed at the east and north of the galaxy is a consequence of this interaction, which probably started more than 100 Myr ago. The origin of this H i cloud may be related with a strong interaction between NGC 5253 and the late-type spiral galaxy M 83 in the past.
keywords:
galaxies: starbursts, kinematics and dynamics, interactions, ISM, dwarf, abundances, individual: NGC 5253, IC 4316, ESO 444-G018, NGC 5264.1 Introduction
Multiwavelength analyses of local dwarf galaxies give the opportunity to study the impact of the star-formation activity on both the interstellar medium (ISM) and the surrounding intergalactic medium (IGM), the dynamics of galaxy evolution at both high and low spatial scales, and explore the triggering mechanisms of low-mass starbursting systems. In particular, nearby dwarf starbursts are excellent laboratories to investigate the properties of the star-forming regions, the behavior and fate of the neutral, ionized and hot gas, and their effects on the stellar component of the galaxy, giving fundamental parameters to constrain models of the chemical and dynamical evolution of galaxies.
An intriguing local starburst galaxy is the blue compact dwarf galaxy (BCDG) NGC 5253 in the Centaurus A group (Karachentsev et al., 2007). The larger nearby galaxy to NGC 5253 is the late-type spiral M 83, which is at a distance of 4.6 Mpc and lies at an angular distance of 54’ from NGC 5253. NGC 5253 is an ideal target for multiwavelength analyses of starburst galaxies, and a large amount of information is available at all frequencies. The outer optical isophotes of NGC 5253 resemble a dwarf elliptical galaxy, but H images (Martin, 1998; Calzetti et al., 2004; Meurer et al., 2006) soon revealed its starbursting nature, as it shows a large amount of ionized gas. This includes a filamentary structure that is extending perpendicular to its optical major axis and reaches beyond the stellar distribution. The star-formation activity is very intense in this galaxy. Indeed, NGC 5253 is considered as one of the youngest starbursts of the Universe (e.g., van den Bergh, 1980; Moorwood & Glass, 1982; Rieke, Lebofsky & Walker, 1988; Caldwell & Phillips, 1989) and even a large population of massive, young Wolf-Rayet (WR) stars has been reported in this galaxy (Campbell, Terlevich, & Melnick, 1986; Schaerer et al., 1997; Kobulnicky et al., 1997; López-Sánchez et al., 2007; López-Sánchez & Esteban, 2010a, b; Monreal-Ibero et al., 2010). The winds of the WR stars seem to be polluting some internal areas of the galaxy center, as a localized nitrogen enrichment (Walsh & Roy, 1989; Kobulnicky et al., 1997; López-Sánchez et al., 2007; López-Sánchez & Esteban, 2010a, b; Monreal-Ibero et al., 2010) and a possible slight helium enrichment (Campbell et al., 1986; López-Sánchez et al., 2007) have been reported. The highest oxygen abundance of the ionized gas found in NGC 5253 is 12+log(O/H)=8.30 (López-Sánchez et al., 2007), that corresponds to 40% solar assuming 12+log(O/H)⊙=8.66 (Asplund, Grevesse & Sauval, 2005). The very center of the galaxy hosts an extremely luminous, compact, obscured (Alonso-Herrero et al., 2004) site of star-formation, including some star clusters with ages younger than 10 Myr and masses between 105 and 106 M⊙ (e.g., Gonzalez-Riestra, Rego & Zamorano, 1987; Calzetti et al., 1997; Vanzi & Sauvage, 2004; Harris et al., 2004; Martín-Hernández, Schaerer, & Sauvage, 2005; Cresci, Vanzi & Sauvage, 2005). Extended diffuse X-ray emission (Strickland & Stevens, 1999; Summers et al., 2004) associated with the filamentary H structure are explained as superbubbles around the massive star-forming regions, and have been created by the combined action of supernova explosions and stellar winds. However, the radio spectral energy distribution of NGC 5253 is almost entirely dominated by thermal emission (Beck et al., 1996; Turner, Ho & Beck, 1998), that implies the extreme youth of the starburst.
| Name | NGC 5253 | IC 4316 | ESO 444–G084 | NGC 5264 | Ref. |
| HIPASS | J1339–31A | J1340–28 | J1337–28 | J1341–29 | |
| center position | (1) (2) (3) (4) | ||||
| (J2000) | –31° 38′ 24″ | –28° 53′ 32″ | –28° 02′ 42″ | –29° 54′ 47″ | |
| 31486, 3011 | 31566, 3077 | 31512, 3374 | 31572, 3171 | (1) (2) (3) (4) | |
| [ km s-1] | (5) (6) (6) (7) | ||||
| type | Im pec, H ii, Sbrst | IBm? pec | Im | IB(s)m | (6) (6) (6) (6) |
| distance [ Mpc ]a | 4.0 | 4.41 | 4.60 | 4.50 | (8) (9) (9) (9) |
| 1″[ pc] | 19.4 | 21.4 | 22.3 | 21.8 | |
| optical diameter | (6) (7) (6) (7) | ||||
| ” [kpc2] | |||||
| AB [mag] b | 0.242, 0.70 | 0.237 | 0.295 | 0.223 | (10,11) (10) (10) (10) |
| [mag] | (11) (6) (7) (7) | ||||
| [mag] | 8.480.02 | … | (11) (TW) (…) (4) | ||
| … | (11) (TW) (…) (TW) | ||||
| [mag] | (12) (TW) (TW) (TW) | ||||
| [108 L⊙]c | (12) (TW) (TW) (TW) | ||||
| [108 M⊙]d | 11.40.5 | 0.12e | (12) (TW) (TW) (TW) | ||
| 12+log(O/H) | 8.18 (A), 8.28 (C) | 8.160.20 | 7.370.20 | 8.500.20 | (5) (13) (14,TW) (14,TW) |
Despite all observational effort, the behavior of the neutral gas within NGC 5253 is far from clear. The first interferometric VLA observations (Kobulnicky & Skillman, 1995), which only showed the H i map around the galaxy center, revealed that the neutral gas either rotates about the minor axis of the galaxy or flows radially along the minor axis. NGC 5253 was observed with the radio-interferometer Australia Telescope Compact Array (ATCA) as part of the Local Volume HI Survey (LVHIS)111http://www.atnf.csiro.au/research/LVHIS project (Koribalski, 2008; Koribalski et al., 2011). The preliminary LVHIS results (López-Sánchez et al., 2008) showed that the neutral gas is more extended than the optical size of the galaxy, revealing a peculiar morphology in its northern areas. These data also confirmed the intriguing kinematics of the H i emission. Later, Kobulnicky & Skillman (2008) (hereafter, KS08) analyzed high-resolution VLA data of the center of NGC 5253 and found a redshifted H i plume extending to the SE along the minor axis and containing 20–30% of the neutral gas. These authors speculated that this feature is either a dynamically distinct tidal remnant or an inflow on the far side of the galaxy. They also reported a starburst-blown bubble stalled by interaction with a massive neutral envelope at the NW of the galaxy. However, their data did not allow the analysis of the diffuse neutral gas in which NGC 5253 is embedded, and which provides the key clues to understand all the peculiarities observed in this strong starbursting dwarf galaxy.
Here we present full synthesis ATCA H i line data of the BCDG NGC 5253 to analyze its neutral gas distribution in both large and short scales. We also perform a comprehensive analysis of this peculiar system combining all available multiwavelength data. In addition, we use the ATCA H i data of the nearby dwarf galaxies ESO 444-G084, IC 4316 and NGC 5264 (Koribalski et al., 2011) to compare the properties of NGC 5253 with those found in nearby dwarf galaxies within the Centaurus A group. This analysis will give clues to constrain the nature of the starburst phenomenon in NGC 5253. Table 1 compiles the basic properties of these four galaxies.
The paper is organized as follows: in Section 2 we summarize the observations and data reduction; Section 3 presents the ATCA H i line results (neutral gas distribution and kinematics) of our analysis of NGC 5253 and the comparison of the global H i spectrum with the HIPASS data. Section 4 compiles the 20-cm radio continuum results. The discussion in Section 5 compares the H i morphology and kinematics (and other galaxy properties, as the star-formation rate, stellar mass, chemical abundances and mass-to-light ratios) of NGC 5253 with those found in similar starbursts reported in the literature and in the nearby dwarf galaxies, as well as analyzes the environment in which NGC 5253 resides. Section 6 contains our conclusions.
2 Observations and Data Reduction
H i line and 20-cm radio-continuum observations of the galaxies NGC 5253, ESO 444-G084, IC 4316 and NGC 5264 were obtained simultaneously with the Australia Telescope Compact Array (ATCA). This radio-interferometer consists of six 22-m antennae, hence giving 15 baselines in a single configuration. Our data were obtained between Jan 2005 and Jan 2009 using three or four different array configurations. For NGC 5253, we used the EW367, 750A, 1.5A and 6A array configurations (the observational details of the other galaxies can be found in Koribalski et al. 2011). Each galaxy was observed for a full synthesis (12 hours) in each array to ensure an excellent uv-coverage and sensitivity to detect structures on all scales. Whereas the short baselines recover the extended H i distribution, the larger baselines provide the details needed to compare with UV/optical/IR data (e.g., Koribalski & López-Sánchez, 2009). The data in the three most compact array configurations are part of the LVHIS project (Koribalski et al. 2011), while the data in the most extended ATCA configuration are provided by our multiwavelength analysis of a sample of nearby BCDGs (López-Sánchez et al., 2009a, b, 2011).
Two different frequency bands are always available at the ATCA. We used the first frequency band (IF1) to get the 21-cm line data of neutral hydrogen (which has a rest frequency of 1420.406 MHz) and the second frequency band (IF2) to get the 20-cm radio-continuum data. IF1 was centered on 1418 MHz with a bandwidth of 8 MHz, divided into 512 channels. This gives a channel width of 3.3 km s-1 and a velocity resolution of 4 km s-1. The ATCA primary beam is 336 at 1418 MHz. IF2 was centered on 1384 MHz (20-cm) with a bandwidth of 128 MHz divided into 32 channels.
Flux calibration was performed by observations of the primary ATCA calibrator, PKS 1934–638, which has a flux of 14.95 Jy at 1418 MHz. The phase calibration was achieved by periodic observations (every 30 minutes) of the bright calibration source PKS 1308–220, which has a flux of 5.04 Jy at 1418 MHz. Data reduction was carried out with the miriad (Multichannel Image Reconstruction, Image Analysis and Display) software package (Sault, Teuben & Wright, 1995) using standard procedures. After calibration, the IF1 data were split into a narrow band 20-cm radio continuum and an H i line data set using a first order fit to the line-free channels.
| Name | NGC 5253 | IC 4316 | ESO 444–G084 | NGC 5264 |
|---|---|---|---|---|
| HIPASS | J1339–31A | J1340–28 | J1337–28 | J1341–29 |
| ATCA properties | ||||
| H i diameter [] | ||||
| H i/opt. diameter ratio | ||||
| velocity range [ km s-1] | 334 – 480 | 550 – 610 | 530 – 640 | 440 – 510 |
| [ km s-1] | ||||
| [ km s-1] | ||||
| [ km s-1] | ||||
| H i flux density () [Jy km s-1] | ||||
| H i mass () [ M⊙] | ||||
| /[ M⊙/]a | ||||
| / [%]b | ||||
| Single-dish properties | ||||
| H i flux density () [Jy km s-1] | ||||
| H i mass () [ M⊙] | ||||
| /[ M⊙/ L⊙]a | ||||
| / [%]b | 19.2 | 135 | 1014 | 48 |
| [108 M⊙]c |
By combining data from several array configurations we achieve a very good uv-coverage and, hence, the Fourier transformation of the obtained visibilities allows us to make datacubes and images at a large range of angular resolutions. This is achieved by choosing different weightings for short, medium and long baselines, which in turn are sensitive to different structure scales. The weighting of the data does not only affect the resolution, but also the noise and sensitivity to diffuse emission. For our analysis, H i cubes were made using ‘natural’ (na) and ‘robust’ (r=0) weighting of the uv-data in the velocity range covered by the H i emission using steps of 4 km s-1. The longest baselines to the distant antenna six (CA06) were excluded when making the low-resolution (‘na’ weighting) and the intermediate-resolution cubes (r=0 weighting), but they were considered to get the high-resolution cube. Broad-band 20-cm radio continuum images were made using ‘robust’ (r=0) weighting of the IF2 uv-data and excluding the baselines to CA06. The moment maps (integrated intensity map, intensity-weighted mean velocity field, and the velocity dispersion) were created from the H i datacubes by first isolating the regions of significant emission in every channel and afterwards clipping everything below a threshold.
 |
 |
 |
 |
 |
 |
3 H i results
3.1 The H i distribution of NGC 5253
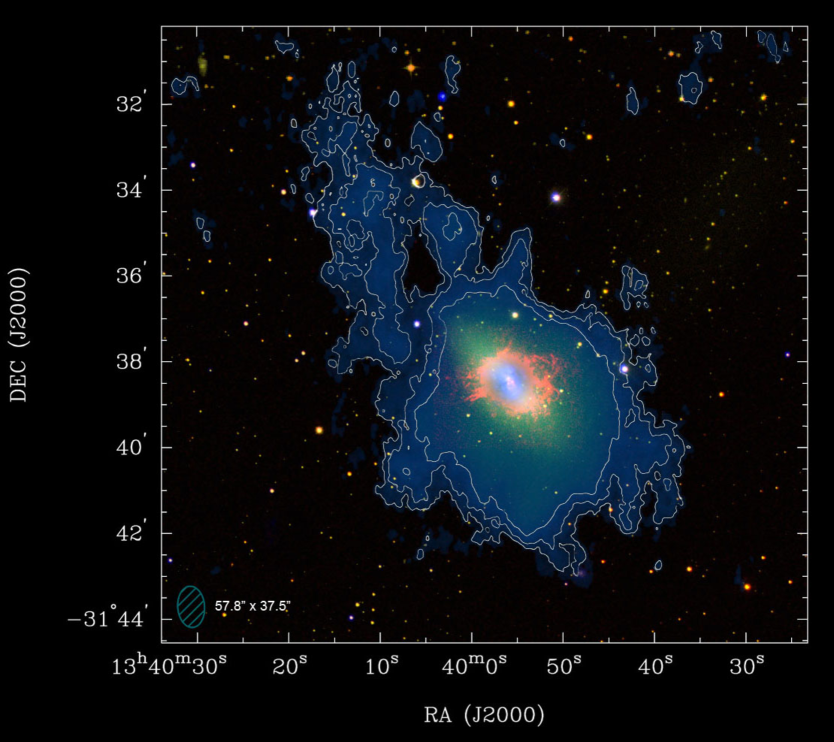
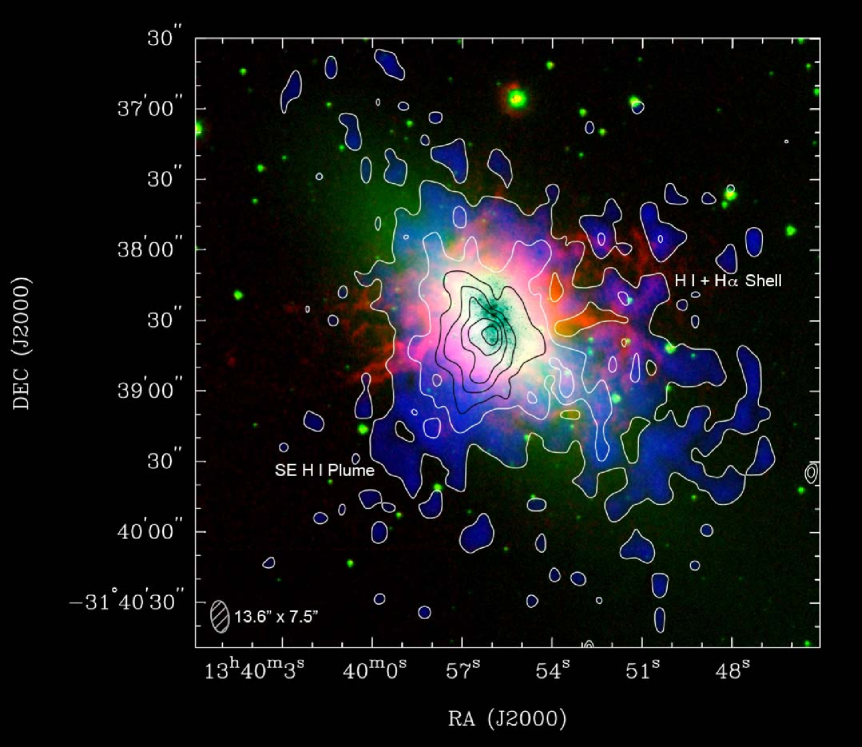
The distribution of atomic neutral gas within the BCDG NGC 5253 is shown in Fig. 1. This multiwavelength color image compares our new low-resolution H i map (in dark blue) with the ionized gas emission (red) and the stellar component (in green). As we see, our new H i map, which is deeper than the previous VLA maps obtained by Kobulnicky & Skillman (1995) and KS08, clearly shows the diffuse atomic gas emission in the external regions of NGC 5253. Indeed, our low-resolution H i map, which is tracing the large scale structures of the neutral gas component of the galaxy, clearly indicates that the atomic hydrogen gas is more extended than the optical size of the galaxy ( kpc kpc, that is times its optical size), showing a very peculiar morphology in its northern area. This region shows a kind of filamentary and disturbed H i morphology, which may suggest the existence of tidally disturbed material surrounding the galaxy. The southern region of NGC 5253 also shows a somewhat disturbed morphology, but in this case the H i gas is not as disrupted as it is seen at the northern regions.
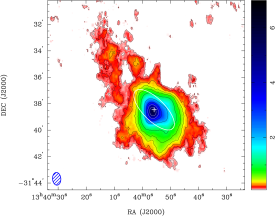
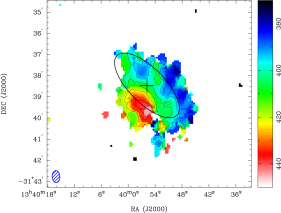
Figure 2 shows the low- and intermediate-resolution H i moment maps of NGC 5253. The H i distribution in these maps are shown up to 0.10 and 0.04 Jy beam-1 km s-1 ( over the noise level), which corresponds to an H i column density of and atoms cm-2 for the low- and intermediate-resolutions maps, respectively. The H i maximum coincides with the optical center of the galaxy, although the peak of the H i distribution seems to be displaced to the SE with respect to the optical component of the galaxy.
The H i emission in our low-resolution datacube covers a velocity range of 330 to 480 km s-1. Assuming that the distance to NGC 5253 is 4.0 Mpc (see Table 1) and an integrated flux density of Jy km s-1, we derive a total H i mass of M⊙. The integrated flux in the northern disturbed areas is 5% of the total flux of the galaxy, that corresponds to a mass of M⊙.
The intermediate-resolution map recovers 81% of the total flux we detect in our low-resolution map, which mainly corresponds to the emission from the main body of the galaxy. Indeed, the intermediate-resolution map does not show the diffuse emission at the northern areas, although some disturbed material at the southeast can still be observed. This region corresponds to the feature that KS08 designed as the ‘SE H i plume’. We note that this structure is more extended than that reported by these authors, as it extends from the center of the galaxy (the low-resolution map presented by KS08 only shows ). Hence, at this resolution the H i distribution in NGC 5253 does not follow its optical major axis but the neutral gas is rather distributed along the minor axis. Furthermore, this distribution is not symmetrical, as the SE region corresponds to the H i plume. Our intermediate-resolution H i maps also suggest that this feature is not just a plume but appears to be an open-shell structure. Most remarkable, the intermediate-resolution H i maps show a hole in the neutral gas emission just at the south of the galaxy and at the west of the ‘SE H i plume’. This H i hole does not correspond to any of the bubbles that are surrounded by the ionized gas.
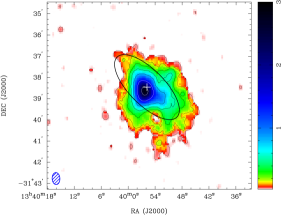
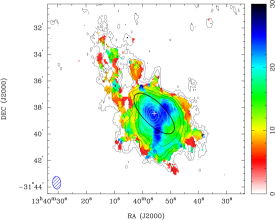
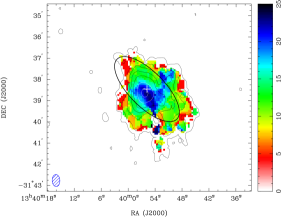
The high-resolution H i map of NGC 5253 is shown in Fig. 3, which displays the H i contours overlaid onto a multiwavelength color picture which combines the H image of the galaxy (red) obtained by Meurer et al. (2006), the -band and GALEX -band images (green) and our high-resolution H i map (blue). The synthesized beam of our high-resolution H i map is . The lowest contour level plotted in Fig. 3 corresponds to 0.032 Jy beam-1 km s-1 ( over the noise level), which corresponds to an H i column density of atoms cm-2 assuming that the gas fills the beam. Our high-resolution H i map traces the highest density H i gas (which corresponds to the small scale structures) and agrees quite well with the H i map presented by KS08. Indeed, both maps have quite similar resolution (their synthesized beam is ) and sensitivity (assuming that the gas fill the beam, the lowest H i contour of the high-resolution H i map shown by KS08 corresponds to an H i column density of atoms cm-2). Our map clearly recovers the three main H i features reported by these authors:
-
1.
the extensions following the optical major axis (in the direction NE–SW and that we clearly identify in the low- and intermediate-resolution maps),
-
2.
the ‘SE H i plume’ (that extends beyond the optical component of the galaxy, as it is seen in Fig. 3), and
-
3.
the open shells at the west and east.
In particular, Fig. 3 shows an excellent correspondence between an H shell located at the NE and the H i gas in this region. Indeed, the H i peak column densities coincide with the H peaks in this area. Furthermore, both the neutral and ionized gas have a hole in the center of this region, which also shows high values in its H i velocity dispersion (moment 2 maps in Fig. 2). We derive a neutral hydrogen mass of M⊙ in this H i shell, which matches the mass estimation given by KS08.
On the other hand, we do not see any correspondence between the neutral and the ionized gas in the H shell located at the east of the galaxy (see Fig. 3). The only appreciable H i feature in this zone is the ‘SE H i plume’, which lies just at the south of the H shell located at the east of the galaxy, but this H i plume does not embed any H emission.
We also note that Fig. 3 shows some residual H i emission following the major axis of the galaxy, specially toward the SW, that was not detected in the maps shown by KS08.
3.2 Integrated galaxy spectra and comparison with HIPASS
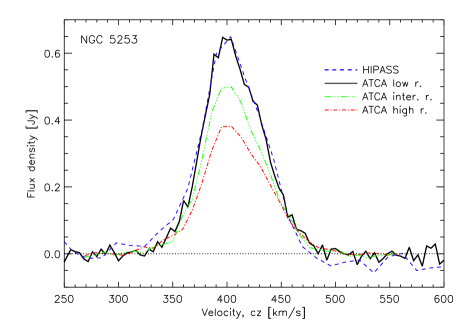
Interferometric data usually underestimate the total flux because of the missing short baselines, which filters out any extended diffuse H i emission. Hence, we compare the integrated spectrum obtained for each galaxy with the single-dish spectrum provided by the H i Parkes All-Sky Survey (HIPASS; Barnes et al., 2001; Koribalski et al., 2004). The HIPASS spectrum of each galaxy was extracted from the raw HIPASS datacubes assuming a point-source (their intrinsic size is smaller than the angular resolution of the gridded data) within a region of centered on the source, with each pixel weighted according to the expected beam response. Following the procedure described in Koribalski et al. (2004) and revisited by Kirby et al. (2011), we derived the basic spectral properties of the galaxies, which for NGC 5253, ESO 444-G084 and NGC 5264 are virtually identical to those compiled in the HIPASS Bright Galaxy Catalogue (Koribalski et al., 2004). Similar single-dish values for integrated H i properties of these three galaxies are provided by the HIDEEP Survey (Minchin et al., 2003).
Figure 4 shows a comparison between the global H i line spectrum as obtained from HIPASS (dashed blue line) and LVHIS (solid black line) for NGC 5253. The agreement is quite good, LVHIS data recover almost 96% of the single-dish H i-flux, suggesting that very little diffuse H i emission has been filtered out in our interferometric observations.
3.3 The H i kinematics of NGC 5253
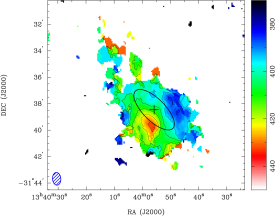
The central panels in Fig. 2 show the mean, masked low- and intermediate-resolution H i velocity field of the galaxy. As previously noticed by Kobulnicky & Skillman (1995), the most remarkable characteristic of these maps is that the neutral gas is not rotating about the optical minor axis of the galaxy (as it should be expected) but it seems to rotate about its optical major axis, as it happens in polar ring galaxies, or it just flows radially along the minor axis. Later, KS08 used high-resolution maps to discard the rotation scenario, emphasizing that their new data are more consistent with either an inflow or outflow of neutral gas along the minor axis from the south and east of the nucleus.
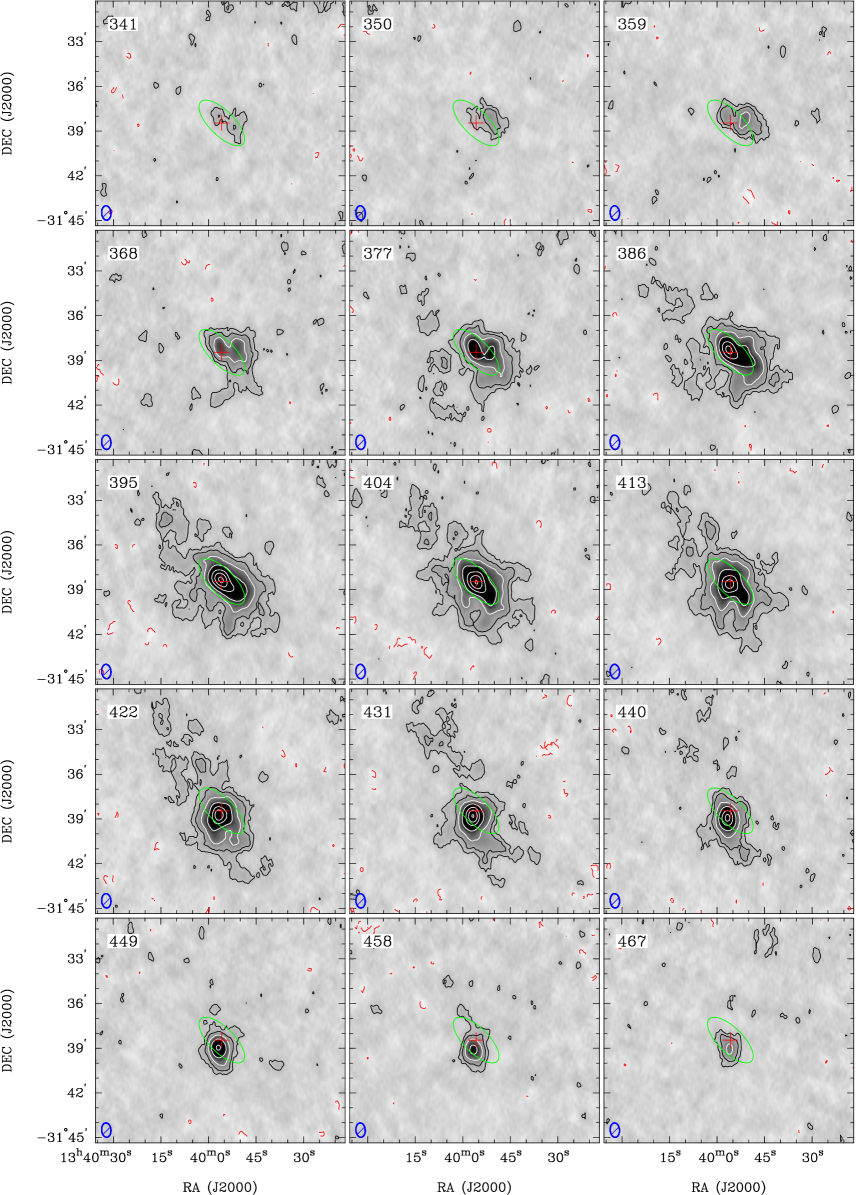
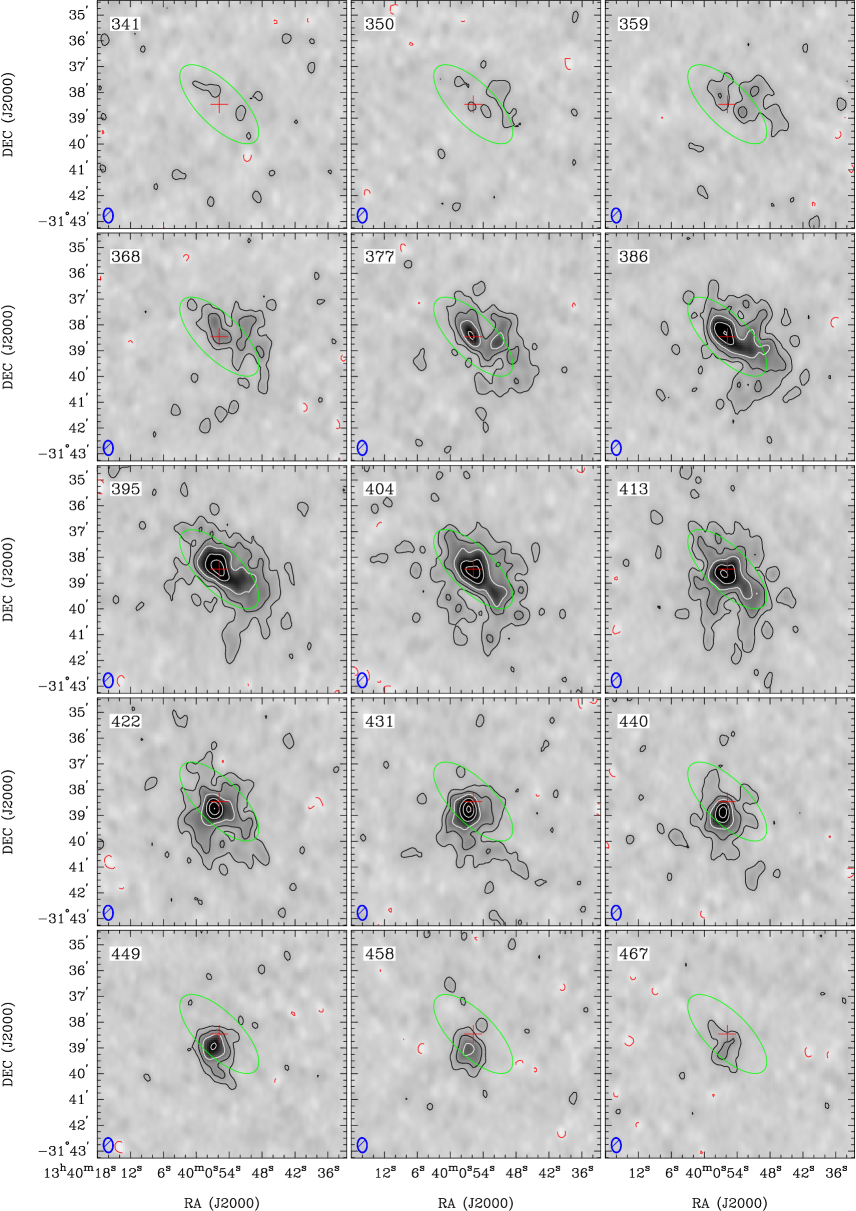
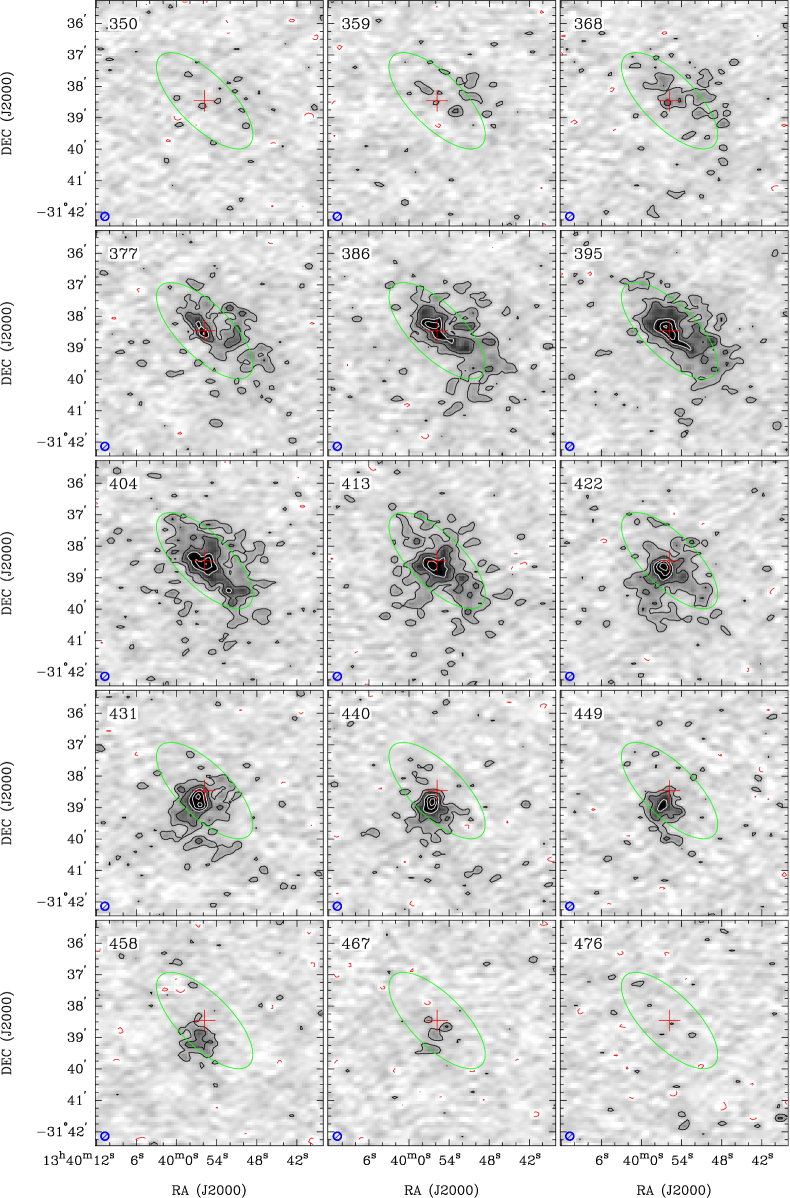
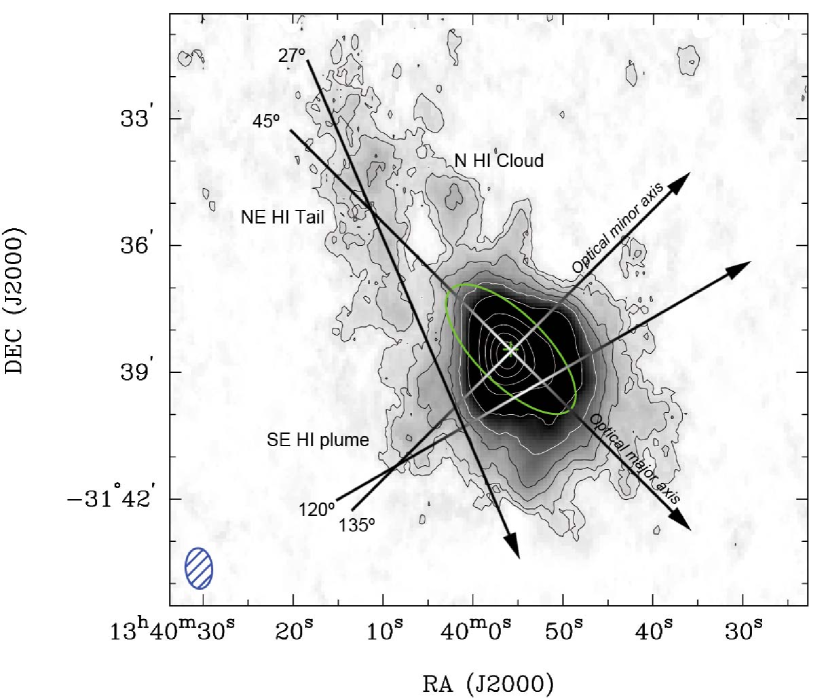
Here we will consider both scenarios to try to explain the intriguing and disturbed H i kinematics of NGC 5253. Figures 5, 6 and 7 show, respectively, the low-, intermediate-, and high-resolution H i channel maps of NGC 5253. As we see, the H i distribution is asymmetric and does not show any clear rotational pattern. To facilitate the analysis of the H i kinematics within this peculiar BCDG, we plot in Figs. 9 and 10 some position-velocity (pv) diagrams across our H i datacubes. The position angle (PA) and localization of these slits are shown in Fig. 8. The results found in our analysis are the following:
 |
 |
-
1.
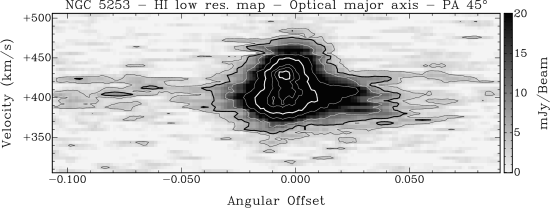
The pv diagram along the optical major axis of NGC 5253 (with a PA of 45∘) is plotted in the top panel of Fig. 9. The neutral gas seems to show a constant velocity along the slit, with a velocity almost coincident with the systemic velocity ( km s-1). However, the central regions show an elongation to higher velocities (470 km s-1). A not so obvious elongation to lower velocities ( km s-1) is also observed in the same region. Indeed, the channel maps almost always show H i emission in the center of the galaxy. However, the velocity minimum is located at arcmin from the position of the velocity maximum. This feature seems to be a reminiscent of a rotation pattern which follows the optical major axis of the galaxy. KS08 already suggested the presence of such feature in their high-resolution H i maps (see their figure 9), but our pv diagram (which shows H i emission along the optical major axis) shows more clearly this behavior. We also note that there are two maxima in the H i emission just in the very center of the galaxy, that may suggest the existence of two main entities, as we will discuss below.
-
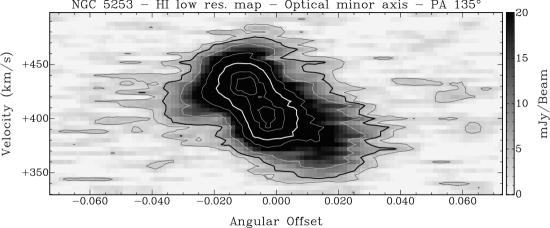
2.
The pv diagram along the optical minor axis of NGC 5253 (with a PA of 135∘, which is plotted in the bottom panel of Fig. 9) shows an evident velocity gradient of the neutral gas, from km s-1 at the east to km s-1 at the west. That is the main velocity field that we obtain in the first moment maps (see Fig. 2). We also detect two H i peaks in this pv diagram embedded in two structures that have different orientations. From the western peak towards the west, the velocity decrease continuously from km s-1 to km s-1. However, the eastern region (which corresponds to the ‘SE H i plume’) shows a decrease of the velocity from the eastern H i peak ( km s-1) to the east ( km s-1). The observed overall sinusoidal pattern, which is characteristic of interactions between two objects, is also found in the intermediate- and high-resolution datacubes.
-
3.
The intermediate-resolution H i channel maps of NGC 5253 show two open bubbles or shells at the NW (between 359 and 386 km s-1) and at the SE (between 404 and 422 km s-1). These features may correspond to outflows of material originated in the central starburst. We analyze individually these two features:
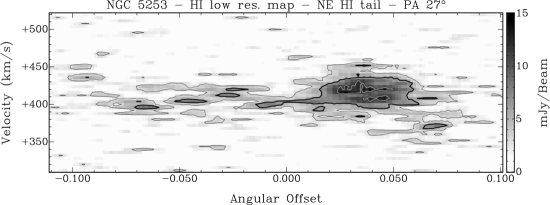
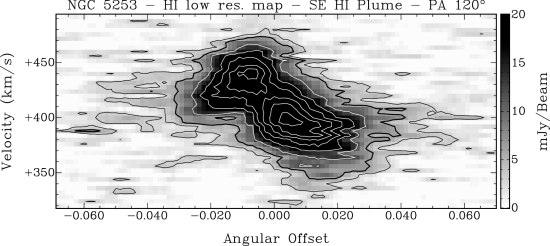
Figure 10: H i position-velocity diagrams of NGC 5253 using our low-resolution datacube. The slits cross along the disturbed material at the NE of the galaxy (top panel, with PA=27∘, northeast is left) and along the ‘SE H i plume’ (bottom panel, with PA=120∘, southeast is left). The units of the -axis are radians, 0.1 radians are 5.73∘ or 400 kpc at the distance of NGC 5253. The contour levels are: 3, 6, 12, 24, 31, 38, and 44 mJy beam-1. The slit positions are shown in Fig. 8. -
(a)
The NW shell corresponds to a bubble of neutral and ionized gas (‘H i+H Shell’ in Fig 3) originated in the densest regions of the ISM. Indeed, this structure, which has a size of kpc, is traced by fragmented H i gas in the 377–413 km s-1 channel maps of the high-resolution H i datacube (Fig. 7). The ‘NW H i+H Shell’ was already detected by KS08, who noticed that the H i velocity range (30–40 km s-1) is comparable to that found in the ionized gas. The non-detection of X-ray emission indicates that it has not been produced by the most recent star-formation event, but it was originated 40 Myr ago.
-
(b)
The ‘SE H i shell’ (between 404 and 422 km s-1 in Fig. 6) has lower H i column densities than those seen in the NW shell. The eastern areas actually correspond to the ‘SE H i plume’ reported by KS08 and has no counterpart to any H or X-ray emission. This shell has a very large size, kpc, i.e., it is twice as large as the ‘NW H i+H shell’, and as large as the optical minor axis of the galaxy. We do not consider that this structure has been originated by an outflow. A careful analysis of the previous (368–395 km s-1) and later (431–449 km s-1) channel maps indicate a continuous evolution of the H i gas from the NW to the SE (along the optical minor axis, the SE region corresponds to the ‘SE H i plume’) and from the NE to the SW (along the optical major axis), that may correspond to two different entities.
-
(a)
-
4.
The disturbed northern region observed in the low-resolution H i distribution map is composed by several small H i clouds, which have a relative large range of velocities (386 to 458 km s-1). We identify two main structures which do not show any stellar counterpart and are not related to any H emission, suggesting that both have a tidal origin:
-
(a)
The brightest of the H i clouds is located just at the north of the NE end of the stellar distribution of the galaxy. This ‘N H i cloud’ has a total H i mass of M⊙ and it is connected to the main body of the galaxy by diffuse neutral gas.
-
(b)
The elongated and narrow H i tail at the NE of the system consists of a chain of several H i clumps. Although they have a relatively constant velocity of around 400 km s-1, the clumps also show some variations in velocity following a kind of sinusoidal pattern with an amplitude of 20–30 km s-1 (see top panel of Fig. 10). The total H i mass in the ‘NE H i tail’ is M⊙. It is very interesting to note that there is a smooth transition in both position and velocity between the eastern tip of the SE H i plume (which has a velocity of 400 km s-1) and the ‘NE H i tail’ (which has a similar radial velocity in this area).
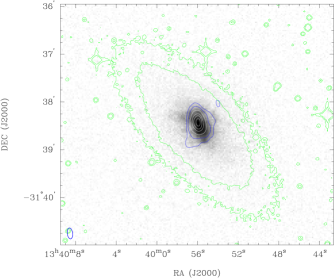
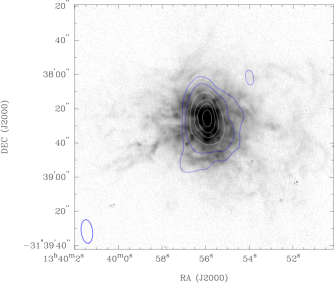
Figure 11: 20-cm radio-continuum contours of NGC 5253 overlapped onto a (left) GALEX -band image and (right) a H image (Meurer et al. 2006), both images on logarithmic scale. The contours are -0.9, 0.9, 1.8, 4, 9, 14 and 22 mJy beam-1. The left panel shows the contours of the -band image in green. The synthesized beam () is displayed at the bottom left corner in both panels. -
(a)
-
5.
Finally, some channel maps show long plumes of neutral gas extending from the H i maxima towards the external regions of the galaxy. Specially evident are the features seen in the 368–386 km s-1 and in the 431–440 km s-1 channel maps (the later structure corresponds to the ‘SE H i plume’), which are both spatially coincident at the southern regions of NGC 5253. Indeed, the pv diagram crossing this region (bottom panel of Fig. 10) clearly shows two independent H i peaks embedded in a sinusoidal pattern. The ‘SE H i plume’ increases velocity from the east ( km s-1) to the center of NGC 5253 ( km s-1), but then this tendency is broken, as the velocity of the SW region decreases from the center of the galaxy ( km s-1) to the external western areas ( km s-1). We notice that if we consider both structures as a single entity the global kinematical pattern is a decrease of the velocities from the east ( km s-1) to the west ( km s-1), that could be incorrectly attributed to rotation. As we discussed before, the ‘SE H i plume’ is not associated with any of the structures observed in the H images, and hence its outflow origin can be discarded (see also KS08). Therefore, the most plausible explanation of the sinusoidal pattern is that we are observing two different entities that are now in interaction. The 3D analysis of the low- and intermediate-resolution datacubes indicates a continuity between the features located at the NW regions (as the western H i peak in the 368 km s-1 channel map) with the ‘SE H i plume’ following the minor axis, which continues to the diffuse tidal material at the NE. This complete entity seems to be an independent system which is falling into NGC 5253. The main body of the galaxy would then correspond to the SW and NE areas, which are aligned with the optical major axis and still is rotating.
In summary, these new, deep H i data seem to indicate that the neutral gas found in the northern areas of the galaxy have a tidal origin. Hence, we propose that the very peculiar H i morphology and kinematics of NGC 5253 can be explained by an interaction scenario, in which the infall of an independent H i cloud along the minor axis of the galaxy is disturbing the existing neutral gas and triggering the powerful starburst. Both entities now seem to be in a process of merging, but the interaction probably started a long time ago, as we detect tidal gas at the northern regions of the galaxy and it seems that previous starbursts have occurred in the system. We also confirm the existence of a high-density H i bubble at the NW regions, which matches the H emission and seems to be a consequence of the combined actions of the winds of massive stars and supernova explosions. However, our H i data alone do not allow to definitively confirm the proposed infall scenario, as some features (the long disturbed neutral gas at the NE and the compressed HI edge at the SW) may have also been originated as the result of ram pressure stripping from moving through a dense IGM.
4 20-cm Radio-continuum emission
Figure 11 shows the contours of the 20-cm radio continuum emission map of NGC 5253 and its comparison with the GALEX -band and H images. The radio-continuum emission within this BCDG is clearly resolved and has an extension of . The 20-cm radio-continuum emission is located exactly at the center of the galaxy, at the position where the powerful starburst (and almost all the emission) is found, and shows an extension towards the SE. This faint feature may be related to an H arc that is located in this area. We also detect faint emission at the NW of the galaxy, which is detached from the main 20-cm emission of NGC 5253. This object, which has an 1.4 GHz flux of mJy, is located over some faint H emission in the external region of the galaxy. However, it is probably a background radio-source.
The total 20-cm radio continuum flux we derive from NGC 5253, mJy, is slightly lower than the value derived by Condon et al. (1996) in their 1.4 GHz VLA Atlas of bright IRAS galaxies, which was 83.8 mJy, although the synthesized beam size of their 20-cm radio-continuum map was larger (). Assuming that the galaxy lies at a distance of 4.0 Mpc and applying the expression given by Yun, Reddy & Condon (2001), we derive a 1.4 GHz luminosity of W Hz-1 for NGC 5253.
5 Discussion
| Name | NGC 5253 | IC 4316 | ESO 444–G084 | NGC 5264 |
| HIPASS | J1339–31A | J1340–28 | J1337–28 | J1341–29 |
| [ erg s-1 Å-1] | ||||
| [1038 erg s-1] | ||||
| [1022 W Hz-1] | … | … | ||
| [1041 erg s-1] | … | … | ||
| [1019 W Hz-1] | ||||
| (S07) | ||||
| (C07) | ||||
| … | … | |||
| … | … | |||
| Assumed | 0.20 | 0.0035 | 0.0070 | 0.0090 |
5.1 The global star-formation rate of NGC 5253 and nearby dwarf galaxies
The star formation rate of a galaxy can be estimated using different calibrations at many different wavelengths, from X-ray to radio. Here, we will consider the global SFR derived from (i) far-ultraviolet () images using the calibration provided by Salim et al. (2007), (ii) H images and the calibration given by Calzetti et al. (2007), (iii) far-infrared () data, in particular, the 60 m flux with the calibration provided by Condon (1992) and the total flux with the calibration given by Kennicutt (1998), and (iv) 20 cm radio-continuum data using the calibration provided by Condon, Cotton & Broderick (2002). A recent review of all these calibrations is provided by López-Sánchez (2010), who analyzed the of a sample of strong starbursting systems (including NGC 5253) using multiwavelength data. For comparison purposes, we also computed the derived for the other dwarf galaxies of the M 83 subgroup. Table 3 lists both the luminosities and the SFRs derived for these four galaxies using this multiwavelength analysis.
We note that the and H luminosities quoted in Table 3 have been corrected for extinction in all galaxies using the values indicated in Table 1 and following the prescriptions explained in López-Sánchez & Esteban (2008) and López-Sánchez (2010) for correcting the H and the fluxes, respectively. The total H fluxes of the galaxies NGC 5253, ESO 444-G084 and NGC 5264 have been extracted from Meurer et al. (2006). To estimate the total H flux in IC 4316, we added the H flux of the six star-forming regions spectroscopically observed by Lee, Zucker & Grebel (2007) within this galaxy. The value was corrected for reddening considering an average value for the coefficient these authors estimated for the star-forming regions, for which we derive mag. However, the total H flux computes in this way underestimates the total H flux of IC 4316 because the spectroscopic data compiled by Lee et al. (2007) do not cover all the ionized gas detected in the galaxy. Considering the aperture sizes and the H map provided by these authors (see their Fig. 2b) we estimate that the area recovered by the spectroscopic data is % of all the region showing H emission. The values compiled in Table 3 consider this correction and, therefore, are only tentative estimations to the real H values.
For NGC 5253, the H-based and the -based SFRs agree quite well. The -based s also are in agreement with those values, however, these SFR estimations have a larger uncertainty. Interestingly, the value also agrees with them. Note that H emission traces the most recent star-formation event ( Myr) but and radio-continuum emission trace the star-formation activity in the last 100 Myr. Hence, although the most recent star-formation event happened Myr ago (López-Sánchez et al., 2007) and the majority of the star clusters located in the center of the galaxy have ages younger than 10 Myr (Alonso-Herrero et al., 2004), the good agreement between all multiwavelength SFR indicators suggests that the elevated star formation activity has been present in NCG 5253 for several 100 Myr. This result agrees very well with the recent analysis presented by McQuinn et al. (2010a, b), who measured the duration of starbursts in twenty nearby, ongoing, and fossil starbursts in dwarf galaxies, including NGC 5253. This analysis, that was based on the recent star formation histories derived from resolved stellar population data obtained with the Hubble Space Telescope, revealed that the starburst durations may range from 450 to 650 Myr (sometimes even 1.3 Gyr).
On the other hand, for the other galaxies the -based is always higher than the H-based SFR, with both quantities also higher than the . This suggests that the recent star-formation activity has decreased when compared with that experienced by the galaxies in the last 100 Myr. We note, however, that some recent analyses (i.e., Lee et al., 2009; Pflamm-Altenburg, Weidner & Kroupa, 2009) indicate that the H luminosity underestimate the relative to the luminosity in dwarf galaxies with M⊙ yr-1. But the very low 20-cm radio-continuum flux estimated for these three galaxies strongly suggests that the star-formation activity has not been strong recently.
5.2 Comparison of the neutral gas component of NGC 5253 with that found in other starbursts
We now compare the features of the neutral gas component found in NGC 5253 with the other starbursts described in the literature. Recent analyses of the neutral gas component of dwarf starburst galaxies include NGC 2366 (van Eymeren et al., 2009a), NGC 4861 (van Eymeren et al., 2009b), NGC 5408 and IC 4662 (van Eymeren et al., 2010). All these galaxies have the common characteristic of showing outflows of neutral gas that follows the ionized gas. Indeed, the minimum of the H i column density are usually find at the center of these structures, as it happens in the NW region in NGC 5253 (see Fig. 3) where, as previously noticed by KS08, and H i shell spatially coincides with an H shell, and both structures seem to have similar expansion velocities (30–40 km s-1). This effect seems to be a consequence of both (i) the consumption of the neutral gas to form new stars and (ii) the injection of kinetic energy into the ISM by the combined action of both winds from massive stars and supernova explosions, that pushes the ionized gas and creates a superbubble that may develop in a galactic wind. However, perhaps the large amount of neutral gas still found in these shells are responsible for stalling the expansion and prevents the formation of a galactic wind (KS08), and hence that is the reason why these are not found in dwarf galaxies. Therefore, the non-detections of galactic winds in dwarf starburst galaxies will contradict the theoretical models by Mac Low & Ferrara (1999) but will agree with the theoretical models developed by Silich & Tenorio-Tagle (1998). Following these models, the expansion velocity of the outflows will never get close to or beyond the escape velocity due to presence of a dark matter halo (in our case, maybe the huge amount of neutral gas that is surrounding the main body of the galaxy is also playing an important role) that slows down the gas expelled by the galactic winds. In fact, the expansion velocities of the gas computed by van Eymeren et al. (2010) are 30-50% the escape velocities.
A clear H i blowout is found in the dIrr galaxy Holmberg I (Ho I), belonging to the M 81 galaxy group (Ott et al., 2001; Walter et al., 2007). The H i maps presented by these authors reveal one single H i hole surrounding by a supergiant shell. This structure, which comprises 75% of the total H i content of the galaxy, has a diameter of 1.7 kpc and covers about half the optical extent of Ho I. The supergiant shell found in Ho I is explained by the strong stellar winds and supernova explosions within the starburst. It seems that part of the neutral gas has been lost to the intergalactic medium. But the agreement between the maps shown by Ott et al. (2001) in Ho I and those obtained here for NGC 5253 is rather small. Furthermore, the star-formation activity is much higher in NGC 5253 than in Ho I. Both facts strongly suggest that NGC 5253 and Ho I are experiencing different star formation histories.
Outflows seem to be accompanied by both H and X-ray emission. For example, Skillman, Côté & Miller (2003) reported filaments of H emission in NGC 625 (another BCD and WR galaxy), which are related to blowouts as they trace the path of hot gas into the halo (Heiles, 1993). Effectively, the soft X-ray map of NGC 625 (Bomans & Grant, 1998) reveals hot gas emission ( K) which is associated with the ionized and neutral diffuse gas of the outflow. However, the ‘H i SE plume’ found in NGC 5253 is not associate with any H or X-ray emission. Actually, the X-ray emission extends preferentially to the SW of the nucleus in this galaxy (Summers et al., 2004, KS08), casting doubt on its origin as an outflow.
NGC 625 is another BCDG hosting a large number of WR stars. The ATCA H i moment maps of NGC 625 presented by Cannon et al. (2004) reveals that this galaxy also has perturbed neutral gas kinematics. These authors explain this following a blowout scenario which is the result of an spatially and temporally extended star formation event that the galaxy has experienced in the last 100 Myr. However, Cannon et al. (2004) reported that NGC 625 is indeed undergoing solid-body rotation about its optical minor axis, as expected for an inclined rotating disc. Interestingly, their high- and low-resolution H i maps of NGC 625 agree well between them. However, the situation in NGC 5253 is different. The high-resolution H i maps are revealing the densest neutral gas in the galaxy, which is basically associated with the ‘NW H+H i shell’ and the ‘SE H i plume’. However, the low-resolution H i map shows the diffuse neutral gas, which is mainly perturbed by external factors.
It is interesting to compare NGC 5253 with IC 10, which is the only known starburst within the Local Group. As NGC 5253, IC 10 is a low-metallicity –12+log(O/H)=8.26, Skillman et al. (1989); Garnett (1990); Magrini & Gonçalves (2009)– low-mass galaxy showing a high star-formation activity (i.e., Hodge & Lee, 1990; Leroy et al., 2006), high far-infrared emission (Melisse & Israel, 1994) and non-thermal radio-continuum emission (Yang & Skillman, 1993). The outer H i gas of IC 10 was discovered by Shostak & Skillman (1989) and studied further by Wilcots & Miller (1998). These authors characterized the neutral gas of IC 10 by a rotating disc embedded in an extended, clumpy and complex distribution of gas. Wilcots & Miller (1998) also noted that the feedback of the massive stars has shaped shells and bubbles in the neutral gas of IC 10. However, the complex distribution and kinematics of the extended neutral gas around IC 10 suggest that this galaxy is still accreting gas from the large, extended H i reservoir, and hence the starburst may have been probably triggered by this gas falling in.
Another interesting dwarf starbursting galaxy is NGC 1705. Meurer, Staveley-Smith & Killeen (1998) presented an analysis of the H i gas in this BCDG. They found an H i rotating disc structure, but also a neutral gas distribution that appears disturbed. They reported the detection of an ‘H i spur’, which has around the 8% of the total H i mass of the galaxy, extending at least 4.5 kpc to the halo. These authors explained this feature as a consequence of an outflow, and then M⊙ of neutral ISM has been expelled from the galaxy. This scenario agrees with the outflow of ionized gas powered by a central massive star clusters (Marlowe et al., 1995). Meurer et al. (1998) also considered that the interaction origin of this feature, which may be an independent H i cloud that is in process of merging with NGC 1705. They discarded this hypothesis because the optical appearance of the galaxy is not disturbed at all. As in NGC 1705, the optical distribution of NGC 5253 is also quite symmetric. However, in both cases the detection limit of the available optical images is mag arcsec-1 (Lauberts & Valentijn, 1989; Gil de Paz et al., 2003), but the stellar features that may be associated with these H i spurs may be much fainter (e.g., López-Sánchez et al., 2006; López-Sánchez & Esteban, 2008) and hence very deep images ( mag arcsec-1) are needed to detect these very faint features (e.g., Martínez-Delgado et al., 2009, 2010). Hence, we should not completely discard the hypothesis that the ‘ H i spur’ detected by Meurer et al. (1998) in NGC 1705 actually has a tidal origin. A fundamental difference with NGC 5253 is that the ‘ H i spur’ found in NGC 1705 is not dominating the H i dynamics of the galaxy, which follow a well-defined rotation pattern. But that is not the case of NGC 5253, where the effect of the ‘SE H i plume’ is completely masking the expected rotation of the galaxy and it is strongly perturbing the dynamics of the BCDG.
van Eymeren et al. (2010) reported evidence of merging in the BCDG IC 4662, as its diffuse H i gas is somewhat distorted and it shows a tail of neutral gas. Indeed, spectroscopic observations (Hidalgo-Gámez, Masegosa & Olofsson, 2001; López-Sánchez et al., 2011) seem to reveal important physical and chemical differences in the ionized gas within this galaxy, which also indicate that this galaxy actually is composed by two entities in interaction. Hence, in IC 4662 we found both outflows of neutral and ionized gas surrounding the star-forming regions but also distortions in the neutral gas that seem to be originated by a galaxy merger.
Finally, we compare NGC 5253 with the BCDG NGC 1569, which also hosts a strong starburst (Waller, 1991; González-Delgado et al., 1997; Buckalew & Kobulnicky, 2006). This galaxy seems that recently interacted with an independent H i cloud (Stil & Israel, 1998, 2002; Mühle et al., 2005). It shows a rotation velocity of only 30 km s-1(Heckman et al., 1995) but outflows with expansion velocities up to 100 km s-1 (Westmoquette, Smith & Gallagher, 2008). The situation in this galaxy is quite similar to that found in NGC 5253: a perturbed H i morphology and kinematics, high dispersion velocities of the central neutral gas, an almost inexistent rotation pattern, the probable detection of tidally ejected material, and outflows of both neutral (Stil & Israel, 2002) and ionized (Westmoquette et al., 2007b) gas related to the violent star-formation activity in the starburst. Hence we conclude that the main peculiar characteristic of the neutral gas in NGC 5253 (i.e., the apparent rotation about its optical major axis following the ‘SE H i plume’) is naturally explained by the infall of an independent H i cloud and not by an outflow.
Summarizing, the comparison between NGC 5253 and a galaxy clearly hosting an outflow (Ho I) indicates that the nature of the H i gas has different origins. Furthermore, there is no H or X-ray emission associated with the ‘SE H i plume’. However, the situation of NGC 5253 is similar to that observed in galaxies which seem to be in interaction with diffuse H i clouds (IC 10, IC 4662, NGC 625, NGC 1705) and it is almost identical to that seen in a galaxy which is certainly known to be experiencing an interaction event with an independent H i cloud (NGC 1569).
5.3 Environment of NGC 5253
NGC 5253 is located in the Centaurus A Group, which is one of the nearest galaxy groups within the Local Volume. It consists of two subgroupings (Karachentsev et al., 2002, 2007), one around Cen A (NGC 5128, which lies at 3.77 Mpc) and the other around M 83 (NGC 5236, which is at a distance of 4.6 Mpc). This late-type spiral galaxy possesses an unusually large H i envelope (Koribalski, 2005; Koribalski et al., 2011) and it is surrounded by some dwarf irregular galaxies: ESO 444-G084, IC 4316, UGCA 365 (ESO 444-G078), NGC 5264 and NGC 5253. NGC 5253 lies at an angular distance of 54’ and from M 83 and Cen A, respectively.
However, its distance obtained using different methods give different results (i.e., Saha et al., 1995; Gibson et al., 2000; Karachentsev et al., 2002, 2007; Thim et al., 2003; Sakai et al., 2004; Davidge, 2007; Mould & Sakai, 2008) ranging between 3.0 and 4.2 Mpc. Here we adopted 4.0 Mpc following Karachentsev et al. (2004). Hence, NGC 5253 is somewhat located at the periphery of the Cen A / M 83 complex and between both subgroups. Karachentsev et al. (2007), however, located NGC 5253 in the Cen A subgroup, but this galaxy is not far away from ESO 444-G084, IC 4316 and NGC 5264, which lie at around 4.5 Mpc, all belonging to the M 83 subgroup. The estimations of the distance to M 83 range between 4.5 and 4.9 Mpc, here we consider it is at 4.6 Mpc (Karachentsev et al., 2002).
The morphology and kinematics of the H i gas within NGC 5253 are much more difficult to explain than that seen in the nearby galaxies IC 4316, ESO 444-G084 and NGC 5264 (see Koribalski et al. 2011 to see their H i maps). These three galaxies mainly show symmetric H i morphologies and a pattern of rotation, although some mild disturbances seem to be found in ESO 444-G084 and NGC 5264. In the latter case there is some evidence that the galaxy interacted with an independent object in the past. Current cosmological models indicate that purely isolated galaxies should be extremely rare. Indeed, we should expect to find distortions in the outer parts of the galaxies and, in some way, it should be very difficult to find a ‘pure” isolated system (Koribalski, 2010). These disturbances reveal the processes that are building up the galaxies and are very evident in strong star-forming dwarf systems when deep data are available (e.g., López-Sánchez & Esteban, 2008, 2009; López-Sánchez, 2010). The peculiar morphology and kinematics of the H i gas reported here in NGC 5253 and the very intense starburst that this galaxy is experiencing strongly suggest a connection between both galaxy properties.
It is interesting to note that NGC 5253 is also close to the late-type spiral galaxy M 83, which lies at a radial distance of only 600 kpc, being the projected separation between them 130 kpc. LVHIS data of this galaxy (Koribalski, 2005; Koribalski et al., 2011) are remarkable, as its H i distribution (which has a size of 100 kpc, i.e., at least 5 times larger than its optical Holmberg diameter) has streamers, irregular enhancements, and more interesting, an asymmetric tidal arm which points out to the direction of NGC 5253. This tidal structure indicates that M 83 has accreted or strongly interacted with a dwarf galaxy in the past. Furthermore, Bresolin et al. (2009) reported an abrupt discontinuity in the radial oxygen abundance trend near the optical edge of the disc of M 83, which they also associated to a past galaxy encounter. Could it be with NGC 5253? Previous authors (van den Bergh, 1980; Caldwell & Phillips, 1989) already suggested that the nuclear starburst observed in NGC 5253 was triggered as a result with an interaction with M 83 around 1 Gyr ago. In this sense, the main disturbances in the H i distribution we observe in NGC 5253 are precisely located in the direction to the long tidal arm found in M 83. Hence, our data may suggest that a diffuse H i filament between both galaxies exist, and part of it may be infalling NGC 5253. Indeed, the metallicity computed by Bresolin et al. (2009) in the external disc of M 83 –12+log(O/H)8.2– is a good match to that estimated in NGC 5253. This diffuse gas stripped from the external H i disc of M 83 may be the origin of the H i cloud that is infalling along the minor axis of NGC 5253. The fact that the real duration of the starburst in NGC 5253 may be longer than 450 Myr (McQuinn et al., 2010a, b) ties very well with either the ongoing infall that the galaxy may be experiencing now or the effects with an interaction with M 83 that started well before the currently observed star-formation burst.
5.4 Other peculiarities of NGC 5253
López-Sánchez (2010) analyzed a sample of strong star-forming galaxies (Wolf-Rayet galaxies) that included NGC 5253. He found that, contrary to that observed in starburst galaxies and in star-forming regions or -rich star clusters in spiral galaxies (Kennicutt et al., 2007; Koribalski & López-Sánchez, 2009), NGC 5253 does not obey the Schmidt-Kennicutt (S-K) scaling laws of star-formation (Schmidt, 1959, 1963; Kennicutt, 1998).
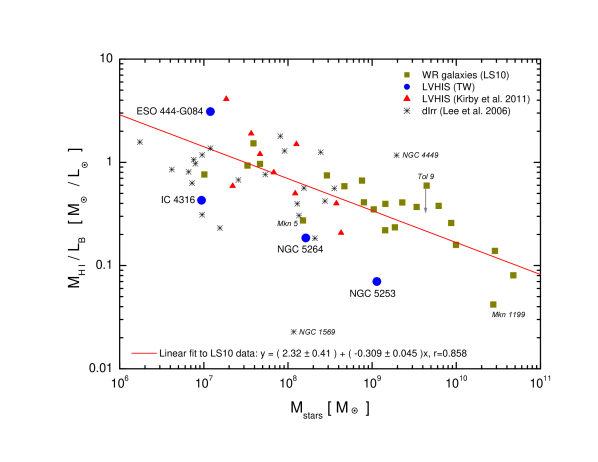
López-Sánchez (2010) also compared the H i mass-to-light ratio (which is a distance-independent quantity) with the total stellar mass, , for his galaxy sample (see his Fig 16). We reproduce this plot in our Fig. 12, his data points are the dark yellow squares but adding the position of the LVHIS galaxies analyzed by Kirby et al. (2011) (red triangles) and the data points of the sample of nearby dwarf irregular galaxies studied by Lee et al. (2007) (stars). As noticed by López-Sánchez (2010), the position of NGC 5253 in this diagram clearly disagrees with the position of the other galaxies, as it shows a ratio that is an order of magnitude smaller than that expected from its stellar mass. We note that NGC 1569, that shares similar properties to those observed in NGC 5253 (including a probable interaction with an independent H i cloud, see Sect 5.2), also lies very far from the position of the other galaxies in the diagram plotted in Fig. 12.
López-Sánchez (2010) also compared the / ratio and the oxygen abundance for his galaxy sample. His Fig. 17 clearly shows that the / ratio decreases with increasing metallicity, indicating that the importance of the stellar component to the total mass is larger in more massive galaxies. Indeed, galaxies show a clear correlation between the oxygen abundance and the total stellar mass (see left panel of Fig. 14 in López-Sánchez 2010 and Lara-López et al. 2010). Again, the position of NGC 5253 in this diagram does not agree with that observed for the rest of the galaxies, as it seems to have a 5 times lower ratio than that expected for its metallicity. This may indicate that the oxygen abundance derived in the central, intense star-forming region is not reflecting the metallicity of the stellar component of the galaxy (i.e., the metallicity of stars born in previous star-formation events), which may be higher than that derived from the analysis of the ionized gas. Assuming the derived / ratio for NGC 5253, we should expect that this galaxy has a metallicity up to 0.3–0.4 dex higher than that computed in the central starburst [12+log(O/H)=8.180.03, López-Sánchez et al. 2007]. Hence, the infall of low-metallicity neutral gas that we suggest here may have lowered the gas-phase abundance of this galaxy. Interestingly, López-Sánchez et al. (2007) found that the youngest starbursts –regions A and B, with 12+log(O/H)=8.180.03– have a metallicity which is 0.1 dex lower than that reported in slightly older areas –regions C and D, with 12+log(O/H)=8.300.05–.
Köppen & Hensler (2005) created chemical evolution models that consider massive and rapid accretion of metal-poor gas into a galaxy. They found that the oxygen abundance is decreased during the infall due to dilution of the galactic gas, and that gas masses of 106 M⊙ would be sufficient to cause a large influence on dwarf galaxies. They concluded that such a collision could leave observable marks in the chemical properties of the galaxies, different from what a closed-box evolution predicts. Indeed, NGC 5253 do not follow a close-box model (see Fig. 21 in López-Sánchez, 2010), as it happens in the majority of the WR galaxies analyzed by this author. Actually, all the predictions indicated by Köppen & Hensler (2005) are satisfied in the case of NGC 5253, who also predicted that the galaxy may be very bright if the infall triggers enhanced star-formation. Hence, the hypothesis of the infall of an H i cloud in NGC 5253 will naturally explain its relatively high baryonic mass for its oxygen abundance (see left panel of Fig. 14 in López-Sánchez, 2010), its very low ratio (and its position in Fig. 12) and its deviation of the S-K scaling laws of star-formation.
6 Conclusions
We have presented deep H i line and 20-cm radio continuum data of the intriguing blue compact dwarf galaxy NGC 5253. The data were obtained using the ATCA as part of the LVHIS survey, but also from our multiwavelength analysis of BCDGs. Hence, we completed our study using multiwavelength data extracted from the literature, which includes X-ray, , optical - and -band, H, -band, and data.
Our deep low-resolution H i maps show, for the first time, the very disturbed H i morphology that NGC 5253 possesses in its external areas, which includes tails, plumes and detached H i clouds. Our data recovers almost 96% of the single-dish H i-flux, indicating that very few diffuse emission has been filtered out in our interferometric observations. We derive a total H i mass of M⊙ in NGC 5253, around 5% of this mass ( M⊙) is located in the diffuse almost detached gas found at the northern area of the galaxy. Adding the stellar mass to the neutral gas mass, we estimate that the baryonic mass of NGC 5253 is M⊙.
The high-resolution H i maps trace an H shell at the NW of the galaxy, which has a mass of M⊙, and it is related to an expanding bubble in the ISM that seems to be a consequence of the combined actions of the winds of massive stars and supernova explosions. However, this expanding bubble will almost certainly not end in a galactic wind. Our high-resolution H i maps also confirm the discovery of a ‘SE H i plume’ made by Kobulnicky & Skillman (2008), which is now clearly detected. This feature is not associated with any H or X-ray emission and hence it is most likely not related to an outflow. Indeed, the kinematics of the neutral gas in NGC 5253 derived from the low- and medium-resolution H i maps is highly perturbed and do not follow a rotation pattern. We argued that this feature actually is an independent H i cloud which is interacting with the main body of the galaxy. However, the H i data may also suggest that some of the features observed in NGC 5253 have been originated as the result of ram pressure stripping from moving through a dense IGM.
Our 20-cm radio-continuum maps show that the emission of NGC 5253 is resolved and associated with the intense star-forming region located at the center of the galaxy. We estimate the star-formation rate () using a multiwavelength approach, and compare the results with other galaxy properties. NGC 5253 does not satisfy the Schmidt-Kennicutt law of star-formation, has a very low H i mass-to-light ratio when comparing with its stellar mass, and seems to be slightly metal-deficient in comparison with starburst galaxies of similar baryonic mass. The relatively high stellar mass also indicates that the BCDG has experienced a relatively long star-formation history.
We have compared the properties observed in NGC 5253 with those seen in three nearby galaxies members of the M 83 subgroup (IC 4316, ESO 444-G084 and NGC 5264, for which we have also derived their properties using the data provided by the LVHIS survey) and with the properties found in other starbursting dwarf galaxies.
Taking into account all available observational data and the comparison with similar starbursting galaxies, we conclude that NGC 5253 is very probably experiencing the infall of a diffuse, low-metallicity H i cloud along the minor axis of the galaxy, which is comprising the ISM and triggering the powerful central starburst. Both entities seem to be now in a process of merging, but the interaction probably started some time ago, as we detect tidal gas at the northern regions of the galaxy and it seems that previous starbursts have occurred in the system. Perhaps the origin of this low-metallicity H i cloud is related to the very asymmetric tidal H i arm detected in M 83, which may indicate that both galaxies have experience a strong interaction in the past.
This study reinforces the conclusions reached by López-Sánchez (2006, 2010), which suggests that interactions with or between dwarf galaxies or H i clouds trigger the star-formation activity in many dwarf and normal starburst galaxies.
Following the proposed infall scenario, perhaps the combined actions of the accretion of low-metallicity gas and the outflow found at the NW of the galaxy (which is now moving the metal-rich material into the surrounding IGM) have lowered the total oxygen abundance of NGC 5253, as its mass-to-light and mass-to-mass ratios seem to match better with an object with metallicities up to 0.3–0.4 dex higher than those computed in the youngest starburst. Hence, we conclude that detailed and comprehensive multiwavelength analysis, such as this presented here, is a powerful tool to elucidate the complex relationships between star-formation activity and the structure of the inner and external ISM, as well as to constrain the evolution and fate of the gas in star-forming galaxies.
Acknowledgements
We thank the referee, Evan D. Skillman, for his detailed reviewing, that improved the quality of this paper. Based on observations made with the ATCA (Australia Telescope Compact Array), which is funded by the Commonwealth of Australia for operation as a National Facility managed by CSIRO. This research has made extensive use of the NASA/IPAC Extragalactic Database (NED) which is operated by the Jet Propulsion Laboratory, Caltech, under contract with the National Aeronautics and Space Administration. The Digitised Sky Survey was produced by the Space Telescope Science Institute (STScI) and is based on photographic data from the UK Schmidt Telescope, the Royal Observatory Edinburgh, the UK Science and Engineering Research Council, and the Anglo-Australian Observatory. The Galaxy Evolution Explorer (GALEX) is a NASA Small Explorer, launched in April 2003. We gratefully acknowledge NASA’s support for construction, operation, and science analysis for the GALEX mission. This research has made extensive use of the SAO/NASA Astrophysics Data System Bibliographic Services (ADS).
References
- (1)
- (2)
- Alonso-Herrero et al. (2004) Alonso-Herrero, A., Takagi, T., Baker, A.J. , Rieke, G.H., Rieke, M. J.; Imanishi, M. & Scoville, N. Z. 2004, ApJ, 612, 222
- Asplund et al. (2005) Asplund, M., Grevesse, N. & Sauval, A. J. 2005, in ASP Conf. Ser. 335, Cosmic Abundances as Records of Stellar Evolution and Nucleosynthesis, ed. F.N. Bash & T.G. Barnes (San Francisco: ASP), 25
- Barnes et al. (2001) Barnes D.G., et al. 2001, MNRAS, 322, 486
- Beck et al. (1996) Beck, S.C., Turner, J.L., Ho, P.T.P., Lacy, J.H., & Kelly, D.M. 1996, ApJ, 457, 610
- Bessel et al. (1998) Bessel, M.S., Castelli, F. & Plez, B. 1998, A&A 333, 231
- Bomans & Grant (1998) Bomans, D. J. & Grant, M.-B. 1998, Astron. Nachr., 319, 26
- Bresolin et al. (2009) Bresolin, F., Ryan-Weber, E., Kennicutt, R.C. & Goddard, Q. 2009, ApJ, 695, 580
- Buckalew & Kobulnicky (2006) Buckalew, B.A. & Kobulnicky, H.A. 2006, AJ, 132, 1061
- Caldwell & Phillips (1989) Caldwell, N. & Phillips, M.M. 1989, ApJ, 338, 789
- Cannon et al. (2004) Cannon, J.M., McClure-Griffiths, N.M., Skillman, E.D. & Côté, S. 2004, ApJ, 607, 274
- Colina, Bohlin & Castelli (1996) Colina, L., Bohlin, R.C. & Castelli, F., 1996, AJ, 112, 307
- Calzetti et al. (1997) Calzetti, D. Meurer, G.R., Bohlin, R.C., Garnett, D.F., Kinney, A.L., Leitherer, C., & Storchi-Bergmann, T. 1997, AJ, 114, 1834
- Calzetti et al. (2004) Calzetti, D., Harris, J., Gallagher III, J.S., Smith, D.A., Conselice, C.J., Homeier, N. & Kewley, L. 2004, AJ, 127, 1405
- Calzetti et al. (2007) Calzetti, D. et al. 2007, ApJ, 666, 870
- Campbell et al. (1986) Campbell, A., Terlevich, R., & Melnick, J. 1986, MNRAS, 223, 811
- Condon (1992) Condon, J.J. 1992, ARA&A 30, 575
- Condon et al. (1996) Condon, J. J., Helou, G., Sanders, D. B. & Soifer, B. T. 1996, ApJS, 103, 81
- Condon et al. (2002) Condon, J.J., Cotton, W.D. & Broderick, J.J. 2002, AJ, 124, 675
- Cresci et al. (2005) Cresci, G., Vanzi, L., & Sauvage, M. 2005, A&A, 433, 447
- Davidge (2007) Davidge, T. J. 2007, AJ, 134, 1799
- de Vaucouleurs et al. (1991) de Vaucouleurs G., de Vaucouleurs A., Corwin Jr. H.G., Buta R.J., Paturel G., Fouqué P. 1991, Third Reference Catalogue of Bright Galaxies’ (New York: Springer Verlag), [RC3]
- Garnett (1990) Garnett, D.R. 1990, ApJ, 363, 142
- Gibson et al. (2000) Gibson, B.K. et al. 2000, ApJ, 529, 723
- Gil de Paz et al. (2003) Gil de Paz, A., Madore, B.F. & Pevunova, O. 2003, ApJS, 147, 29
- González-Delgado et al. (1997) González-Delgado, R.M., Leitherer, C., Heckman, T. & Cerviño, M. 1997, ApJ, 483, 705
- Gonzalez-Riestra et al. (1987) Gonzalez-Riestra, R., Rego, M. & Zamorano, J. 1987, A&A, 186, 64
- Harris et al. (2004) Harris, J., Calzetti, D., Gallagher, J.S., Smith, D.A., & Conselice, C.J. 2004, ApJ, 603, 503
- Heckman et al. (1995) Heckman, T. M., Dahlem, M., Lehnert, M. D., Fabbiano, G., Gilmore, D. & Waller, W. H. 1995, ApJ, 448, 98
- Heiles (1993) Heiles, C. 1993, RvMA, 6, 19
- Hidalgo-Gámez et al. (2001) Hidalgo-Gámez, A. M., Masegosa, J. & Olofsson, K. 2001, A&A, 369, 797
- Hodge & Lee (1990) Hodge, D.A. & Lee, M.G. 1990, PASP, 102, 26, [HL90]
- Kaldare et al. (2003) Kaldare, R., Colless, M., Raychaudhury, S. & Peterson, B. A. 2003, MNRAS, 339, 652
- Karachentsev et al. (2002) Karachentsev, I. D., Sharina, M.E., Dolphin, A.E., Grebel, E.K., Geisler, D., Guhathakurta, P., Hodge, P.W., Karachentseva, V.E., Sarajedini, A. & Seitzer, P. 2002, A&A, 385, 21
- Karachentsev et al. (2004) Karachentsev, I. D., Karachentseva, V.E., Huchtmeier, W. & Makarov, D.I. 2004, AJ, 127, 2031
- Karachentsev et al. (2007) Karachentsev, I. D. et al. 2007, AJ, 133, 504
- Kennicutt (1998) Kennicutt, R.C. Jr. 1998, ApJ, 498, 541
- Kennicutt et al. (2007) Kennicutt, R.C. Jr., et al. 2007, ApJ, 671, 333
- Kirby et al. (2008) Kirby, E.M., Jerjen, H., Ryder, S.D. & Driver, S.P. 2008, AJ, 136, 1866
- Kirby et al. (2011) Kirby, E.M., Koribalski, B.S., Jerjen, H., & López-Sánchez, Á.R., 2011, MNRAS, submitted
- Kobulnicky & Skillman (1995) Kobulnicky, H.A, & Skillman, E.D. 1995, ApJ, 454, L121
- Kobulnicky et al. (1997) Kobulnicky, H.A., Skillman, E.D., Roy, J.-R., Walsh, J.R. & Rosa, M.R., 1997, ApJ, 277, 679
- Kobulnicky & Skillman (2008) Kobulnicky, H.A, & Skillman, E.D. 2008, AJ, 135, 527, KS08
- Köppen & Hensler (2005) Köppen, J. & Hensler, G. 2005, A&A, 434, 531
- Koribalski et al. (2004) Koribalski B.S. et al. 2004, AJ, 128, 16
- Koribalski (2005) Koribalski, B.S. 2005, PASP, 22, 331
- Koribalski (2008) Koribalski, B.S. 2008, in Galaxies in the Local Volume, Sydney, 8–13 July 2007, eds. B.S. Koribalski & H. Jerjen, Springer, p. 41
- Koribalski & López-Sánchez (2009) Koribalski, B.S. & López-Sánchez, Á.R. 2009, MNRAS, 400, 1749
- Koribalski (2010) Koribalski, B.S. 2010, proceedings of the conference Galaxies in isolation: Exploring Nature vs. Nurture hold at Granada (Spain) on 12 - 15 May 2009, in press
- Koribalski & López-Sánchez (2009) Koribalski, B.S. & López-Sánchez, Á.R., 2009, MNRAS, 400, 1749
- Koribalski et al. (2011) Koribalski, B.S., López-Sánchez, Á.R. et al. 2011, The Local Volume HI Survey, in preparation
- Jones et al. (2005) Jones, D.H. et al 2005, PASA, 22, 277
- Lara-López et al. (2010) Lara-López, M.A. et al. 2010, A&A, 521, 53
- Lauberts & Valentijn (1989) Lauberts A., Valentijn, E.A. 1989, The surface photometry catalogue of the ESO-Uppsala galaxies, Garching bei München: ESO
- Lee et al. (2003) Lee, H., Grebel, E. K. & Hodge, P. W. 2003 A&A, 40, 141
- Lee et al. (2007) Lee, H., Zucker, D.B. & Grebel, E.K. 2007, MNRAS, 376, 820
- Lee et al. (2009) Lee, J.C., et al. 2009, ApJ, 706, 599
- Leroy et al. (2006) Leroy, A., Bolatto, A., Walter, F. & Blitz, L. 2006, ApJ, 643, 825
- López-Sánchez (2006) López-Sánchez, Á.R. 2006, Massive star formation in dwarf Wolf-Rayet galaxies. PhD Thesis, La Laguna University, Tenerife, Spain
- López-Sánchez (2010) López-Sánchez, Á.R. 2010, A&A, 521, 63
- López-Sánchez, Esteban & García-Rojas (2006) López-Sánchez, Á.R., Esteban, C. & García-Rojas, J. 2006, A&A, 449, 997
- López-Sánchez et al. (2007) López-Sánchez, Á.R., Esteban, C., García-Rojas, J., Peimbert, M. & Rodríguez, M. 2007, ApJ, 656, 168
- López-Sánchez et al. (2008) López-Sánchez, Á.R., Koribalski, B.S., Esteban, C. & García-Rojas, 2008, proceedings of Galaxies in the Local Volume, B.S. Koribalski & Helmut Jerjen (Eds.), Astrophysics and Space Science Proceedings, Springer, p.53
- López-Sánchez & Esteban (2008) López-Sánchez, Á.R. & Esteban, C. 2008, A&A, 491, 131
- López-Sánchez & Esteban (2009) López-Sánchez, Á.R. & Esteban, C. 2009, A&A, 508, 615
- López-Sánchez et al. (2009a) López-Sánchez, Á.R., Koribalski, B.S., Esteban, C. Popping, A., van Eymeren, J. & Hibbard, J. 2009a, proceedings of the workshop Star forming galaxies: Following Ariadne’s Thread in the Cosmic Labyrinth hold at Crete (Greece) on 29 September - 03 October 2008, in press
- López-Sánchez et al. (2009b) López-Sánchez, Á.R., Koribalski, B.S., Esteban, C. Popping, A., van Eymeren, J. & Hibbard, J. 2009b, proceedings of the conference Galaxies in isolation: Exploring Nature vs. Nurture hold at Granada (Spain) on 12 - 15 May 2009, in press
- López-Sánchez & Esteban (2010a) López-Sánchez, Á.R. & Esteban, C. 2010a, A&A, 516, 104
- López-Sánchez & Esteban (2010b) López-Sánchez, Á.R. & Esteban, C. 2010b, A&A, 517, 85
- López-Sánchez et al. (2011) López-Sánchez, Á.R., Koribalski, B.S., Esteban, C. van Eymeren, J., Popping, A., Jones, H.D. & Hibbard, J. 2011, in prep
- Mac Low & Ferrara (1999) Mac Low, M-M. & Ferrara, A. 1999, ApJ, 513, 142
- Magrini & Gonçalves (2009) Magrini, L. & Gonçalves, D.R. 2009, MNRAS, 398, 280
- Marlowe et al. (1995) Marlowe, A. T., Heckman, T. M., Wyse, R. F. G. & Schommer, R. 1995, ApJ, 438, 563
- Martin (1998) Martin, C.L. 1998, ApJ, 506, 222
- Martin et al. (2002) Martin, C.L., Kobulnicky, H.A. & Heckman, T.M. 2002, ApJ, 574, 663
- Martínez-Delgado et al. (2009) Martínez-Delgado, D. et al. 2009, ApJ, 692, 955
- Martínez-Delgado et al. (2010) Martínez-Delgado, D. et al. 2010, AJ, 140, 962
- Martín-Hernández (2005) Martín-Hernández, N.L., Schaerer, D., & Savage, M. 2005, A&A, 429, 449
- Mayya et al. (2006) Mayya, Y.D., Bressan, A., Carrasco, L. & Hernández-Martínez, L. 2006, ApJ, 649, 172
- McQuinn et al. (2010a) McQuinn, K. B. W., Skillman, E. D., Cannon, J.M., Dalcanton, J., Dolphin, A. Hidalgo-Rodríguez, S., Holtzman, J., Stark, D., Weisz, D. & Williams, B. 2010a, ApJ, 721, 297
- McQuinn et al. (2010b) McQuinn, K. B. W., Skillman, E. D., Cannon, J.M., Dalcanton, J., Dolphin, A. Hidalgo-Rodríguez, S., Holtzman, J., Stark, D., Weisz, D. & Williams, B. 2010b, ApJ, 724, 49
- Meier et al (2002) Meier, D.S., Turner, J.L., & Beck, S.C. 2002, AJ, 124, 877
- Melisse & Israel (1994) Melisse, J.P.M. & Israel, F.P. 1994, A&AS, 103, 391
- Meurer et al. (1998) Meurer, G. R., Staveley-Smith, L. & Killeen, N. E. B. 1998, MNRAS, 300, 705
- Meurer et al. (2006) Meurer, G.R. et al. 2006, ApJS, 165, 307
- Minchin et al. (2003) Minchin et al. 2003, MNRAS, 346, 787
- Monreal-Ibero et al. (2010) Monreal-Ibero, A., Vílchez, J.M.; Walsh, J.R. & Muñoz-Tuñón, C. 2010, A&A, 517, 27
- Moorwood & Glass (1982) Moorwood, A. F. M. & Glass, I. S. 1982, A&A, 115, 84
- Mould & Sakai (2008) Mould, J. & Sakai, S. 2008, ApJ, 686, 75
- Mühle et al. (2005) Mühle, S., Klein, U., Wilcots, E. M. & Hüttemeister, S. 2005, AJ, 130, 524
- Ott et al. (2001) Ott, J., Walter, F., Brinks, E., Van Dyk, S. D., Dirsch, B. & Klein, U. 2001, AJ, 122, 3070
- Paturel et al. (2003) Paturel, G., Theureau, G., Bottinelli, L., Gouguenheim, L., Coudreau-Durand, N., Hallet, N. & Petit, C. 2003, A&A, 412, 57
- Pflamm-Altenburg, Weidner & Kroupa (2009) Pflamm-Altenburg, J., Weidner, C. & Kroupa, P. 2009, MNRAS, 395, 394
- Rieke et al. (1988) Rieke, G. H., Lebofsky, M. J. & Walker, C. E. 1988, ApJ, 325, 679
- Saha et al. (1995) Saha, A., Sandage, A., Labhardt, L., Schwengeler, H., Tammann, G.A., Panagia, N. & Macchetto, F. D. 1995, ApJ, 438, 8
- Sakai et al. (2004) Sakai, S., Ferrarese, L., Kennicutt, R. C., Jr. & Saha, A. 2004, ApJ, 608, 42
- Salim et al. (2007) Salim S., et al. 2007, ApJS, 173, 267
- Sault et al. (1995) Sault R.J., Teuben P.J., Wright M.C.H. 1995, in ‘Astronomical Data Analysis Software and Systems IV’, ed. R. Shaw, H.E. Payne, J.J.E. Hayes, ASP Conf. Ser. 77, 433
- Schaerer et al. (1997) Schaerer, D. Contini, T., Kunth, D., & Meynet, G. 1997, ApJ, 481, L75
- Schlegel et al. (1998) Schlegel, D.J., Finkbeiner, D.P. & Davis, M. 1998, ApJ, 500, 525
- Schmidt (1959) Schmidt, M. 1959, ApJ, 129, 243
- Schmidt (1963) Schmidt, M. 1963, ApJ, 137, 758
- Shostak & Skillman (1989) Shostak, G.S. & Skillman, E.D. 1989, A&A, 214, 33
- Silich & Tenorio-Tagle (1998) Silich, S.A. & Tenorio-Tagle, G. 1998, MNRAS, 299, 249
- Skillman et al. (1989) Skillman, E.D., Kennicutt, R.C. & Hodge, P.W. 1989, ApJ, 347, 875
- Skillman et al. (2003) Skillman, E.D., Côté, S. & Miller, B. W. 2003, AJ, 125, 593
- Skrutskie et al. (2006) Skrutskie, M. F. et al. 2006, AJ, 131, 1163, 2MASS
- Stil & Israel (1998) Stil, J. M. & Israel, F. P. 1998, A&A, 337, 64
- Stil & Israel (2002) Stil, J. M. & Israel, F. P. 2002, A&A, 392, 473
- Strickland & Stevens (1999) Strickland, D. K. & Stevens, I. R. 1999, MNRAS, 306, 43
- Summers et al. (2004) Summers, L. K., Stevens, I.R., Strickland, D.K. & Heckman, T.M. 2004, MNRAS, 351, 1
- Thim et al. (2003) Thim, F., Tammann, G.A., Saha, A., Dolphin, A., Sandage, A., Tolstoy, E. & Labhardt, L. 2003, ApJ, 590, 256
- Turner et al. (1997) Turner, J.L., Beck, S.C. & Hurt, R.L. 1997, ApJ, 474, L11
- Turner et al. (1998) Turner, J.L., Ho, P.T.P. & Beck, S.C. 1998, AJ, 116, 1212
- Turner & Beck (2004) Turner, J.L. & Beck, S.C. 2004, ApJ, 602, 85;
- van den Bergh (1980) van den Bergh, S. 1980, PASP, 92, 122
- van Eymeren et al. (2009a) van Eymeren, J., Marcelin, M., Koribalski, B.S., Dettmar, R.-J., Bomans, D.J., Gach, J.-L. & Balard, P. 2009a, A&A, 493, 511
- van Eymeren et al. (2009b) van Eymeren, J., Marcelin, M., Koribalski, B.S., Dettmar, R.-J., Bomans, D.J., Gach, J.-L. & Balard, P. 2009b, A&A, 505, 105
- van Eymeren et al. (2010) van Eymeren, J., Koribalski, B.S., López-Sánchez, Á.R., Dettmar, R.-J. & Bomans, D.J. 2010, MNRAS, 407, 113
- Vanzi & Sauvage (2004) Vanzi, L. & Sauvage, M. 2004, A&A, 415, 509
- Waller (1991) Waller, W. H. 1991, ApJ, 370, 144
- Walsh & Roy (1989) Walsh, J.R., & Roy, J.-R., 1989, MNRAS, 239, 297
- Walter et al. (2007) Walter, F. et al. 2007, ApJ, 661, 102
- Warren et al. (2004) Warren, B.E., Jerjen, H. & Koribalski, B.S. 2004, AJ, 128, 1152
- Westmoquette et al. (2007a) Westmoquette, M.S., Smith, L. J., Gallagher, J.S. & Exter, K.M. 2007a, MNRAS, 381, 894
- Westmoquette et al. (2007b) Westmoquette, M.S., Smith, L. J., Gallagher, J.S. & Exter, K.M. 2007b, MNRAS, 381, 913
- Westmoquette et al. (2008) Westmoquette, M.S., Smith, L. J. & Gallagher, J.S. 2008, MNRAS, 383, 864
- Wilcots & Miller (1998) Wilcots, E.M. & Miller, B.W. 1998, AJ, 116, 2363
- Yang & Skillman (1993) Yang, H. & Skillman, E.D. 1993, AJ, 106, 1448
- Yun et al. (2001) Yun, M.S., Reddy, N.A. & Condon, J.J. 2001, ApJ 554, 803