Simulations of photon detection in SiPM number-resolving detectors
?abstractname?
Number-resolving single photon detectors are essential for the implementation of numerous innovative quantum information schemes. While several number-discriminating techniques have been previously presented, the Silicon Photo-Multiplier (SiPM) detector is a promising candidate due its rather simple integration in optical setups. On the other hand, the photon statistics obtained with the SiPM detector suffer from inaccuracies due to inherent distortions which depend on the geometrical properties of the SiPM. We have simulated the detection process in a SiPM detector and studied these distortions. We use results from the simulation in order to interpret experimental data and study the limits in which available models prevail.
pacs:
42.50.Ar 42.79.Pw 02.70.DhPhoton-number discriminating detectors have been the subject of great interest over the past few years. Number resolving capabilities are the key to several quantum state preparation schemes [1, 2, 3] as well as in the implementation and analysis of quantum computation schemes [4, 5, 6, 7, 8]. Photon-number resolution also enables the direct measurement of a state’s photon-number statistics, from which non-classical properties as well as classical-to-quantum transitions can be studied and characterized [9, 10, 11].
Standard single photon detection techniques cannot resolve the number of photons, and number resolution is generally obtained by combining several number-insensitive detectors in a cascade or an array-like structure. One of the first photon-number resolving detectors introduced was the Visible Light Photon Counter (VLPC)[12]. The VLPC has a high detection efficiency, but requires cryogenic cooling. Superconducting devices which provide number resolution are available but also require low working temperatures[13, 14, 15, 16, 17]. Room-temperature based solutions using standard single avalanche photodiode (APD) detectors offer limited number-resolution[18], while other solutions based on spatial and temporal multiplexing are experimentally demanding [19, 20, 21, 22].
A promising approach is provided by the Silicon Photo-Multiplier (SiPM)[23]. The SiPM is composed of multiple silicon avalanche photo-diodes arranged on a single substrate. Each detection element acts as an independent avalanche photo-diode in Geiger-mode, which can absorb a photon and generate a confined electric discharge. Signals from all the detecting elements are combined to a single readout port, so that the intensity of the output signal is proportional to the number of impinging photons. The SiPM detector offers a very good number resolution, operates at room temperature and is easily integrated in optical setups.
When using SiPMs, three main factors affect the measured photon statistics. These effects are the relatively low detection probability, determined by the quantum efficiency and geometrical configuration, internal noise caused by thermal excitations resulting in false detection, and optical crosstalk (CT) in which a photon created by carrier relaxation in one detection element is detected in a neighboring element [24, 25]. There exist several models [26, 27, 28] which take these phenomena into account. These models aid in the interpretation of experimental results and allow the reconstruction of the original photon-number statistics. However, these available models handle the CT effect in a rather limiting manner, either by limiting the CT probability, limiting the overall number of CT events, or limiting the number of CT stages (ignoring crosstalk events generated by crosstalks). Since these models were inaccurate in describing our experimental results, we have written a computational model which simulates the detection process in SiPM detectors. Using this model, we determine the conditions under which available models are accurate, and examine the limits imposed by their assumptions with regards to interpretation of experimental data.
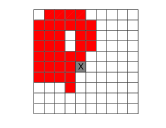
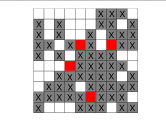
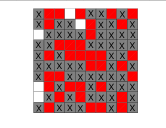
In the model, the detector is represented by a two-dimensional lattice where each cell represents an element of the detector. The impinging photons are distributed uniformly across the lattice. When a photon approaches a certain cell, the cell is triggered with some probability, , the detection efficiency. If triggered, each of the cell’s nearest neighbours can also be triggered with a probability , the optical crosstalk probability. These new triggered elements can continue to trigger their remaining nearest neighbours. This process continues until no new cells are triggered. The dead time of the detection elements in available SiPM detectors is longer than the photon propagation time between cells [24], so our model allows each element to only be triggered once in the process. The statistics were obtained on a lattice with 100 elements, which corresponds to a typical commercially available SiPM detector (Hamamatsu Photonics, S10362-11-100U [29]). Nevertheless, the conclusions can be inferred to other sized sampled by translating the absolute number of detections to the fraction of occupancy (20 photons in a 100 pixel detector are equivalent to 80 photons in a 400 pixel detector). The samples are not entirely scalable in size since the number of cells along the borders does not scale with the number of elements. However, simulations performed on different sized samples showed that this has little effect on the overall results in the range of the experimental parameters.
We begin our discussion with the optical crosstalk process. Figure 1 shows representative runs which portray the crosstalk evolution. The detector is initially triggered by detections of the impinging photons. These triggers initiate a crosstalk process which results in the triggering of additional cells. The number of crosstalk events shown in these examples was chosen so that it corresponds to the average number of CTs produced over multiple runs. As expected, the number of triggered cells increases with the crosstalk probability, . In figures 1b and 1d, we present an example of the effect the finite number of elements has on the number of generated CTs. Increasing the value of , beyond some critical limit, does not result in additional crosstalk triggers. The majority of cells attempt to trigger neighbouring cells which have already been triggered, and do not contribute to the evolution of the process.

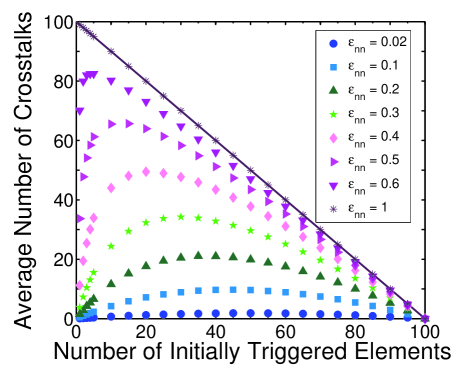
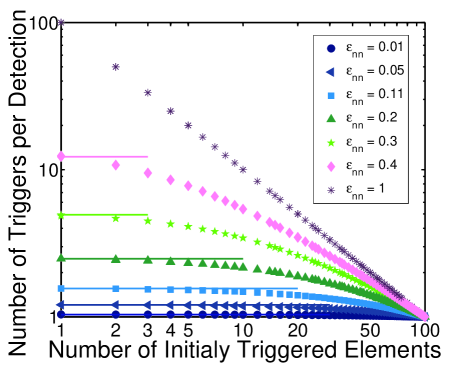
The limited number of cells can cause the number of crosstalk events to decrease rather than increase with the addition of more initial triggers. This result is shown in figure 2. When the average number of triggered elements is small, the number of CTs grows linearly with . As is increased, the effective number of neighbouring cells, which can also be triggered, is reduced as many of these neighbouring cells have already been triggered. As a result, the average number of crosstalk events deviates from linearity and starts decreasing after reaching some peak value. Notice that this effect, which is caused by the finite size of the detector, comes into play even at relatively low numbers of detected photons.
In order to identify the critical point where finite size effects begin to dominate the crosstalk process, we consider the average number of triggered elements generated by one initial trigger. In a detector of infinite size the crosstalk expansion is only suppressed by the probability for crosstalk. When the number of elements is limited, the progression is also suppressed due to overlaps with previously triggered cells. The average number of triggered elements should therefore be constant in the absence of finite size effects and should decrease when the finite size begins to impose a limitation. Figure 3 shows that for large crosstalk probabilities, the finite size imposes an immediate restriction, whereas the process expands rather freely when the crosstalk probability is below .
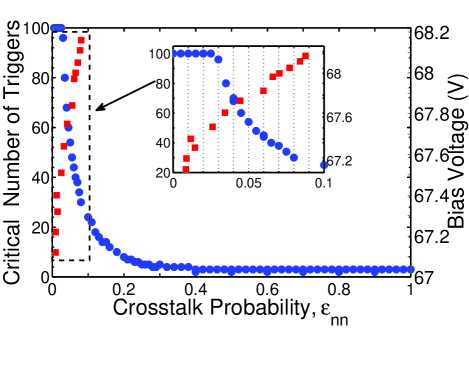
We define the critical number of initial triggers above which the size effects must be considered as the point where the average number of elements triggered by a single detection decreases by more than 10% compared to the unaffected value. In figure 4 we show this critical value as a function of the crosstalk probability, . The number of crosstalk-triggered cells increases with the value of , and the value of the critical value is therefore lower. Figure 4 also presents typical crosstalk values we experimentally measured for a range of bias voltages. The higher the bias voltage, the higher the gain and the crosstalk probability [24]. For the typical range of experimental values, the maximal number of detected photons for which finite size effects are not significant is in the range 20–100. These numbers are significantly higher than the number of photons observed in previously reported works [26, 27, 28, 30]. This explains why the modelling of the crosstalk effect without geometrical features of the detector was sufficient in these works.
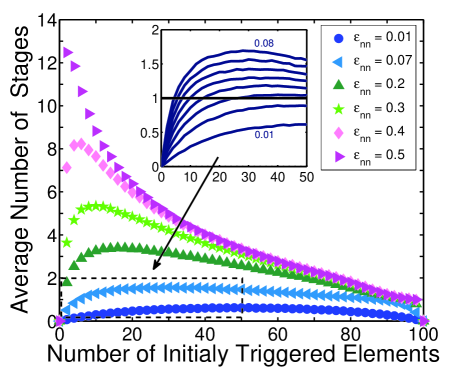
We turn now to evaluate the number of crosstalk stages involved in the process before it stops. The number of stages is an indication of the amount of cells triggered due to crosstalk generated by crosstalk events, and is an important factor in the modelling of the crosstalk process. The average number of CT stages is shown in figure 5. For small crosstalk probabilities only a small number of neighbouring elements is triggered due to crosstalk and the process ceases naturally after one stage even for large initial values of . For large values of , the number of crosstalks generated by other crosstalk events increases and we observe a rise in the number of stages. It is interesting to note that reference 26 had a CT probability equivalent to and used a one-stage crosstalk model. From figure 5, we can see that for this value of , the number of stages indeed does not exceed 1 even for photon numbers higher than what was detected in this work. On the other hand, we measured a CT value of and detected up to 14 photons. In this regime the number of stages exceeds 1. In fact, a simplistic 1-stage model would result in an error of over 20% in the evaluation of the number crosstalk events. The finite size effects are also apparent in this graph. Similar to the behaviour observed in figure 2, the number of crosstalk stages begins to decrease slowly after reaching some peak value.
We now consider the second effect which governs the behaviour of SiPM detectors, the inherent loss mechanism. Apart from the low detection efficiency, when two or more photons approach the same detection element, only one avalanche can be generated and the number-resolution is lost. This non-linear response of the detector, affects the detection probabilities. The average number of detected photons can be generally written as [29]
| (1) |
where is the number of impinging photons, is the detection efficiency and is the number of elements. In the limit , where finite size effects can be neglected, the expression reduces to the linear relation
| (2) |
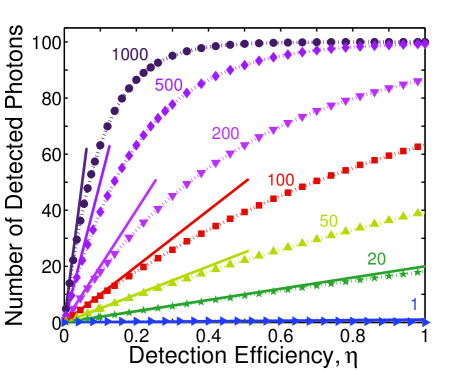
We use this relation to determine a critical condition below which the finite number of the detection elements do not affect the detection probabilities. In figure 6 we show the average number of detected photons as a function of the detection efficiency. We identify deviations of over 10% from a linear slope when the fraction of triggered elements, , exceeds 20%. Interestingly, the deviations from linearity depend on the detection efficiency and this behaviour may be used in order to obtain the absolute detection efficiency of the detector.
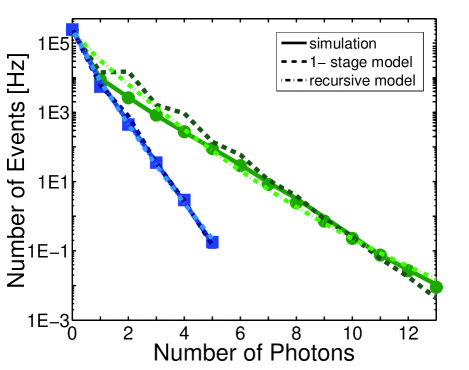
In order to demonstrate the use of our model for reconstructing the original photon statistics from measured data, we present in figure 7 thermal photon-number statistics measured using a SiPM detector. The measurements were conducted on a single polarization mode from a collinear type-II parametric down-conversion source [31] with a pulsed pump at a repetition rate of 250 kHz. The detector was operated using two different bias voltage values, which changed the crosstalk probability between the two measurements. The photon-number distribution which should appear as a straight line in a semi-log plot () experiences a change in slope due to the crosstalk effect. Zero photons cannot generate crosstalk, and thus the probability of zero photons is not affected. However, the probability of measuring two or more photons grows considerably due to crosstalks. We fit the experimental data to the photon-number statistics obtained by our computational model, the one-stage crosstalk model of reference 26 and the recursive model of reference 28. The crosstalk probability defined in previously presented models is defined as the overall probability that crosstalk will be generated, rather than the probability of triggering a specific neighbour. We associate this crosstalk value with our defined through the relation , four being the number of nearest neighbours in the square lattice. When the crosstalk effect is weak, all models fit the data. When the crosstalk effect is strong, the 1-stage model and the recursive model show large deviations from the data. An analytical model which provides a good description for all CT values is currently under work.
In conclusion, we have simulated the detection process in SiPM detectors and have shown that it is highly affected by the finite number of detection elements. These effects must be taken into account when the photon-number statistics of impinging photons is reconstructed. We have shown that simplistic modeling which does not account for the geometrical properties of the detection elements is applicable provided the number of detected photons is below some threshold which depends on the fraction of triggered elements and on the crosstalk probability. We have also shown the number of crosstalk stages which must be taken into account in order to properly model the crosstalk effect. Finally, we demonstrated the application of our computational model on experimental data.
References
References
- [1] Kok P, Lee H and Dowling J P 2002 Phys. Rev. A 65 052104
- [2] Lee H, Kok P, Cerf N J and Dowling J P 2002 Phys. Rev. A 65 030101
- [3] Gao Y, Anisimov P M, Wildfeuer C F, Luine J, Lee H and Dowling J P 2010 J. Opt. Soc. Am. B 27 A170–A174
- [4] Pittman T B, Jacobs B C and Franson J D 2002 Phys. Rev. Lett. 88 257902
- [5] Gisin N, Ribordy G, Tittel W and Zbinden H 2002 Rev. Mod. Phys. 74 145–195
- [6] Knill E, Laflamme R and Milburn G 2001 Nature 409 46
- [7] Okamoto R, O’Brien J L, Hofmann H F, Nagata T, Sasaki K and Takeuchi S 2009 Science 323 483–485
- [8] Franson J D, Donegan M M, Fitch M J, Jacobs B C and Pittman T B 2002 Phys. Rev. Lett. 89 137901
- [9] Waks E, Diamanti E, Sanders B C, Bartlett S D and Yamamoto Y 2004 Phys. Rev. Lett. 92 113602
- [10] Waks E, Sanders B C, Diamanti E and Yamamoto Y 2006 Phys. Rev. A 73 033814
- [11] Short R and Mandel L 1983 Phys. Rev. Lett. 51 384–387
- [12] Takeuchi S, Kim J, Yamamoto Y and Hogue H H 1999 Appl. Phys. Lett. 74 1063
- [13] Cabrera B, Clarke R M, Colling P, Miller A J, Nam S and Romani R W 1998 Appl. Phys. Lett. 73 735
- [14] Fujiwara M and Sasaki M 2006 Opt. Lett. 31 691–693
- [15] Hadfield R H, Stevens M J, Gruber S S, Miller A J, Schwall R E, Mirin R P and Nam S W 2005 Opt. Express 13 10846–10853
- [16] Rosenberg D, Lita A E, Miller A J and Nam S W 2005 Phys. Rev. A 71 061803
- [17] Dauler E, Kerman A, Robinson B, Yang J, Voronov B, Goltsman G, Hamiltom S A and Berggren K 2009 J. Mod. Opt. 56 365
- [18] Kardynal B E, Yuan Z and Shields A J 2008 Nat. Photonics 2 425
- [19] Kok P and Braunstein S L 2001 Phys. Rev. A 63 033812
- [20] Paul H, Törmä P, Kiss T and Jex I 1996 Phys. Rev. Lett. 76 2464–2467
- [21] Achilles D, Silberhorn C, Sliwa C, Banaszek K, Walmsley I A, Fitch M J, Jacobs B C, Pittman T B and Franson J D 2004 Journal of Modern Optics 51 1499–1515
- [22] Fitch M J, Jacobs B C, Pittman T B and Franson J D 2003 Phys. Rev. A 68 043814
- [23] Bondarenko G, Dolgoshein B, Golovin V, Ilyin A, Klanner R and Popova E 1998 Nucl. Phys. B. (Proc. Suppl) 61 347
- [24] Buzhan P, Dolgoshein B, Filatov L, Ilyin A, Kaplin V, Karakash A, Klemin S, Mirzoyan R, Otte A, Popova E, Sosnovtsev V and Teshima M 2006 Nucl. Instr. and Meth. A 567 78
- [25] Dolgoshein B, Balagura V, Buzhan P, Danilov M, Filatov L, Garutti E, Groll M, Ilyin A, Kantzerov V, Kaplin V, Karakssh A Kayumov F, Klemin S abd Korbel V, Meyer H, Mizuk R, Morgunov V, Novikov E, Pakhlov P, Popova E, Rusinov V, Sefkow F, Tarkovsky E and Tikhomirov I C C 2006 Nuc 563 368
- [26] Afek I, Natan A, Ambar O and Silberberg Y 2009 Phys. Rev. A 79 043830
- [27] Akiba M, Tsujino K, Sato K and Sasaki M 2009 Opt. Express 17 16885–16897
- [28] Eraerds P, Legré M, Rochas A, Zbinden H and Gisin N 2007 Opt. Express 15 14539–14549
- [29] URL http://www.hamamatsu.com
- [30] Kalashnikov D A, Tan S H, Chekhova M V and Krivitsky L A 2011 Opt. Express 19 9352–9363
- [31] Mandel L and Wolf E 1995 Optical Coherence and Quantum Optics (Cambridge University Press)