Structure and dynamics of reentrant nematics: Any open questions after almost 40 years?
Abstract
Liquid crystals have attracted enormous interest because of the variety of their phases and richness of their application. The interplay of general physical symmetries and specific molecular features generates a myriad of different phenomena. A surprising behavior of liquid crystals is the reentrancy of phases as temperature, pressure, or concentration are varied. Here, we review the main experimental facts and the different theoretical scenarios that have guided the understanding of bulk reentrant nematics. Recently, some computer simulations of a system confined to nanoscopic scales have found new dynamical features of the reentrant nematic phase. We discuss this prediction in relation with the available experimental evidence on reentrant nematics and with the dynamics of liquids in strongly confined environments.
I Introduction
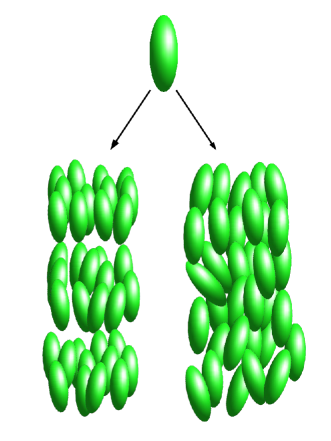
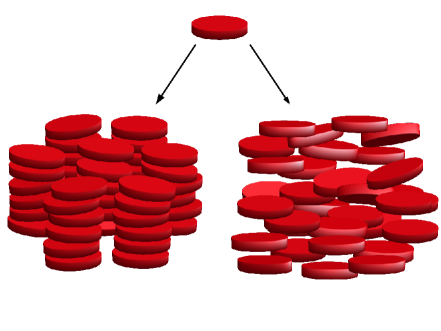
In 1888 the Austrian chemist and botanist Friedrich Reinitzer observed that the organic compound cholesteryl benzoate exhibits two melting points. He found that it first melts at C to a cloudy liquid, and then at C it becomes suddenly clear. Later, the pioneering studies of Lehmann Lehmann (1889), Schenk Schenk (1905), Vorländer Vorländer (1908) and Friedel Friedel (1922) recognized a new state of matter intermediate between liquid and solid. Liquid crystals (LC’s) were discovered. We now know a multitude of different liquid crystalline phases, roughly divided into two families. (i) Thermotropic LC’s undergo phase transitions as the temperature () is changed. (ii) Lyotropic LC’s exhibit different phases as the solvent concentration is changed. The most commonly encountered phases are nematic (N), where the system has a preferential orientation given by the nematic director , but the centers of mass have no long-range correlation (see the bottom right panel of Fig.1); smectic (S), where molecules organize in layers (see the bottom left panel of Fig.1); columnar, where two-dimensional order is established (see Fig.2); cholesteric, where the average orientation spirals with a fixed pitch as different planes are traversed, and blue phases, which consist of three-dimensional arrangements of cholesteric tubes.
Many different molecules form liquid crystalline phases, and their modern importance is difficult to exaggerate. Liquid crystal displays for electronic devices are ubiquitous. Because of the anisotropy of LC molecules and of their interactions, LC’s can easily polarize light passing through them. Highly versatile lasers can be made with LC systems, promising numerous applications Coles and Morris (2010). Liquid crystals are extremely important also for biology. Some examples (far from being comprehensive) are the following: The lipid bilayer of a cell membrane is a stable LC phase on which depends the very existence of cells; strands of DNA are also known to form LC’s Strzelecka et al. (1988); Nakata et al. (2007); spider’s silk has exceptional materials properties due to the particular LC organization of its proteins Vollrath and Knight (2001); finally, LC’s are ushering a technological revolution with multiple applications in biology and medicine as biosensors Woltman et al. (2007). Many extensive reviews of the state of the art of LC crystals exist, see for example Goodby et al. (2008) for modern applications of LC in self-assembling supramolecular structures.
Among the interesting features of LC’s that make them so versatile there is a surprising sequence of phase transitions of rod-like molecules that still poses challenges to both experimental and theoretical studies. The typical sequence of LC phases encountered starts at high with an isotropic (I) phase, where the system is characterized by complete translational and orientational invariance. As decreases a preferential molecular orientation emerges – the nematic director – breaking the rotational symmetry. At even lower , S layers appear indicating that now translational invariance is broken, too.
Surprisingly, in 1975 Cladis discovered Cladis (1975) that when two compounds, whose molecules have two benzene rings and a strongly polar cyano group, were mixed together, a N phase formed at above the S phase (which is usual), but also at below the S phase (which is surprising). The N phase at lower was termed reentrant nematic (RN). The presence of a RN phase is surprising because in the vast majority of cases as is lowered the symmetry of the stable thermodynamic phase decreases, i.e. the state of the system is invariant under a decreasing number of symmetry operations, eventually becoming a crystalline solid.
After the seminal work of Cladis Cladis (1975), other systems in a variety of different conditions were found to have a RN phase. Today, RN behavior is a well-established phenomenon. Here, we focus on the past and present understanding of RN, with special attention to the dynamics of RN phases.
Naturally, nearly 40 years after Cladis’ discovery of the RN phase one may wonder: Is there still something to be understood about these phases? It is the primary purpose of this article to demonstrate that it is indeed so. For exmaple, recent numerical investigations on the dynamics of LC’s confined in nanoscopic pores suggest some interesting dynamics features. In particular, it was found Mazza et al. (2010, 2011) that diffusivity in the direction of the molecular long axis is greatly enhanced. This appears to be an analogous situation to the levitation effect in zeolites and carbon nanotubes Derouane et al. (1987); Yashonath and Santikary (1994). There is some favorable experimental evidence Ratna et al. (1981) supporting the theoretical predictions of enhanced parallel diffusivity Mazza et al. (2010, 2011). However, the question is not yet settled. Our critical review of the available experimental work on RN dynamics reveals that numerous controversies are not yet resolved. A main problem identified here is that reentrancy is not caused by a single microscopic mechanism, but rather by many. Their identification is still an open question. Consequently, the investigations of the dynamical behavior of RN’s are often divergent.
The remainder of this Review is organized as follows: in Sec. II we review the seminal experiments that discovered RN phases in both polar and nonpolar substances. In Sec. III we discuss the main experimental investigations on the nature and properties of RN’s, while in Sec. IV we review the different theories and scenarios put forward to rationalize RN existence and features. In Sec. V we review the more recent computational studies of RN’s, and, finally, Sec. VI lists our conclusions.
II History
The first experimental detection of RN in a LC is reported by Cladis Cladis (1975). There, an amount of hexyloxybenzilidene amino benzonitrile (HBAB) was mixed with cyanobenzilidene butylaniline (CBOOA). Individually, the former has a N phase for , and the latter has a SA phase for and a N phase for . When mixed together, as is lowered a sequence of I, N, SA, and RN is found for a range of molar fractions ; the curve bounding the SA phase in the plane can be approximately fitted with a parabola
| (1) |
where , , , and is the N-SA transition Cladis (1975). The measurements of the bend elastic constant Cladis (1975) constitutes the first examination of possible structural differences between the N and RN phases. In this early experiment it was shown that the elastic constant has a very similar -behavior as the SA phase is approached from above or below Cladis (1975). Cladis Cladis (1975) emphasized that CBOOA has an incommensurate SA phase, that is, the spacing between S layers is not an integral multiple of the molecular length. A possible way to understand how an incommensurate spacing can arise is to imagine a S layer composed of dimers. Because of the strong polar character of cyano compounds molecules naturally tend to form dimers to minimize the interaction energy; these dimers in turn organize themselves in S layers, or, in other words, each S layer is in reality a double layer of molecules. This initial observation is consistent with other experiments Figueirinhas et al. (1992) and has proven itself fruitful in the understanding of the structure of RN phases.
Following the assumption of the double-layer nature of the SA phase a series of pure compounds and some mixtures were studied Cladis et al. (1977). Upon increasing pressure, RN phases were found in the supercooled region of polar substances such as 4-cyano-4’-octyloxy biphenyl (COOB) or CBOOA. What these substances have in common is the amphiphilic nature of their molecules. Unlike most LC’s the polar part (the aromatic rings) is not in the middle of the chains, but rather at one end. The polar cyano group has a dipole moment of D. The nonpolar part (aliphatic chain) forms the opposite end of the amphiphile. This structure will naturally favor a certain degree of dimerization, since the polar groups will preferentially interact with each other through long-range forces, and the nonpolar tails through short-range forces. Cladis et al. Cladis et al. (1977) proposed that it is the short-range interaction between nonpolar tails what stabilizes the S layers. This hypothesis is successfully tested by measuring the dependence of the maximum stability pressure of the SA on the number of carbon atoms in the nonpolar tails. It is found that increases linearly as the number of methylene groups increases. It is argued Cladis et al. (1977, 1978) that as pressure increases (or equivalently as decreases) the interaction between the polar groups becomes repulsive, and at the same time the nonpolar tails are somewhat compressed, lowering the energy barrier to permeation through the S layers. Both effects lead to a destabilization of the S order, and hence to the formation of a RN.
After 1979, the occurrence of RN could not be dismissed as a peculiarity of few molecules, since a stable RN at atmospheric pressure was found for molecules exhibiting three benzene rings, and, importantly, not in mixtures but in pure compounds Hardouin et al. (1979); Huu Tinh and Gasparoux (1979); Sigaud et al. (1981). Additionally, reentrant smectic phases were also found Hardouin et al. (1979); Huu Tinh (1983). In the following years different groups found many different systems exhibiting RN phases (see, e.g., the work of Sigaud et al. Sigaud et al. (1981) and references therein), and also multiple reentrant phases Huu Tinh et al. (1982, 1984). It has been speculated that quadruple reentrance is possible if compounds with four or five benzene rings are employed Indekeu and Berker (1986). Cladis’s own account of the discovery and thermodynamic understanding of RN phases provides many more details Cladis (1988).
Until 1983 it was believed that only molecules with a strong polar group showed a reentrant behavior. However, Diele et al. showed the existence of RN phases in terminal-nonpolar substances Diele et al. (1983); Pelzl et al. (1986). Importantly, their X-ray measurements showed that the thickness of the S layers is equal to the average molecular length. Hence, dimerization cannot take place in these nonpolar compounds and the occurrence of a RN phase must have a different physical origin Diele et al. (1983); Pelzl et al. (1986) (see Sec. IV for the theories applicable to nonpolar systems).
A question naturally arising is whether RN and N phases are different. One can consider two aspects: structure and dynamics. In the following we explore the experimental evidence addressing this question. We can, however, anticipate that, since pure compounds and mixtures, polar and nonpolar molecules all exhibit RN phases, the picture emerging will be rather complex and diverse.
III Experimental investigations
Structural differences of the N and RN phases were investigated with X-ray scattering Guillon et al. (1978) for mixtures of N-(p-hexyloxybenzylidene)-p-aminobenzonitrile (HBAB) and N-p-cyanobenzylidene-p-n-octyloxyaniline. No qualitative difference was found between the N and RN phases, i.e. the Bragg peak indicating the layer thickness appears always in the range Å; however, for some mixtures the RN was found to coexist with microcrystallites. Guillon et al. concluded that these crystalline fluctuations share the same structural properties and are energetically similar to the RN phase Guillon et al. (1978).
Nuclear magnetic resonance (NMR) offers a number of techniques to investigate both structure and dynamics. The first NMR study of a pure LC system with a RN phase was carried out by Miyajima et al. Miyajima et al. (1984). For pure 4-(-octyloxybenzoloxy)-benzylidene--cyanoaniline (OBBC) they found a smooth continuous increase in the orientational order parameter across the N, SA, and RN phases. However, when studying a binary mixture with a spin-probe impurity probe they found a steep increase of the nematic order parameter in the RN phase. While proton NMR is sensitive to the aromatic core, the impurity probe method is not. Therefore, the conflicting results in the orientational order parameter can be ascribed to the different techniques. From the behavior of the spin-lattice relaxation time measured at MHz for OBBC Miyajima et al. conclude that translational self-diffusion plays a dominant role in relaxation in the RN phase (with a characteristic Arrhenius -dependence), while the N phase behavior is dominated by nematic director fluctuations.
However, for a LC mixture Dong reached the opposite conclusion that self-diffusion appears to be the relevant relaxation mechanism in the N phase, while nematic director fluctuations dominate the RN phase Dong (1981a, b, 1982). Using proton NMR he studied the dependence of for a LC binary mixture Dong (1981a, b) and found an Arrhenius behavior in the N phase, and no -dependence in the RN phase within experimental error; that director fluctuations dominate the relaxation of the RN phase is further corroborated by the linear relationship between and where is the angular frequency, as predicted by the theory of spin relaxation through a director-fluctuation mechanism Dong (1982).
We cannot avoid stressing at this point something that has not been clearly stated in previous works. Although reentrancy is found in many different substances, their dynamics need not be the same. Specifically, pure compounds and mixtures do not necessarily have to exhibit the same dynamical properties. Even though there are discrepancies in the experimental results, we can safely conclude that the dynamics of N and RN are markedly different.
A somewhat intermediate situation is described by Sebastião et al. Sebastião et al. (1995) who performed proton NMR experiments on a polar LC compound which exhibits N, partial bilayer S, RN, and reentrant SA phases. Self-diffusion is shown to contribute little to in the N and RN phase. Instead, fluctuations of the director and reorientations are the main dynamical processes contributing to . Interestingly, however, the ratio between the translational self-diffusion parallel and perpendicular to the director is slightly higher in the RN phase than in the N phase Sebastião et al. (1995). Those results Sebastião et al. (1995) are consistent with a dynamical process of association and dissociation of molecular groups, which are important in the double-layer S and N phases.
By using 129Xe NMR Bharatan and Bowers Bharatam and Bowers (1999) studied two LC mixtures and found that (and also the spin-spin relaxation time ) shows Arrhenius behavior in both N and RN phases. The activation energies extracted from the data do not behave in a similar fashion for the two systems studied. For a binary mixture, the activation energy in the RN is more than two times the value in the N phase, whereas for a ternary mixture, there is almost no difference in the activation energies. The increase in activation energy for the first LC mixture is ascribed to changes in the molecular packing in the RN phase Bharatam and Bowers (1999).
Although a number of other studies were carried out on mixtures and pure compounds with a RN phase Dong et al. (1987); Shen and Dong (1998); Dong et al. (2000) using deuteron NMR little can be said about translational self-diffusion, because this technique is sensitive to other types of motion, e.g. intramolecular rotations, reorientational dynamics, or supramolecular motion, such as order director fluctuations. The picture arising from the work of Dong and collaborators is one of very subtle changes between the phases, and especially between N and RN phases.
The structure of RN’s also poses some unanswered questions. For example, is there a change in nematic order parameter at the transition from S to RN? The work of Vaz et al. Vaz et al. (1983) shows that increases upon entering the RN. They measured the -dependence of in a LC binary mixture with deuterium NMR and found that at the SA-RN transition displays a sharp increase in slope Vaz et al. (1983). To rationalize this behavior they considered an expansion of the free energy difference between the N, S and I phase in terms of and a smectic order parameter , that to leading order is
| (2) |
where , , and are the I-N and the N to SA transition , respectively, and all the constants are positive except . This expansion of produces a first order I to N phase transition, and a second order N to SA transition. Following Cladis Cladis (1981), they assumed a quadratic coupling of the order parameters proportional to to describe the RN phase and derived that upon entering the RN from the SA phase the nematic order parameter should be positively perturbed () such that the phenomenological description is in agreement with the experiments Vaz et al. (1983).
However, using deuterium NMR on a binary mixture, Emsley et al. Emsley et al. (1985) found only subtle changes in the order parameters at the SA-RN phase transition. Contrasting results are also presented by Dong et al. Dong et al. (1985), where deuterium NMR experiments showed no enhanced orientational order in the RN phase, in contradiction with both a Landau free energy expansion theory and a McMillan theory of RN’s.
Electron spin resonance experiments on the LC mixture of hexyloxy biphenyl (6OCB) and octyloxy biphenyl (8OCB) found no dramatic structural changes at the SA-RN transition using a number of different spin probe molecules and similar dynamics of the probes in reentrant and nonreentrant LC Nayeem and Freed (1989). Nayeem and Freed also concluded, contrary to Dong et al. Dong et al. (1987), that their results are “not consistent with saturation in pair formation being a necessary precursor to reentrance” Nayeem and Freed (1989). The differences in these experimental results can be ascribed to different experimental techniques sensitive to a different extent to the orientational degrees of freedom of the aromatic cores or of the molecular chains. Nonetheless, the question still lingers: What is the behavior of the nematic order across the S-RN phase transition?
A very different experimental approach was adopted by Ratna et al. Ratna et al. (1981) who measured the electrical conductivity in the direction parallel () and perpendicular () to the optic axis, which in the orientationally ordered phases coincides with the nematic director. They studied the pure compound 4-cyanophenyl--methyl-4(-n-dodecylbenzoyloxy)benzoate (12 CPMBB) and the mixture 6OCB/8OCB. For the single component system they found a remarkable increase of the ratio as the system approaches the RN-SA transition temperature . At the lowest studied for the pure compound (C below ) is approximately equal to . For the mixture 6OCB/8OCB, they found the same qualitative increase of the ratio , but at the lowest studied in the RN phase the value of this ratio was only Ratna et al. (1981). Although the results for the mixture would require additional analysis, what was found for the pure compound is strong evidence supporting a scenario of increased mass transport in the RN phase.
Another insight into the differences between N and RN phases comes from the work of Nozaki et al. Nozaki et al. (1992) who found that for the mixture 6OCB/8OCB the rotations around the short molecular axis are greatly hindered in the RN phase with respect to the N phase. Specifically, by measuring the -dependence of the complex permittivity with time-domain reflectometry, they found a higher value of the activation energy in the RN compared with the N phase.
There are limited modern investigations of the RN state. Yethiraj et al. measured proton NMR spectra of solutes dispersed in a mixture of 6OCB/8OCB to determine the smectic and nematic order parameters in the Kobayashi-McMillan theory Yethiraj et al. (2007). Das and Prasad Das and Prasad (2011) measured the rotational viscosity of a LC binary mixture and found similar values in the N and RN phases. However, there are strongly contrasting results Bhattacharya and Letcher (1980); Dong (1981b) suggesting that the rotational viscosity of RN may be two or three orders of magnitude higher than in the N phase.
Finally, hydrodynamic flow in RN’s has received some attention. Bhattacharya and Letcher measured capillary shear flow for a ternary mixture with a RN phase. They found that the N and RN phases have identical flow properties, and the hydrodynamic theory of N phases can be applied to RN phases Bhattacharya and Letcher (1980). Also, Jadżyn and Czechowski Jadżyn and Czechowski (2007) measured the viscosity for the well studied mixture 6OCB and 8OCB, and found a distinct decrease of viscosity upon entering the RN phase.
IV Theoretical scenarios for reentrancy
The experimental findings discussed in Sec. III well illustrate the complexity of RN phases. It is therefore not surprising that a similar rich picture also emerges from theoretical studies. Prost and Barois derived a Landau theory of LC exhibiting reentrancy from general considerations of symmetry and on the basis of the relevant length scales involved Prost and Barois (1983); Prost (1984). In a S phase a density modulation appears. On average the molecular centers lie on parallel planes. Thus, it is natural to consider the expansion of the density in a Fourier series
| (3) |
where the wave-vector , is the layer thickness, and is the director. However, polar substances and mixtures exhibiting RN phases show two incommensurate periodicities in X-ray scattering experiments, i.e. one periodicity equal to the molecular length , and a second one that is not an integer multiple of the first, typically – . It is necessary to introduce the total dipole moment to describe a system of polar molecules
| (4) |
where is the dipole moment of molecule . A potential can be derived from that may be used as a second order parameter
| (5) |
With these two order parameters, and , a Landau-Ginzburg free energy functional can be written as
| (6) |
From the competition between the different length scales contained in Eq. (6), Prost and collaborators Prost and Barois (1983); Prost (1984) obtained a phase diagram with different S and also RN phases.
The first microscopic theory of the physical origin of RN phases was elaborated by Berker and Walker in 1981 Berker and Walker (1981). They started from the observation that most reentrant nematogens are composed of molecules with a strong polar group at one end and an attached aliphatic chain forming the other end of the molecule. The dipolar interaction is assumed to be antiferroelectric. Considering a plane normal to the nematic director, antiferroelectric long-range order cannot be established in a periodic regular arrangement of molecules. However, Berker and Walker argued that in a liquid molecules can relax their positional degrees of freedom and configurations of triplets with two short antiferroelectric bonds and one unfavorable ferroelectric, but longer bond will be possible. In this way frustration is avoided and the system can condense to a liquid of dimers forming a two-dimensional network. Hence, a bilayer S phase forms. As is lowered positional order arises that leads to increasing frustration and to the breaking of the dimers. As a consequence a nematic phase appears again. The interaction of two dipoles and separated by a distance is described by the potential
| (7) |
where . For the interaction is antiferroelectric, whereas for it is purely dipolar, and for the interaction becomes ferroelectric. By integrating out the positional degrees of freedom and distinguishing different degrees of interaction, Berker and Walker mapped the initial system onto an Ising model with annealed bond disorder. The phase diagram obtained Berker and Walker (1981) shows a RN phase for a range of model parameters and also a doubly reentrant phase sequence. Berker et al. Indekeu and Berker (1986, 1986) extended their theory to describe multiple reentrant behavior, considering partial bilayer (SAd) and monolayer (SA1) smectic phases, i.e. N–SAd–N–SAd–N–SA1, which was found experimentally in at least one pure substance and its mixture Huu Tinh et al. (1982) and SC phases Netz and Berker (1992). The scenario of frustrated dipolar interaction Indekeu and Berker (1986, 1986) (commonly referred to as “spin-gas theory”) has played a major role in understanding different instances of reentrancy in LC Cladis (1988). An implication of the scenario described above is that the N-SA transition is different from the SA-RN transition. This is at odds with some experiments that show very subtle or no structural difference between the nematic phases for LC mixtures Nayeem and Freed (1989); Kortan et al. (1981) and a pure compound Guillon et al. .
A different approach to a microscopic theory for reentrancy in nematogens was proposed by Longa and de Jeu Longa and de Jeu (1982): Pairs of molecules with antiparallel dipoles associate to form dimers in dynamical equilibrium with monomers. As is decreased the fraction of dimers in the LC system increases and dipolar dispersive forces between the dimers lead to the formation of a SA phase. It is important to note that monomers under these conditions help stabilizing the SA phase because monomers can fill the voids left by the bulkier dimers. However, as the dimer fraction increases it becomes increasingly difficult to pack them without perturbing the S layers. It is instead, as Longa and de Jeu argue Longa and de Jeu (1982), entropically more favorable to disrupt the S layering by forming a RN phase. By extending McMillan’s theory of the N–SA transition McMillan (1971), Longa and de Jeu used a mean-field approach to solve for the one-particle distribution functions of monomers and dimers. Although Berker and collaborators Berker and Walker (1981); Indekeu and Berker (1986, 1986); Netz and Berker (1992) too considered dipolar interactions to be fundamental, they viewed the S phase as a percolating network of antiparallel pairs where frustration is avoided only because of liquid positional disorder. In our view, contrary to the conclusions of Figueirinhas et al. Figueirinhas et al. (1992), it is difficult to exclude either theory in favor of the other, because the fundamental experimental predictions of the spin-gas theory, and of the McMillan-like theory are quite similar: They both predict a roughly -independent value for the smectic layer thickness and antiparallel associated pairs.
It is worth mentioning other approaches to explain reentrancy in LC. For example, Luckhurst and Timini Luckhurst and Timini (1981) found a N SA RN phase sequence upon decreasing . They only assumed a linear dependence of the parameter that in the original McMillan theory McMillan (1971) is empirically related to the length of the molecular alkyl chain. In practice, as decreases with decreasing , the particles described by the theory turn from dimers to monomers. Ferrarini et al. Ferrarini et al. (1996) showed that reentrant phases can also be recovered by considering chemical reactions of isomerization and dimer formation under reasonable conditions.
All the models and theories discussed above refer to polar molecules. It it natural that most theoretical work has focused on this class of LC’s, because experimentally reentrancy is predominantly found in LC molecules with strong dipolar groups (typically cyano). However, RN phases have also been observed in nonpolar substances Diele et al. (1983); Pelzl et al. (1986). Dowell Dowell (1987) devised a lattice theory for a single component system that focuses on molecular chain flexibility. In Dowell’s model the S phase is formed because of segregated packing of cores and tails. As is lowered, however, the molecular chains become increasingly more stiff, destabilizing the S layers. Eventually, it becomes entropically more favorable to disrupt S layering such that a RN phase is formed. X-ray Kortan et al. (1981) and ESR Nayeem and Freed (1989) experiments support Dowell’s scenario of reentrancy in systems that do not show signs of dimerization Diele et al. (1983); Pelzl et al. (1986). Bose et al. Bose et al. (1991) extended McMillan’s theory to include chain flexibility and also obtained a RN for a single component nonpolar system.
V Computer Simulations
In modern times vast possibilities of theoretical investigation have been ushered by the growth of computational power and the sophistication of simulation algorithms. More and more complex fluids and microscopic structures can now be simulated Gubbins and Moore (2010). Computer simulations were first applied to the study of RN’s by Netz and Berker Netz and Berker (1992). They solved numerically the lattice spin-gas model introduced in Sec. IV with Monte Carlo (MC) calculations. The first off-lattice MC simulations were performed only in 2005 by de Miguel and Martín del Río de Miguel and Martín del Río (2005). They considered a single-site molecular model for mesogens, where molecules are represented by parallel hard-core ellipsoids with a spherically symmetric square well potential (around each molecular long axis). In that study a RN phase and two tricritical points are found, one located on the N-SA transition line and the second one on the SA-RN transition line. In this simple model, the presence of a RN in a nonpolar LC is rationalized in terms of entropy. In the SA phase the energy is minimized and within the fluid state no further decrease is possible. However, the free energy can still be minimized by an increase in entropy. Thus, the loss of positional order is entropically driven de Miguel and Martín del Río (2005).
Though the system of parallel hard-core ellipsoids de Miguel and Martín del Río (2005) offers a clear picture of the origin of reentrancy in nematics, it has the shortcoming of neglecting rotational dynamics altogether, because the molecular long axes point in the same fixed direction. Suppressing orientational dynamics leaves open the question of whether the RN in such simple models is robust against orientational fluctuations.
V.1 Confined Mesogens
Confined fluids have become an extremely active field of research in recent years Schoen and Klapp (2007); Schoen and Günther (2010); Schoen (2008). Novel phenomena take place in liquids confined to narrow spaces, e.g. wetting, layering and many others induced by the interaction with the confining surface. The interplay of these new phenomena with the physics of bulk fluids gives the possibility of both testing our understanding of molecular mechanisms, and devise concrete applications not otherwise feasible. In fact, applications of confined fluids range from nanotechnology to biomedical devices. It is therefore natural that LC properties and phase transitions come under a new scrutiny. Furthermore, nanoconfinement is a physically sensible (and realistic) way of inducing ordering fields into the fluid system.
Below, we review computer simulations of a pure LC system confined between walls separated by a nanoscopic distance (few tens of molecular diameters) performed by the present authors and their colleagues Mazza et al. (2010, 2011). These are the first simulations to fully take into account a three dimensional fluid with rotational degrees of freedom.
V.1.1 Model
Because the focus is on the dynamical behavior of the LC’s, molecular dynamics (MD) was employed. Specifically, we Mazza et al. (2010, 2011) adopted the Gay-Berne-Kihara (GBK) model for prolate mesogens Martínez-Haya et al. (2004). The GBK model potential conveniently takes into account both the anisotropy of mesogen interaction and the spherocylindrical molecular shape not which is considered to approximate prolate mesogens better than ellipsoids Martínez-Haya et al. (2004).
In the GBK model the interaction between a pair of spherocylinders and depends on the molecular orientations represented by the unit vectors and , respectively and their distance . Specifically
| (8) |
where , , and the function is the minimum distance between that pair of molecules Vega and Lago (1994). The orientation-dependent interaction strength in Eq. (8) is given by
| (9) | |||||
where the parameters and are given by
| (10a) | |||||
| (10b) | |||||
In these last two expressions parameters ( in units of ), and represents the interaction strength for a side-side relative to an end-end configuration of a pair of spherocylinders.
We consider a LC system confined along the direction by two planar, structureless walls. We model the fluid-substrate interaction via
| (11) |
where the parameter is the strength of fluid-substrate interaction and is the areal density of the substrate where is the lattice constant of a single layer of atoms arranged according to the () plane of the face-centered cubic lattice Mazza et al. (2010). The diameter of these substrate atoms is taken to be the same as the diameter of a spherocylinder of the confined fluid phase.
As already mentioned, a solid substrate is also a physically realistic way of inducing an ordering field in a LC system. A number of experimental techniques were devised to realize specific substrate features, and especially anchoring. Some example are rubbing, polishing, exposing to photolithographic relief, or evaporation of oxide films Sonin (1995). In Eq. (11), is the so-called “anchoring function”. It allows one to discriminate energetically different orientations of a molecule with respect to the substrate plane. We employed degenerate planar anchoring Jérôme (1991)
| (12) |
where () is a unit vector pointing along the -axis of a space-fixed Cartesian coordinate system. Hence, any molecular arrangement parallel with the substrate plane is energetically favored, whereas a homeotropic alignment of a molecule () receives an energy penalty by “switching off” the fluid-substrate attraction altogether.
The MD simulations were carried out using a velocity-Verlet algorithm for linear molecules Ilnytskyi and Wilson (2002). After equilibrating the system to the chosen pressure and , the fluid system is simulated in the microcanonical ensemble to obtain information on its dynamics Mazza et al. (2011). We simulated systems containing up to molecules. Quantities of interest will be expressed in the customary dimensionless (i.e., “reduced”) units. For example, length will be expressed in units of , energy in units of , temperature in units of , time in units of using , and pressure in units of where is related to diagonal components of the pressure tensor acting in the – plane.
V.1.2 Results
To characterize the structure of N, SA, and RN phases a suitable order parameter is the so-called alignment tensor defined as de Gennes (1971); Pardowitz and Hess (1980)
| (13) |
where “” denotes the direct (i.e., dyadic) product and is the unit tensor. Hence, is a real, symmetric, and traceless second-rank tensor which can be represented by a matrix. Its largest eigenvalue is commonly used as the N order parameter .
To characterize the layering of the fluid in the direction of characteristic of S phases a suitable order parameter is given by the leading coefficient of the Fourier series of the local density
| (14) |
where is the spacing between adjacent SA layers. From Eq. (14) it is also apparent that , where , and in ideal N and SA phases, respectively.
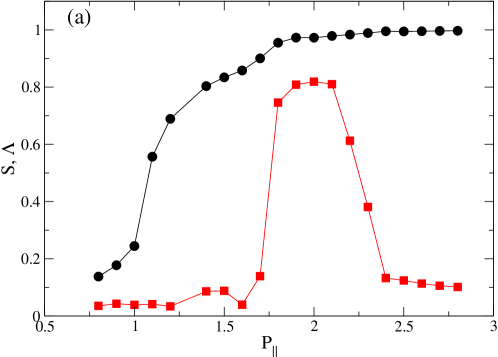
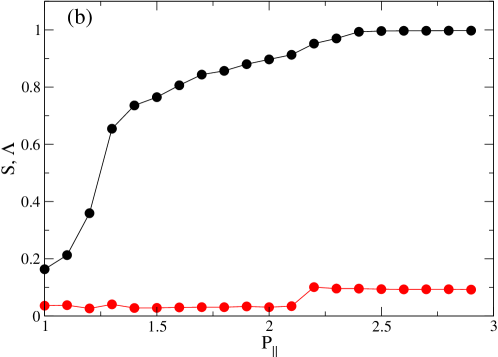
Plots of the dependence of and on are presented in Fig. 3 for and . Both and are small at low pressures characteristic of the I phase. Here we adopt a value as a heuristic threshold for the N phase Maier and Saupe (1959, 1960). From Fig. 3 it therefore appears that the N phase forms somewhere above () and (), respectively.
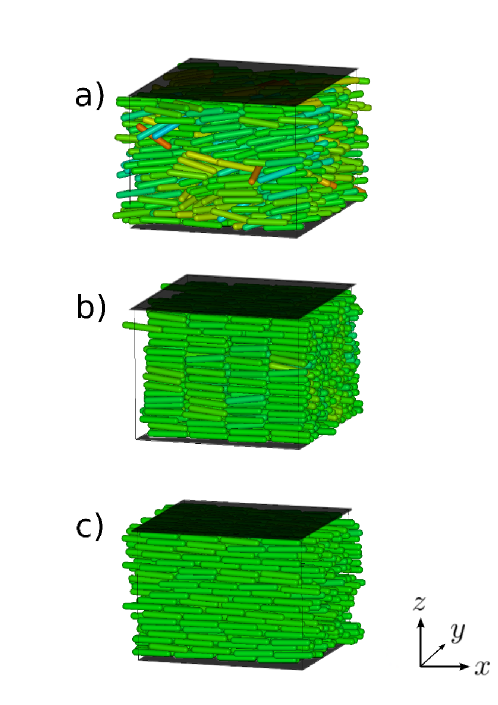
At there is a clear sign of a RN phase as increases and reaches a maximum value and then drops to small values for ; thus, a sequence of phases I-N-SA-RN is found at as increases. At , never rises above the residual value of about . Hence, the SA phase does not form at this . Nevertheless, we notice a small, step-like increase at in the plot of . At this and all larger pressures considered the nematic order is high and increases even further reflected by a monotonic increase of toward its limiting value . For the confined fluid exhibits structural features of the RN phase (see Mazza et al. (2011)). Three characteristic snapshots of the system are shown in Fig. 4. The increasing orientational order of the system as increases is apparent. Incidentally, we note that the seemingly value in the RN phase is a finite-size effect, as was demonstrated by Eppenga and Frenkel Eppenga and Frenkel (1984).
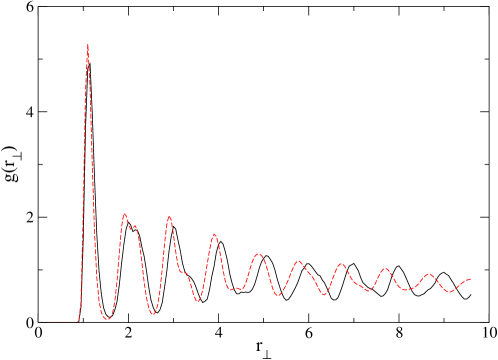
A question naturally arises: What is the relation between the RN phase found in this simulated confined fluid and the bulk RNs? Our simulations show that the phase diagram of the confined system is qualitative similar to phase diagram of the bulk fluid. The only change induced by the confining surfaces is to lower the pressure of the phase transitions with respect to the bulk system. This shift in the phase diagram is a well-documented confinement effect. Here, we consider spatial correlations between the centers of mass of molecules in the direction perpendicular to the orientation of a reference molecule, where . The perpendicular radial distribution function is the probability to find a molecule at distance from a reference molecule. In Fig. 5 we compare for a bulk and a confined system in the RN phase. It is apparent that the maxima of for the confined system are shifted to lower values of with respect to the bulk case. This shift reflects the substrate-assisted efficient packing of molecules and therefore explains the shift of the SA-RN transition to lower than in the bulk. However, the structure of the confined and bulk RN phases are very similar.
Next, we address the important question of dynamics in the RN phase. To this end, we considered a specialized mean square displacement (MSD) to calculate displacements of molecules in the direction of their long axes. Specifically, we define and the associated MSD in the direction of the molecular long axes
| (15) |
From Eq. 15 a diffusion coefficient can be extracted using an Einstein relation, namely
| (16) |


Figure 6 shows a dramatic increase of as one enters the RN phase whereas lower-pressure (I, N, or SA) phases exhibit rather small self-diffusivity. In particular, the SA phase is characterized by nearly vanishing self-diffusion constants which can be rationalized as above where we argued that the relatively compact layered structure makes it difficult for molecules to diffuse out of their original layer and penetrate into a neighboring one. The dramatic increase in mass transport in the direction of in combination with nearly perfect nematic order prompted us to refer to liquid crystals in the RN phase as “supernematics” Mazza et al. (2010).
There are, in fact, experimental observations that are consistent with our simulations. For example, by extracting longitudinal relaxation rates from data of Miyajima et al. Miyajima et al. (1984), one finds that in the RN phase these relaxation rates are considerably lower than those characteristic of the N phase. At the same , relaxation rates can be converted into correlation times that are significantly shorter in the RN as opposed to the N phase. However, this remains speculative, until experiments prove that translation diffusion is the main relaxation mechanism at this . Stronger evidence is found in the conductivity experiments performed by Ratna Ratna et al. (1981) (see Sec. III).
One may ask: Why is the diffusivity so large in the direction of the long molecular axis? As interesting analogy Mazza et al. (2011) can be drawn with the case of diffusion in systems such as zeolites or single-wall carbon nanotubes. When the diameter of a diffusing particle matches the size of the confining nanochannel then the diffusivity increases markedly. This effect is known as “levitation” Derouane et al. (1987); Yashonath and Santikary (1994). In our case, the high degree of orientational order in the RN phase causes a molecule to be trapped within the “cage” formed by its first-neighbors which, because of the prolate geometry, is effectively a narrow channel. Furthermore, the attractive intermolecular forces are overcome because the fluid is in a dense state (either low or high pressure). Thus, within this channel a molecule fits the condition of the levitation effect.
VI Conclusions
In this work, we have reviewed experimental and theoretical investigations of structural and dynamical properties of RN phases. It is surprising that after almost years of research many details of RN phases are still escaping a comprehensive understanding. The main difficulty is the variety of substances exhibiting RN’s. Pure substances and mixtures alike have been found with a RN in their phase diagrams. Polar and nonpolar molecules exhibit reentrancy alike. It is clear to the present authors that more experiments are necessary to settle some important, yet still open questions. For example: (i) How does the nematic order change upon crossing the SA-RN transition? (ii) Is frustration really the mechanism underlying the reentrant behavior in LC’s with a bilayer S phase? (iii) Experimentally, what is the mechanism driving reentrancy in LC’s that do not form dimers? (iv) Do RN phases of single-component, nonpolar molecules really exhibit the huge self-diffusivity in the direction of predicted by our simulations Mazza et al. (2010, 2011)?
Regarding the dynamical behavior, it is at present safe to assume that though many LC systems have a RN phase, their dynamics need not be alike in any respect. The reason is that different microscopic mechanisms may be responsible for reentrancy in different LC systems depending on the details of the intermolecular interaction potential. At the time of writing some experimental evidence exists Ratna et al. (1981) suggesting that last question may indeed have a positive answer. Moreover, our findings Mazza et al. (2010, 2011) seem consistent with an extrapolation of longitudinal relaxation rates of NMR experiments Miyajima et al. (1984).
Acknowledgments
We thank M. Greschek (Technische Universität Berlin), J. Kärger (Universität Leipzig) and R. Valiullin (Universität Leipzig) for helpful discussions. Financial support by the German Research Foundation (DFG) within the framework of the “International Graduate Research Training Group” 1524 is gratefully acknowledged.
References
- Lehmann (1889) Lehmann, O. Über fliessende Krystalle. Z. Phys. Chem. 1889, 4, 462–472.
- Schenk (1905) Schenk, R. Kristallinische Flüssigkeiten und Flüssige Kristalle; Engelmann: Leipzig, Germany, 1905.
- Vorländer (1908) Vorländer, D. Kristallinische Flüssige Substanzen; Enke: Stuttgart, Germany, 1908.
- Friedel (1922) Friedel, G. Les états mésomorphes de la matière. Ann. Phys. 1922, 18, 273–274.
- Coles and Morris (2010) Coles, H.; Morris, S. Liquid-crystal lasers. Nature Photonics 2010, 4, 676–685.
- Strzelecka et al. (1988) Strzelecka, T.E.; Davidson, M.W.; Rill, R.L. Multiple liquid crystal phases of DNA at high concentrations. Nature 1988, 331, 457–460.
- Nakata et al. (2007) Nakata, M.; Zanchetta, G.; Chapman, B.D.; Jones, C.D.; Cross, J.O.; Pindak, R.; Bellini, T.; Clark, N.A. End-to-End Stacking and Liquid Crystal Condensation of 6- to 20-Base Pair DNA Duplexes. Science 2007, 318, 1276–1279.
- Vollrath and Knight (2001) Vollrath, F.; Knight, D.P. Liquid crystalline spinning of spider silk. Nature 2001, 410, 541.
- Woltman et al. (2007) Woltman, S.J.; Jay, G.D.; Crawford, G.P. Liquid-crystal materials find a new order in biomedical applications. Nat. Mater. 2007, 6, 929–938.
- Goodby et al. (2008) Goodby, J.W.; Saez, I.M.; Cowling, S.J.; Görtz, V.; Draper, M.; Hall, A.W.; Sia, S.; Cosquer, G.; Lee, S.E.; Raynes, E.P. Transmission and Amplification of Information and Properties in Nanostructured Liquid Crystals. Angew. Chem. Int. Ed. 2008, 47, 2754–2787.
- Cladis (1975) Cladis, P.E. New Liquid–Crystal Phase Diagram. Phys. Rev. Lett. 1975, 35, 48.
- Mazza et al. (2010) Mazza, M.G.; Greschek, M.; Valiullin, R.; Kärger, J.; Schoen, M. Entropy-Driven Enhanced Self-Diffusion in Confined Reentrant Supernematics. Phys. Rev. Lett. 2010, 105, 227802.
- Mazza et al. (2011) Mazza, M.G.; Greschek, M.; Valiullin, R.; Schoen, M. Role of Stringlike, Supramolecular Assemblies in Reentrant Supernematic Liquid Crystals. Phys. Rev. E 2011, 83, 051704.
- Derouane et al. (1987) Derouane, E.G.; André, J.M.; Lucas, A.A. A Simple Van Der Waals Model for Molecule-Curved Surface Interactions in Molecular-Sized Microporous Solids. Chem. Phys. Lett. 1987, 137, 336–340.
- Yashonath and Santikary (1994) Yashonath, S.; Santikary, P. Diffusion of Sorbates in Zeolites Y and A: Novel Dependence on Sorbate Size and Strength of Sorbate-Zeolite Interaction. J. Phys. Chem. 1994, 98, 6368–6376.
- Ratna et al. (1981) Ratna, B.R.; Shashidhar, R.; Rao, K.V. Experimental Studies on the Electrical Conductivity of Two Reentrant Nematogens. Mol. Cryst. Liq. Cryst. 1981, 74, 143–147.
- Figueirinhas et al. (1992) Figueirinhas, J.L.; Cruz, C.; Ribeiro, A.C.; Huu Tinh, N. NMR study of molecular order in a liquid crystal with smectic and reentrant nematic mesophases. A comparative study with models for the phase. Mol. Cryst. Liq. Cryst. 1992.
- Cladis et al. (1977) Cladis, P.E.; Bogardus, R.K.; Daniels, W.B.; Taylor, G. High-Pressure Investigation of the Reentrant Nematic – Bilayer-Smectic-A Transition. Phys. Rev. Lett. 1977, 39, 720.
- Cladis et al. (1978) Cladis, P.E.; Bogardus, R.K.; Aadsen, D. High-Pressure Investigation of the Reentrant Nematic Bilayer Smectic-A Transition. Phys. Rev. A 1978, 18, 2292.
- Hardouin et al. (1979) Hardouin, F.; Sigaud, G.; Achard, M.F.; Gasparoux, H. Enantiotropic Nematic Reentrant Behavior at Atmospheric Pressure in a Pure Compound. Phys. Lett. A 1979, 71, 347–349.
- Huu Tinh and Gasparoux (1979) Huu Tinh, N.; Gasparoux, H. New Series Exhibiting Pure Enantiotropic Nematic Reentrant Compounds at Atmospheric Pressure. Mol. Cryst. Liq. Cryst. Lett. 1979, 49, 287–291.
- Sigaud et al. (1981) Sigaud, G.; Huu Tinh, N.; Hardouin, F.; Gasparoux, H. Occurence of Reentrant Nematic and Reentrant Smectic A Phases in Mesogenic Series. Mol. Cryst. Liq. Cryst. 1981, 69, 81–102.
- Hardouin et al. (1979) Hardouin, F.; Sigaud, G.; Achard, M.F.; Gasparoux, H. Measurements in a Pure Compound Exhibiting an Enantiotropic Reentrant Nematic Behavior at Atmospheric Pressure. Solid State Comm. 1979, 30, 265–269.
- Huu Tinh (1983) Huu Tinh, N. J. Chim. Phys. 1983, 80, 83.
- Huu Tinh et al. (1982) Huu Tinh, N.; Hardouin, F.; Destrade, C.; Levelut, A.M. A Re-Entrant Polymorphism N SA SC Nre. J. Physique Lett. 1982, 43, 33–37.
- Huu Tinh et al. (1984) Huu Tinh, N.; Gasparoux, H.; Malthete, J.; Destrade, C. Molecular Aspect and Polymorphism in Polar Rod-Like Mesogens. Mol. Cryst. Liq. Cryst. 1984, 114, 19–41.
- Indekeu and Berker (1986) Indekeu, J.O.; Berker, A.N. Molcular Tail Length, Dipole Pairings, and Multiple Reentrance Mechanisms of Liquid Crystals. Physica 1986, 140A, 368–375.
- Cladis (1988) Cladis, P.E. A One Hundred Year Perspective of the Reentrant Nematic Phase. Mol. Cryst. Liq. Cryst. 1988, 165, 85–121.
- Diele et al. (1983) Diele, S.; Pelzl, G.; Latif, I.; Demus, D. X-Ray Investigations of a Reentrant Nematic Phase Formed of Terminal-Nonpolar Compounds. Mol. Cryst. Liq. Cryst. 1983, 92, 27–33.
- Pelzl et al. (1986) Pelzl, G.; Latif, I.; Diele, S.; Novak, M.; Demus, D.; Sackmann, H. Reentrant Nematic Phases in Binary Systems of Terminal-Nonpolar Compounds. Mol. Cryst. Liq. Cryst. 1986, 139, 333–351.
- Guillon et al. (1978) Guillon, D.; Cladis, P.E.; Stamatoff, J. X-Ray Study and Microscopic Study of the Reentrant Nematic Phase. Phys. Rev. Lett. 1978, 41, 1598–1601.
- Miyajima et al. (1984) Miyajima, S.; Akaba, K.; Chiba, T. Proton NMR Study of Pure Liquid Crystal Exhibiting Re-Entrant Phase Transition. Solid State Commun. 1984, 49, 675–678.
- Dong (1981a) Dong, R.Y. Proton Spin Relaxation in a Reentrant Nematic Liquid Crystal Mixture. Mol. Cryst. Liq. Cryst. 1981, 64, 205–210.
- Dong (1981b) Dong, R.Y. NMR Study of Alloys Exhibiting a Reentrant Nematic Phase. J. Chem. Phys. 1981, 75, 2621.
- Dong (1982) Dong, R.Y. Frequency Dependence Study of the Proton Spin Relaxation in the Re-Entrant Nematic Phase. J. Chem. Phys. 1982, 76, 5659.
- Sebastião et al. (1995) Sebastião, P.J.; Ribeiro, A.C.; Nguyen, H.T.; Noack, F. Molecular Dynamics in a Liquid Crystal with Reentrant Mesophases. J. Phys. II France 1995, 5, 1707–1724.
- Bharatam and Bowers (1999) Bharatam, J.; Bowers, C.R. Characterization of Phase Transition and Dynamics in Reentrant Namatic Liquid Crystals by Xenon-129 Nuclear Magnetic Resonance. J. Phys. Chem. B 1999, 103, 2510–2515.
- Dong et al. (1987) Dong, R.Y.; Richards, G.M.; Lewis, J.S.; Tomchuck, E.; Bock, E. Spectral Density of Motion in a Reentrant Nematic by Deuterium NMR. Mol. Cryst. Liq. Cryst. 1987, 144, 33–42.
- Shen and Dong (1998) Shen, X.; Dong, R.Y. A Comparative Study of Dynamics in the Nematic and Reentrant-Nematic Phases of 6OCB/8OCB Mixture by Deuteron Nuclear Magnetic Resonance Relaxation. J. Chem. Phys. 1998, 108, 9177.
- Dong et al. (2000) Dong, R.Y.; Carvalho, A.; Sebastião, P.J.; Nguyen, H.T. Deuteron NMR stud of molecular dynamics in a compoun exhibiting a reentrant nematic phase. Phys. Rev. E 2000, 62, 3679–3686.
- Vaz et al. (1983) Vaz, N.A.P.; Yaniv, Z.; Doane, J.W. 2H NMR measurements of the molecular orientational ordering in a reentrant liquid-crystalline mixture. Chem. Phys. Lett. 1983, 98, 354–358.
- Cladis (1981) Cladis, P.E. The Re-Entrant Nematic, Enhanced Smectic A Phases and Molecular Composition. Mol. Cryst. Liq. Cryst. 1981, 67, 177–192.
- Emsley et al. (1985) Emsley, J.W.; Luckhurst, G.R.; Parsons, P.J.; Timini, B.A. Chain orientational order and the re-entrant nematic phase A duterium N.M.R. study of 4-n-hexyloxy-d13-4-n-octyloxy-d17--cyanobiphenyl and their re-entrant mixture. Mol. Phys. 1985, 56, 767–774.
- Dong et al. (1985) Dong, R.Y.; Lewis, J.S.; Tomchuk, E.; Bock, E. DMR Study of Molecular Order in a Reentrant Nematic Liquid Crystal. Mol. Cryst. Liq. Cryst. 1985, 122, 35–40.
- Nayeem and Freed (1989) Nayeem, A.; Freed, J.H. ESR Study of the dynamic molecular structure of a reentrant nematic liquid crystal. J. Phys. Chem 1989, 93, 6539–6550.
- Nozaki et al. (1992) Nozaki, R.; Bose, T.K.; Yagihara, S. Dielectric Relaxation of a Reentrant Nematic-Liquid-Crystal Mixture by Time-Domain Reflectometry. Phys. Rev. A 1992, 46, 7733–7737.
- Yethiraj et al. (2007) Yethiraj, A.; Burnell, E.E.; Dong, R.Y. The Smectic Potential in a Liquid Crystal with a Reentrant Nematic Phase: NMR of Solutes. chem. Phys. Lett. 2007, 441, 245–249.
- Das and Prasad (2011) Das, M.K.; Prasad, A. Rotational Viscosity Measurement of a Binary Mixture Showing Both Induced Smectic and Re-Entrant Nematic Phases. Mol. Cryst. Liq. Cryst. 2011, 540, 162–168.
- Bhattacharya and Letcher (1980) Bhattacharya, S.; Letcher, S.V. Flow Behavior of an Ordered, Reentrant, Nematic Liquid Crystal. Phys. Rev. Lett. 1980, 44, 414–417.
- Jadżyn and Czechowski (2007) Jadżyn, J.; Czechowski, G. Pre-transitional Temperature Behaviour of the Shear Viscosity of Freely Flowing Thermotropic Liquid Crystals. Phase Transitions 2007, 80, 665–673.
- Prost and Barois (1983) Prost, J.; Barois, P. J. Chim. Phys. 1983, 80, 65.
- Prost (1984) Prost, J. The Smectic State. Adv. Phys. 1984, 33, 1–46.
- Berker and Walker (1981) Berker, A.N.; Walker, J.S. Frustrated Spin-Gas Model for Doubly Reentrant Liquid Crystals. Phys. Rev. Lett. 1981, 47, 1469.
- Indekeu and Berker (1986) Indekeu, J.O.; Berker, A.N. Quadruple Reentrance (Nematic–Smectic-–Nematic–Smectic-–Nematic–Smectic-) from the Frustrated Spin-Gas Model of Liquid Crystals. Phys. Rev. A 1986, 33, 1158–1162.
- Huu Tinh et al. (1982) Huu Tinh, N.; Hardouin, F.; Destrade, C. Trois phénomènes rentrants dans un produit pur mésogène. J. Phys. France 1982, 43, 1127–1131.
- Netz and Berker (1992) Netz, R.R.; Berker, A.N. Smectic-C Order, In-Plane Domains, and Nematic Reentrance in a Microscopic Model of Liquid Crystals. Phys. Rev. Lett. 1992, 68, 333.
- Kortan et al. (1981) Kortan, A.R.; Känel, H.V.; Birgeneau, R.J.; Litster, J.D. High-Resolution X-Ray-Scattering Study of the Nematic-Smectic A-Reentrant Nematic Transitions in 8OCB/6OCB Mixtures. Phys. Rev. Lett. 1981, 47, 1206–1209.
- (58) Guillon, D.; Cladis, P.E.; Aadsen, D.; Daniels, W.B. X-ray investigation of the smectic A reentrant nematic transition under pressure (CBOOA). Phys. Rev. A, 21, 658–665.
- Longa and de Jeu (1982) Longa, L.; de Jeu, W.H. Microscopic One-Particle Description of Reentrant Behavior in Nematic Liquid Crystals. Phys. Rev. A 1982, 26, 1632.
- McMillan (1971) McMillan, W.L. Simple Molecular Model for the Smectic A Phase of Liquid Crystals. Phys. Rev. A 1971, 4, 1238–1246.
- Luckhurst and Timini (1981) Luckhurst, G.R.; Timini, B.A. A Molecular Theory of Re-Entrant Polymorphism in Pure Liquid Crystals. Mol. Cryst. Liq. Cryst. 1981, 64, 253–259.
- Ferrarini et al. (1996) Ferrarini, A.; Luckhurst, G.R.; Nordio, P.L.; Spolaore, E. The Influence of Association and Isomerization on Re-Entrant Nematic and Smectic A Polymorphism. Mol. Phys. 1996, 89, 1087–1103.
- Dowell (1987) Dowell, F. Reentrant Nematic and Multiple Smectic-A Liquid Crystals: Intrachain Flexibility Constraints. Phys. Rev. A 1987, 36, 5046–5058.
- Bose et al. (1991) Bose, T.R.; Ghose, D.; Mukherjee, C.D.; Saha, J.; Roy, M.K.; Saha, M. Role of End Chains in the Reentrant Behavior of a Nonpolar System. Phys. Rev. A 1991, 43, 4372–4377.
- Gubbins and Moore (2010) Gubbins, K.E.; Moore, J.D. Molecular Modeling of Matter: Impact and Prospects in Engineering. Ind. Eng. Chem. Res. 2010, 49, 3026–3046.
- de Miguel and Martín del Río (2005) de Miguel, E.; Martín del Río, E. Computer Simulation of Nematic Reentrance in a Simple Molecular Model. Phys. Rev. Lett. 2005, 95, 217802.
- Schoen and Klapp (2007) Schoen, M.; Klapp, S.H.L. Nanoconfined Fluids. Soft Matter Between Two and Three Dimensions; Wiley-VCH, Hoboken, 2007.
- Schoen and Günther (2010) Schoen, M.; Günther, G. Phase Transitions in Nanoconfined Fluids: Synergistic Coupling between Soft and Hard Matter. Soft Matter 2010, 6, 5832–5838.
- Schoen (2008) Schoen, M. Fluid bridges confined between chemically nanopatterned solid substrates. Phys. Chem. Chem. Phys. 2008.
- Martínez-Haya et al. (2004) Martínez-Haya, B.; A.Cuetos.; Lago, S.; Rull, L.F. A Novel Orientation-Dependent Potential Model for Prolate Mesogens. J. Chem. Phys. 2004, 122, 024908.
- (71) A spherocilinder is defined as a cylinder of length and diameter capped at both ends with hemispheres of diameter . Thus, the total length of the spherocilinder is .
- Vega and Lago (1994) Vega, C.; Lago, S. A Fast Algorithm to Evaluate the Shortest Distance Between Rods. Comput. Chem. 1994, 18, 55–59.
- Sonin (1995) Sonin, A.A. The Surface Physics of Liquid Crystals; Gordon and Breach Publishers, 1995.
- Jérôme (1991) Jérôme, B. Surface Effects and Anchoring in Liquid Crystals. Rep. Prog. Phys. 1991, 54, 391–451.
- Ilnytskyi and Wilson (2002) Ilnytskyi, J.M.; Wilson, M.R. A Domain Decomposition Molecular Dynamics Program for the Simulation of Flexible Molecules of Spherically-Symmetrical and Nonspherical Sites. II. Extension to NVT and NPT Ensembles. Comput. Phys. Commun. 2002, 148, 43.
- de Gennes (1971) de Gennes, P.G. Short Range Order Effects in the Isotropic Phase of Nematics and Cholesterics. Mol. Cryst. Liq. Cryst. 1971, 12, 193–214.
- Pardowitz and Hess (1980) Pardowitz, H.; Hess, S. On the Theory of Irreversible Processes in Molecular Liquids and Liquid Crystals, Nonequilibrium Phenomena Associated with the Second and Fourth Rank Alignment Tensors. Physica A 1980, 100, 540–562.
- Maier and Saupe (1959) Maier, W.; Saupe, A. Eine Einfache Molekularstatistische Theorie der Nematischen Kristallinflüssigen Phase. Teil I. Z. Naturforsch 1959, 14a, 882.
- Maier and Saupe (1960) Maier, W.; Saupe, A. Eine Einfache Molekularstatistische Theorie der Nematischen Kristallinflüssigen Phase. Teil II. Z. Naturforsch. 1960, 15a, 287.
- Eppenga and Frenkel (1984) Eppenga, R.; Frenkel, D. Monte Carlo Study of the Isotropic and Nematic Phases of Infinitely Thin Hard Platelets. Mol. Phys. 1984, 52, 1303–1334.