The host galaxy of the BL Lacertae object 1ES 0647+250 and its imaging redshift
Abstract
Aims. Since no spectroscopic redshift is available for the remarkable BL Lac object 1ES 0647+250, we aim to derive an estimate of its distance from the properties of its host galaxy.
Methods. We obtained a deep, high-resolution near-infrared -band image of the BL Lacertae object 1ES 0647+250.
Results. We are able to detect the underlying host galaxy in the near–infrared. The host galaxy has an -band magnitude of 16.90.2 and an effective radius of 1603. Using the imaging redshift method by Sbarufatti et al. (2005), we estimate a redshift z = 0.410.06. This redshift is consistent with the previously reported imaging redshift estimate from the optical -band, z = 0.450.08 by Meisner & Romani (2010), and with previously reported lower limits for the redshift. It is also in agreement with constraints from its gamma-ray emission.
Conclusions. Imaging searches in the near-infrared, even with moderately sized telescopes, for the host galaxies of BL Lac objects at unknown redshift, are encouraged, as well as optical spectroscopy of 1ES 0647+250 with large telescopes to determine its spectroscopic redshift.
Key Words.:
Galaxies: active - Galaxies: distances and redshifts - BL Lacertae objects: individual: 1ES 0647+2501 Introduction
In the study of extragalactic objects, a fundamental parameter is their distance. In active galactic nuclei (AGN), this is usually derived from the redshift z, measurable from emission lines, with the exception of BL Lac objects. Their practically featureless spectra are dominated by the Doppler-boosted emission of a relativistically beamed synchrotron jet, closely aligned with our line of sight (e.g. Urry & Padovani, 1995). They are members of the high-energy family of AGN, showing strong nonthermal emission, superluminal motion and rapid/large variations in flux/polarization, and by definition, few (if any) very weak emission lines. The redshift of BL Lacs can, however, be derived from the absorption lines of their host galaxies. Despite this, even with deep spectroscopy at 8-m class telescopes (e.g. Sbarufatti et al. 2006,2009), many BL Lacs remain without a spectroscopically determined redshift.
The ignorance about the redshift prevents us from constraining their high-energy physics, their bolometric power, multifrequency spectral energy distributions (SEDs) and synchrotron self-Compton (SSC) emission models. Most blazars (BL Lacs and flat spectrum radio quasars, FSRQ) emit the bulk of their power at MeV-GeV gamma-rays. Many blazars have been detected even at TeV gamma-rays using ground-based Cherenkov telescopes MAGIC, HESS, and VERITAS. Since VHE gamma-rays can be absorbed by the interaction with low energy photons of the extragalactic background light (EBL) via pair production, this opens the possibility of measuring the amount of EBL, which provides important information about the galaxy formation and star formation histories. The absorption depends strongly on the distance of the source and the energy of the gamma-rays. If the redshift of the source is known, the VHE gamma-ray spectrum can be used to derive limits on the EBL (e.g. Aharonian et al. 2006).
The blazar 1ES 0647+250 was detected as a radio source in the MIT-Green Bank II survey at 5 GHz using the NRAO 91-m transit telescope (Langston et al. 1990). X-ray emission was discovered in the Einstein IPC Slew Survey (Elvis et al. 1992). 1ES 0647+250 was classified as a BL Lac object through X-ray/radio vs. X-ray/optical colour-colour diagrams and confirming optical spectroscopy by Schachter et al. (1993). Optical spectra taken at 1-2m class telescopes have validated that 1ES 0647+250 has a featureless spectrum (Perlman et al. 1996). The object is highly variable with rapid variations observed from radio to X-ray bands (e.g. Giommi et al. 1995; Nieppola et al. 2006). The VLBA map of 1ES 0647+250 (Rector et al. 2003) does not show a distinct jet but there is some evidence for a faint, diffuse halo around the core, with weak evidence of elongation of the core to the north. VLA 6 cm observations (Perlman et al. 1996) of this source indicate a jet extending to the SW as well as a possible extension to the NW.
The nucleus of 1ES 0647+250 is optically very bright, thus previous attempts to either determine its redshift spectroscopically or, until recently, to characterize its host galaxy have not been successful. Thus, in spite of numerous variability studies of 1ES 0647+250, it has never been possible to determine reliably e.g. the linear dimensions and luminosities of the varying components.
Upper limits to the TeV gamma-ray emission from this object have been reported by HEGRA (Aharonian et al. 2004) and by MAGIC (Abdo et al. 2009). Recently, there was a tentative detection of the object at TeV energies by MAGIC (M. Persic, priv. comm. and MAGIC collaboration, in prep.). Given that previous estimates place 1ES 0647+250 at z 0.3, if the detection is confirmed, this would make it one of the most distant TeV sources observed so far. Given the importance of 1ES 0647+250 to EBL studies, the evaluation of its distance is a fundamental measurement. Throughout this paper, we use the cosmology km s-1 Mpc-1, = 0.3 and = 0.7.
2 Observations and data analysis
1ES 0647+250 was observed at the 2.5m Nordic Optical Telescope (NOT), La Palma, during the night of November 12, 2008. We used the pixel NOTCam detector in imaging mode with a pixel scale of 0235 px, giving a field of view of arcmin2. The seeing during the observations, as derived from the median FWHM size of the stars in the frame, was 06. The images in the -band were acquired by dithering the target across the array in a random grid within a box of 20 arcsec, and taking a 60 sec exposure at each position, always keeping the target well inside the field. Individual exposures were then coadded to achieve the final frame. A total of 45 exposures of 60 sec were acquired, which provided a total exposure time of 2700 sec.
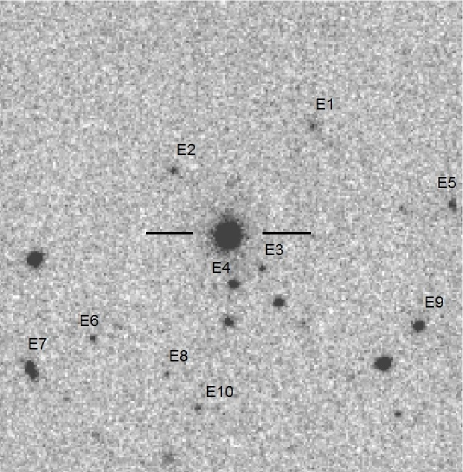
Data reduction was performed using IRAF111IRAF is distributed by the National Optical Astronomy Observatories, which are operated by the Association of Universities for Research in Astronomy, Inc., under cooperative agreement with the National Science Foundation.. Bad pixels were corrected for in each image using a mask made from the ratio of two sky flats with different illumination levels. Sky subtraction was performed for each science image using a median averaged frame of all the other temporally close frames in a grid of eight exposures. Flat fielding was made using normalized median averaged twilight sky frames with different illumination levels. Finally, images were aligned to sub-pixel accuracy using field stars as reference points and combined after removing spurious pixel values to obtain the final reduced co-added image. Standard stars from Hunt et al. (1998) were observed temporally close to the target to provide photometric calibration, which resulted in internal photometric accuracy of 0.05 mag, as determined from the comparison of all observed standard stars. The final image of the field of 1ES 0647+250 is shown in Fig. 1.
Data analysis was carried out using AIDA (Astronomical Image Decomposition and Analysis), an IDL-based software package designed to perform 2D model fitting of quasar images, providing simultaneous decomposition into nuclear and host galaxy components. The applied procedure is described in detail in Kotilainen et al. (2007), and briefly summarized here.
The most critical part of the analysis is the determination of the PSF model and the estimate of the background level, which may strongly affect the faint signal from the diffuse object. To model the PSF shape, we used field stars selected on the basis of their FWHM, sharpness, roundness and S/N ratio, including bright, slightly saturated stars, in order to properly model the faint wing of the PSF.
Each star was then modeled with four 2D Gaussians, representing the core of the PSF, and an exponential extended wing of the PSF. Regions contaminated by nearby sources, saturated pixels and other defects of the images were masked out. The local background was computed in a circular annulus centered on the star, and its uncertainty was estimated from the standard deviation of the values in sectors of concentric sub-annuli included in this area. Finally, the region used in the fit was selected by defining an internal and an external radius, allowing the exclusion of the core of bright, saturated stars. From the comparison of the resulting light profiles, we find no systematic variation of the PSF over the field of view. Thus, the same model was fitted simultaneously to all the stars of the image.
The uncertainty of the PSF model was estimated by comparing the analytical fit with the individual observed star profiles, and adding a fixed term ( mag arcsec) to account for possible systematic effects in the data reduction (e.g. zero-point and PSF stability, and alignment in the de-jitter procedure).
In order to evaluate whether the target is resolved, we first fit the image using only the PSF model, i.e. the unresolved nucleus. The residuals revealed a significant excess over the PSF shape beyond 1 arcsec radius, where the contribution from the host galaxy becomes detectable, and the target was considered resolved. The target was then fitted with a two component model, consisting of the PSF and a host galaxy described by a Sersic profile, where the Sersic index was kept as a free parameter.
3 Results
In Fig. 2, we report the image of 1ES 0647+250, the best-fitting PSF, the residual after the PSF subtraction (i.e. the host galaxy), and the residual after the fit with both the PSF and the galaxy model. Table 1 gives the results of the model fit. The host galaxy of 1ES 0647+250 is faint ( = 16.9) compared to the nucleus ( = 14.3) and never exceeds the core brightness at any radius, but is visible as a small excess in the surface brightness profile (Fig. 3). The fit with the PSF + galaxy reduces the of the fit compared to the PSF only fit ( = 1.9 and 2.6, respectively).
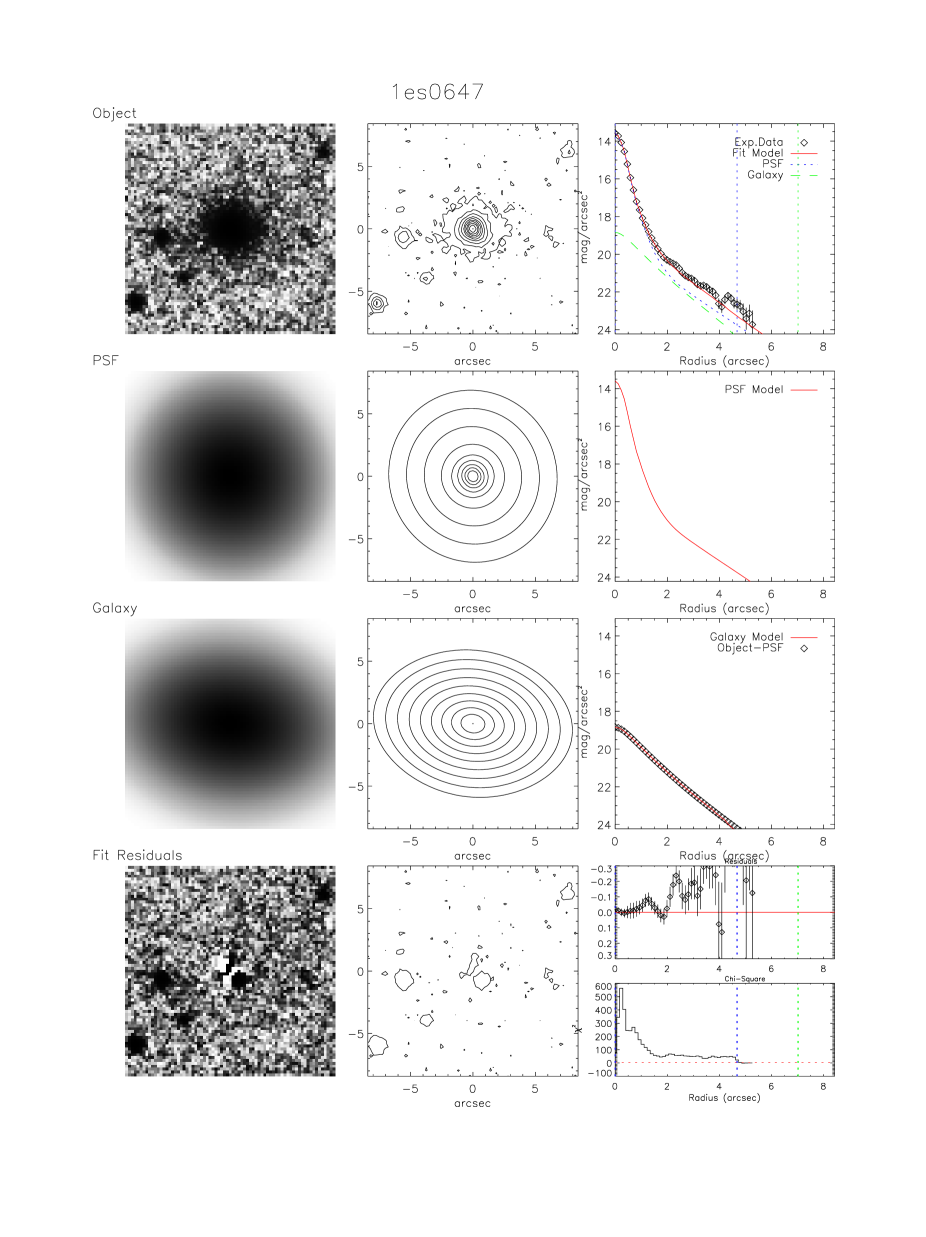

| Model | m(nuc) | m(host) | R(e) | ell | N(Sersic) | |||
|---|---|---|---|---|---|---|---|---|
| (mag) | (mag) | mag arcsec-2 | arcsec | deg | ||||
| PSF only | 2.6 | 14.21 | … | … | … | … | … | … |
| PSF + host galaxy | 1.9 | 14.26 | 16.95 | 18.0 | 1.59 | 0.32 | 3.01 | 1.24 |
Knowing the host galaxy magnitude, we can estimate the redshift of 1ES 0647+250. Sbarufatti et al. (2005) demonstrated that the distribution of the absolute magnitudes of BL Lac host galaxies is almost Gaussian with an average of = -22.8 and = 0.5, and that BL Lac host galaxies can therefore be used as a standard candle to estimate their distances. Before using their method, we first have to transform the apparent -band magnitude of the host galaxy to apparent -band magnitude. Since the observed colour depends on redshift, we have to determine the redshift by iteration, starting from z = 0 and using Eq. (2) in Sbarufatti et al. (2005) and a typical BL Lac host galaxy colour = 2.2 0.4 (Hyvönen et al. 2007). This iteration yields R(host) = 19.1 and z = 0.408 in the adopted cosmology.
To compute the uncertainty in the derived redshift, we use the estimated 1 fitting uncertainty of the host galaxy magnitude of 0.2 mag. Performing the redshift iteration at m(host) + 0.2 mag and m(host) - 0.2 mag yields an error of 0.03 for z. By adding to this in quadrature the inherent uncertainty in the method (; Sbarufatti et al. 2005), we derive the final error in z to be 0.06.
The effective radius of the host galaxy is 1603, which translates into 8.61.7 kpc at z = 0.41, consistent with typical values found in the near-infrared (NIR) for blazar host galaxies (e.g. Kotilainen et al. 1998a,b), which lends further credibility to our estimate of the redshift.
4 Discussion
There have been several previous attempts to derive the host galaxy properties of 1ES 0647+250 with varying success. Falomo & Kotilainen (1999) found the object to be unresolved from 900 sec NOT -band imaging taken under very good seeing conditions (065). They derived a lower limit of z 0.3, assuming it is hosted by a typical elliptical galaxy. Scarpa et al. (2000) obtained a 600 sec HST F702W band image, as part of their BL Lac snapshot survey. They found the surface brightness profile to be consistent with the PSF and derived an upper limit R 19.1 for the apparent magnitude of the host galaxy. Based on this upper limit, Sbarufatti et al. (2005) derived a lower limit of z 0.47 for the redshift. Finally, Nilsson et al. (2003) found that 1ES 0647+250 was unresolved in a 900 sec NOT -band image, taken under 10 seeing conditions.
Meisner & Romani (2010) were able to resolve the host galaxy from 1200 sec -band imaging at the WIYN 3.6m telescope at Kitt Peak National Observatory, under very good seeing conditions (068). They derived apparent -band magnitudes of 16.1 and 19.00.1 for the nucleus and the host galaxy, respectively. However, their data analysis did not allow them to estimate the effective radius of the host galaxy. Based on the host magnitude, and using the method of Sbarufatti et al. (2005), Meisner & Romani (2010) report imaging redshift of z = 0.450.08. We note that the detection of the host galaxy by Meisner & Romani is not well documented, in the sense that they do not show the image of the field, the radial profiles vs. the models, nor the comparison with the PSF. Especially, the lack of an estimate of the effective radius translates into a poorer constraint on the redshift, than that reported in this work.
Knowledge of the redshift is of critical importance to the VHE spectra of blazars, due to the absorption of VHE photons via pair production on the EBL. This absorption is energy-dependent and increases strongly with redshift, distorting the VHE spectra of distant objects. Our redshift estimate, z = 0.410.06, places thus important constraints on the gamma-ray properties of 1ES 0647+250, and it is consistent with a picture where the VHE photons are mostly absorbed and the gamma-ray spectrum of 1ES 0647+250 is dominated by the EBL.
BL Lac hosts are often surrounded by a significant excess of nearby galaxies (e.g. Falomo et al. 2000). To see if there is an overdensity of galaxies around 1ES 0647+250, we counted all the resolved objects within a projected distance of 275 (135 kpc at z = 0.41) of its nucleus, and in eight similarly sized comparison fields on the outskirts of the final image of the field. There are 10 resolved objects in the environment of 1ES 0647+250 (see Fig. 1), whereas the corresponding average for the comparison fields is 6.43.0. This difference indicates that 1ES 0647+250 may belong to a compact group of galaxies at z 0.4. Interestingly, there are two close companions, namely galaxies E3 and E4 in Fig. 1. They are both at a projected distance of only 55 (27 kpc at z = 0.41), and have -band magnitudes 20.3 and 18.6, respectively.
5 Conclusions
A deep NOT -band image of the BL Lacertae object 1ES 0647+250 has enabled us to detect and characterize the host galaxy in the near-infrared. Using the imaging redshift method by Sbarufatti et al. (2005), we estimate a redshift of z = 0.410.06 for 1ES 0647+250. This redshift is in agreement with constraints from its gamma-ray emission.
We have shown that the imaging redshift technique by Sbarufatti et al. (2005) gives independently consistent results, and that imaging searches in the near-infrared even with a moderately sized telescope, such as the NOT, can be productive to considerably high redshifts. The contrast of the host galaxy with the blue nuclear continuum flux is at its maximum in the NIR, a fact that may allow host detections even in higher redshift sources with extreme core dominance. We encourage attempts with large 8-m class telescopes to secure the spectroscopic redshift of 1ES 0647+250 from optical spectroscopy.
Acknowledgements.
JKK and TH acknowledge financial support from the Academy of Finland, projects 8107775 and 2600021611. These data are based on observations made with the Nordic Optical Telescope, operated on the island of La Palma jointly by Denmark, Finland, Iceland, Norway, and Sweden, in the Spanish Observatorio del Roque de los Muchachos of the Instituto de Astrofisica de Canarias.References
- Abdo et al. (2009) Abdo, A.A., Ackermann, M., Ajello, M., et al. 2009, ApJ, 707, 1310
- Aharonian et al. (2004) Aharonian, F., Akhperjanian, A. G., Beilicke, M., et al. 2004, A&A, 421, 529
- Aharonian et al. (2006) Aharonian, F., Akhperjanian, A. G., Bazer-Bachi, A. R., et al. 2006, Nature, 440, 1018
- Elvis et al. (1992) Elvis, M., Plummer, D., Schachter, J. & Fabbiano, G. 1992, ApJS, 80, 257
- Falomo & Kotilainen (1999) Falomo, R., & Kotilainen, J.K. 1999, A&A, 352, 85
- Falomo et al. (2000) Falomo, R., Scarpa, R., Treves, A., Urry, C.M. 2000, ApJ, 542, 731
- Giommi et al. (1995) Giommi, P., Ansari, S.G., & Micol, A. ,1995, A&AS, 109, 267
- Hunt et al. (1998) Hunt, L.K., Mannucci, F., Testi, L., et al., 1998, AJ, 115, 2594
- Hyvönen et al. (2007) Hyvönen, T., Kotilainen, J.K., Falomo, R., Örndahl, E., & Pursimo, M. 2007, A&A, 476, 723
- Kotilainen et al. (1998a) Kotilainen, J.K., Falomo, R. & Scarpa, R. 1998a, A&A 332, 503
- Kotilainen et al. (1998b) Kotilainen, J.K., Falomo, R. & Scarpa, R. 1998b, A&A 336, 479
- Kotilainen et al. (2007) Kotilainen, J.K., Falomo, R., Labita, M., Treves, A. & Uslenghi, M. 2007, ApJ, 660, 1039
- Langston et al. (1990) Langston, G.I., Heflin, M.B., Conner, S.R., et al. 1990, ApJS, 72, 621
- Meisner & Romani (2010) Meisner, A.M. & Romani, R.W. 2010, ApJ, 712, 14
- Nieppola et al. (2006) Nieppola, E., Tornikoski, M., & Valtaoja, E., 2006, A&A, 445, 441
- Nilsson et al. (2003) Nilsson, K., Pursimo, T., Heidt, J., et al. 2003, A&A, 400, 95
- Perlman et al. (1996) Perlman, E.S., Stocke, J.T., Schachter, J.F. et al. 1996, ApJS, 104, 251
- Prandini et al. (2010) Prandini, E., Bonnoli, G., Maraschi, L., Mariotti, M., & Tavecchio, F. 2010, MNRAS, 405, L76
- Rector et al. (2003) Rector, T.A., Gabuzda, D.C., & Stocke, J.T. 2003, AJ, 125, 1060
- Sbarufatti et al. (2005) Sbarufatti, B., Treves, A., & Falomo, R. 2005, ApJ, 635, 173
- Sbarufatti et al. (2006) Sbarufatti, B., Treves, A., Falomo, R., et al. 2006, AJ, 132, 1
- Sbarufatti et al. (2009) Sbarufatti, B., Ciprini, S., Kotilainen, J., et al. 2009, AJ, 137, 337
- Scarpa et al. (2000) Scarpa, R., Urry, C. M., Falomo, R., Pesce, J. E., & Treves, A. 2000, ApJ, 532, 740
- Schachter et al. (1993) Schachter, J.F., Stocke, J.T., Perlman, E. et al., 1993, ApJ, 412, 541
- Urry & Padovani (1995) Urry, C. M., & Padovani, P. 1995, PASP, 107, 803