Schmidt-Kennicutt relations in SPH simulations of disc galaxies with effective thermal feedback from SNe
Abstract
We study several versions of the Schmidt-Kennicutt (SK) relation obtained for isolated spiral galaxies in TreeSPH simulations run with the gadget3 code including the novel MUlti-Phase Particle Integrator (muppi) algorithm for star formation and stellar feedback. This is based on a sub-resolution multi-phase treatment of gas particles, where star formation is explicitly related to molecular gas, and the fraction of gas in the molecular phase is computed from hydrodynamical pressure, following a phenomenological correlation. No chemical evolution is included in this version of the code. The standard SK relation between surface densities of cold (neutral+molecular) gas and star formation rate of simulated galaxies shows a steepening at low gas surface densities, starting from a knee whose position depends on disc gas fraction: for more gas-rich discs the steepening takes place at higher surface densities. Because gas fraction and metallicity are typically related, this environmental dependence mimics the predictions of models where the formation of is modulated by metallicity. The cold gas surface density at which HI and molecular gas surface densities equate can range from up to M⊙ pc-2. As expected, the SK relation obtained using molecular gas shows much smaller variations among simulations. We find that disc pressure is not well represented by the classical external pressure of a disc in vertical hydrostatic equilibrium. Instead is well fit by the expression , where the three quantities on the right-hand side are cold gas surface density, vertical velocity dispersion and epicyclic frequency. When the “dynamical” SK relation, i.e. the relation that uses gas surface density divided by orbital time, is considered, we find that all of our simulations stay on the same relation. We interpret this as a manifestation of the equilibrium between energy injection and dissipation in stationary galaxy discs, when energetic feedback is effective and pressure is represented by the expression given above. These findings further support the idea that a realistic model of the structure of galaxy discs should take into account energy injection by SNe.
keywords:
galaxies: formation – galaxies: ISM – galaxies: kinematics and dynamics1 Introduction
In the last decade a significant step forward in the phenomenological understanding of star formation in galaxies has been achieved, thanks to many observational campaigns of nearby (see, e.g., Boissier et al., 2007; Kennicutt et al., 2007; Walter et al., 2008) and distant (e.g. Bouché et al., 2007; Daddi et al., 2010; Genzel et al., 2010) galaxies. In particular, the relation between surface densities of gas and star formation rate (hereafter SFR), the so-called Schmidt-Kennicutt relation (Schmidt, 1959; Kennicutt, 1998, hereafter standard SK), has acquired a higher degree of complexity, passing from a simple power law to a much more structured and environment-dependent relation. Here by environment we mean the local properties, averaged over kpc scale, of a galaxy patch that hosts star-forming molecular clouds. We will call standard, molecular, HI and dynamical SK the relations obtained by putting on the y-axis the surface density of SFR , and on the x-axis, respectively, the total cold gas surface density , the molecular gas surface density , the HI gas surface density or the total cold gas surface density divided by the orbital time-scale, , where ( being the galaxy rotation curve).
Wide consensus has recently been reached on the idea that the standard SK is a reflection of the more “fundamental” molecular SK (Wong & Blitz, 2002; Blitz & Rosolowsky, 2004, 2006), while the HI SK is weak if not absent (Bigiel et al., 2008, 2010). Indeed, in normal (and non-barred) spiral galaxies the fraction of gas in molecular clouds increases toward the galaxy center, while the HI gas surface density, , saturates at a value of M⊙ pc-2 and declines in the inner kpc. The old notion of a star formation threshold in disc galaxies (Martin & Kennicutt, 2001) has thus been revised to a steepening of the standard SK at low surface densities (Boissier et al., 2007; Bigiel et al., 2008), driven by the declining molecular fraction.
The gas surface density at which the transition from HI- to molecular-dominated gas takes place, or equivalently the saturation value of , has been proposed to be a function of galactic environment (Krumholz et al. 2009b; Gnedin & Kravtsov 2010; Papadopoulos & Pelupessy 2010; see also Schaye 2004), with dwarf galaxies like the Magellanic Clouds showing higher values (Bolatto et al. 2009; Bolatto et al. 2011; see also references in Fumagalli et al. 2010). This is in line with the high-redshift evidence of low efficiency of star formation in Damped Lyman-alpha systems at (Wolfe & Chen, 2006), that are thought to be the external, gas-rich, metal-poor regions of young disc galaxies.
The slope of the molecular SK relation is debated. For THINGS spiral galaxies, Bigiel et al. (2008) report a slope of when measured on a spatial grid of 750 pc bin size. An average value of 1 has been confirmed very recently by Bigiel et al. (2011). A steeper slope, more consistent with the canonical 1.4 value of Kennicutt 1998 is reported by Kennicutt et al. (2007) for star-forming regions in M51a. Liu et al. (2011) interpret this discrepancy as an effect of subtraction of background emission in H and dust, and claim that a super-linear slope results when proper subtraction is performed. At higher surface densities, a steeper relation is suggested by observations of Ultra Luminous Infra-Red Galaxies (ULIRGs) and Sub-mm Galaxies (SMGs) (Bouché et al., 2007), but recent observations (Daddi et al., 2010; Genzel et al., 2010; Boquien et al., 2011) suggest that at ULIRGS and SMGs, on the one side, and non-IR bright and BzK galaxies, on the other side, trace two parallel molecular SK relations with slope and separated by nearly one order of magnitude in normalization (IR-bright galaxies having higher ).
The interpretation of this phenomenological picture is still under discussion. Based on observations, the declining molecular fraction with gas surface density was proposed by Blitz & Rosolowsky (2004, 2006) to be driven by external pressure, i.e. the midplane pressure of gas in vertical hydrostatic equilibrium in a thin disk. However, this relation has large scatter and is as scattered as other relations with, e.g., disc mass surface density (Leroy et al., 2008). Alternatively, many authors (Pelupessy et al., 2006; Krumholz et al., 2009a; Gnedin & Kravtsov, 2010; Dib, 2011) have proposed models where the molecular fraction is regulated by the equilibrium balance between production of H2 and destruction of the same molecule by UV radiation from young stars (an assumption recently criticized by Mac Low & Glover 2010). Both creation and destruction channels are regulated by dust abundance, because dust is both a catalyst and a shield. As a consequence, the molecular fraction is predicted to be driven by gas surface density (or column density) and modulated by gas metallicity. Therefore, the scaling of molecular fraction with gas surface density, or equivalently the saturation value of , should be a function of metallicity. Fumagalli et al. (2010) have recently tested the two assumptions (pressure-driven or gas surface density-driven molecular fraction) against data on nearby spiral and dwarf galaxies, and report a marginal preference for the second hypothesis.
The varying slope of the of the molecular SK, steepening toward high from to , has been interpreted by Krumholz et al. (2009b) as an effect of the decoupling of molecular clouds in normal spiral galaxies from the rest of the Inter-Stellar Medium (ISM). These authors argue that molecular clouds are known to have a roughly constant surface density and pressure (and then dynamical time, see Solomon et al., 1987), so they are not in pressure equilibrium with the rest of the ISM and their consumption time results to be Gyr (Bigiel et al., 2008), irrespective of the molecular gas surface density computed on kpc scale. This last quantity is indeed to be considered as a measure of the filling factor of molecular clouds. The decoupling breaks at higher gas surface densities, where the ISM is able to pressurize the molecular clouds so that their dynamical time scales again with the inverse of the square root of the density at kpc scales. In this regime the molecular SK takes values more similar to the canonical 1.4 one.
The evidence of a double standard (or molecular) SK at high redshift has only been proposed very recently. Teyssier et al. (2010) have presented a hydrodynamic simulation, performed with the AMR RAMSES code (Teyssier, 2002), of two merging galaxies resembling the Antennae. They found that, when the force resolution reaches values as small as 12pc, the predicted standard SK is boosted and reaches the relation found by Daddi et al. (2010) to hold for ULIRGs and SMGs. However, the authors do not show a simulation, run at the same resolution, of the equivalent of a BzK galaxy that lies on a relation one order of magnitude lower.
A second way of expressing a “star formation law” is by correlating the surface density of SFR with divided by the gas orbital time . This dynamical SK was suggested by Wyse & Silk (1989), Silk (1997) and Elmegreen (1997) to be more “fundamental” than the standard SK, on the basis of the influence that disc rotation and shearing exert on star-forming clouds. It has attracted less attention than the standard SK, and in most cases it has been reported as equally acceptable from the observational point of view (e.g. Kennicutt, 1998). More recently, Tan (2010) tested against observations of local galaxies the hypothesis of a linear standard SK compared to several other proposals of star formation “laws”. He found that data do not favour this linear hipothesis. At higher redshift, Daddi et al. (2010) noticed that the dicothomy in the molecular SK of normal and IR-bright galaxies disappears when the dynamical SK is considered.
The nature of the SK relation and its environment-dependent nature is of fundamental importance in the field of galaxy formation, because SK-like relations are widely used in models to predict the amount of stars formed in a star-forming galaxy. In particular, in many N-body hydrodynamic simulations (see, e.g. Katz et al., 1996) the SFR of gas particles or cells is computed as , where is an efficiency and the dynamical time is computed on the average density of the particle. In many of the most recent simlations of galaxy formation it is assumed that the SFR obeys by construction a standard SK law with a cut at low density (e.g. Springel & Hernquist, 2003). Schaye & Dalla Vecchia (2008) showed that this is equivalent to assuming an effective equation of state for star-forming particles of the kind . Only higher-resolution simulations, resolving scales below 50 pc, are able to follow the formation of molecules (Pelupessy et al., 2006; Pelupessy & Papadopoulos, 2009; Robertson & Kravtsov, 2008; Gnedin et al., 2009) and then to predict molecular fractions and kpc-averaged SK relations, but the cost of these simulations makes it very hard with presently available facilities to push even one of them to in a full cosmological context.
One exception in this sense is given by the muppi model (MUlti-Phase Particle Integrator; Murante et al., 2010, hereafter paper I), based on a sub-resolution multi-phase treatment of the star-forming gas particles and developed within the gadget TreePM+SPH code (Springel, 2005). In this model, the star formation rate is not forced to follow a SK-like relation, so its adherence to this law is a prediction of the model. The details of the model are described below, but two points are worth mentioning. First, inspired by the observational result of Blitz & Rosolowsky (2006), the molecular fraction of the cold component of a gas particle is scaled with the hydrodynamic pressure of the SPH particle. Second, the multi-phase treatment allows thermal feedback from SNe to efficiently heat the gas. In paper I, free parameters were tuned to reproduce the observed SK relation in the case of an isolated spiral, Milky Way-like galaxy. We noticed that the SK relation traced by an isolated low surface brightness dwarf spiral galaxy differs from the Milky Way one in the same way as spirals and dwarfs differ in the data of Bigiel et al. (2008).
In this paper we show the SK relations resulting from a set of muppi simulations of isolated halos, including the ones used in paper I. The value of this analysis is not only to present the results of a specific model but also to understand how the SK relations depend on galactic environment when the disc is heated by feedback and the molecular fraction is scaled with pressure and does not depend on metallicity. Section 2 describes the muppi model and the initial conditions used for our simulations. Section 3 presents the resulting SK relations. Interpretation of results requires an assessment of the vertical structure of simulated discs, presented in Section 3.2. Section 3.3 is devoted to a discussion of the dynamical SK relation. Section 4 gives a discussion of present results in comparison with available literature, while Section 5 presents the conclusions.
2 Simulations
| Name | softening | gas | ||||||||
|---|---|---|---|---|---|---|---|---|---|---|
| (kpc) | (M⊙) | (M⊙) | (M⊙) | (M⊙) | (kpc) | (M⊙) | (M⊙) | (kpc) | fraction | |
| MW | 0.69 | % | ||||||||
| MW_HR | 0.41 | % | ||||||||
| DW | 0.42 | % | ||||||||
| SH | 0.042 | % |
The main properties of the simulated galaxies used in this paper are reported in Table 1.
The first set of initial conditions is the one used in paper I, and were generated following the procedure described in Springel (2005). They are near-equilibrium distributions of particles consisting of a rotationally supported disc of gas and stars and a dark matter halo. For MW and MW_HR a stellar bulge component is included. Bulge and halo components are modeled as spheres with Hernquist (1990) profiles, while the gaseous and stellar discs are modeled with exponential surface density profiles. To start from a relaxed and stable configuration, we first evolve the galaxy models for 10 dynamical times with non-radiative hydrodynamics. We then use the configurations evolved after 4 dynamical times as initial conditions for our simulations. To test the effect of resolution on the SK relations, the MW galaxy is used also at a higher resolution (MW_HR).
The second set of initial conditions has been used by Springel & Hernquist (2003) for a resolution test of their star formation code. Gas particles are embedded in a M⊙ static NFW (Navarro et al., 1996) halo ( M⊙ with ), and rotate at a speed corresponding to a spin parameter of , radially distributed following Bullock et al. (2001). Gas is initially in virial equilibrium with the halo. When cooling is switched on, gas particles slowly coalesce into a rotating disc. With this simple setting it is possible to use very high force resolution, so that the vertical structure of the disc is well resolved. These initial conditions are available at four resolutions. We show results for only the highest one. We checked that results are very stable when the resolution is degraded.
In all cases we forced the SPH smoothing length of gas particles not to drop below of the Plummer-equivalent softening.
2.1 The model
muppi has been developed within a non-public version of the gadget2 Tree-PM+SPH code (Springel, 2005) that includes an entropy-conserving formulation of SPH (Springel & Hernquist, 2002). It has already been ported into the more efficient gadget3 code. All details are given in Murante et al. (2010), while we only describe here some relevant features of the muppi algorithm.
This model is inspired by the multi-phase analytic model of star formation and feedback by Monaco (2004b). A particle enters the multi-phase regime when its temperature is lower than a threshold (set to K) and its density, recast in terms of particle number density (with a molecular weight of ) is higher than 0.01 cm-3. This threshold is an order of magnitude lower than the commonly used value of cm-3, which is typically tuned to obtain a cut in the standard SK relation at a gas density M⊙ pc-2.
A multi-phase particle is assumed to be made up of three components: two gas phases and a stellar phase. The two gas phases are assumed to be in thermal pressure equilibrium. As in Springel & Hernquist (2003), the cold gas phase is assumed to have a temperature K, while the temperature of the hot gas phase is set by the particle entropy. Upon entrance into the multi-phase regime, all the mass is assumed to reside in the hot phase; cooling does not lead to a lowering of the temperature but to a deposition of mass in the cold phase. A fraction of the cold mass is assumed to be in the molecular form. Blitz & Rosolowsky (2006) (see also Leroy et al., 2008) found that the ratio between molecular and gas surface densities correlates with the so-called external pressure, which is the pressure expected at the galaxy midplane in the case of a thin disc composed by gas and stars in vertical hydrostatic equilibrium. This was estimated using a simplified version of the expression proposed by Elmegreen (1989):
| (1) |
Here is the ration between the vertical r.m.s. velocity dispersions of cold gas and stars (here denotes velocity dispersion while denotes surface density). The exponent of the correlation was found to be . Inspired by this finding, and adopting an exponent of 1 for simplicity, we use the following equation to estimate the molecular fraction:
| (2) |
Here is the hydrodynamical pressure of the SPH particle (different from the external pressure used in the observational correlation), and we adopt K cm-3 as in Blitz & Rosolowsky (2006).111We have checked that our simulations produce relations similar to the observational one (though with significant scatter) when pressure is estimated as in Blitz & Rosolowsky (2006).
The three components exchange mass through four mass flows: cooling, star formation, restoration and evaporation. Cooling is computed with a standard cooling function assuming zero metallicity. Thermal energy resides in the hot phase, so cooling is computed using its density, which is much lower than the average one. Star formation takes place in the molecular phase, with a consumption time-scale proportional to the particle dynamical time :
| (3) |
Here is the pressure-dependent molecular fraction of equation 2, is a parameter of star formation efficiency, determining the fraction of a molecular cloud that is transformed into stars per dynamical time, and the mass of the cold phase in the particle. The dynamical time is computed on the cold phase as soon as this collects 90 per cent of the total gas mass, and is frozen until the particle exits from the multi-phase regime (see paper I for a detailed discussion of this hypothesis). A thing is worth noticing in equation 3: because of the hypothesis of pressure equilibrium and constant temperature of the cold phase, is proportional to pressure ; at the same time, the fraction of gas mass in the hot phase is always very low, so is very similar to the fraction of total gas in molecular form. As a consequence, the particle star formation rate is primarily regulated by gas pressure (with the complication that is computed at the beginning of a star formation cycle and then kept frozen, while is computed at each time-step).
The SFR term of equation 3 deposits a fraction of the transformed mass into the stellar component, while a fraction , restored from massive stars in an Instantaneous Recycling Approximation (IRA), is given back to the hot phase. The formed stellar component is accumulated within the particle, and contributes to its inertia but not to its gas mass in all SPH computations. The evaporation rate is assumed to be due to the destruction of molecular clouds and amounts to a fraction of the SFR.
Production of star particles is done according to the stochastic star formation algorithm of Springel & Hernquist (2003) (see paper I for details). We allow for 4 generations of star particles to be spawned by each parent gas particle. Each new star particle is produced at the expense of the stellar component and, if needed, of the cold phase.
The three components of a multi-phase particle are of course assumed to be subject to the same hydrodynamical forces. To alleviate the effect of this unphysical assumption, and to mimic the destruction of a star-forming cloud after a few dynamical times (Monaco, 2004a), the code forces each particle to leave the multi-phase regime after two dynamical times , computed as specified above.
One SN is generated each of stars formed, and each SN generates erg of energy. Of the energy generated in the IRA, a small fraction is given to the local hot phase to sustain its high temperature, while a fraction is distributed to the hot phases of neighbour particles in a 60-degree wide cone anti-aligned with the gas density gradient. Energy contributions to particles are weighted by their distance from the cone axis, to mimic the expansion of SN-driven blasts along the least resistance path (McKee & Ostriker, 1977). The present version of the code distributes only thermal energy.
The assumption of a molecular fraction regulated by pressure (equation 2) is very important because it makes the evolution of the system intrinsically runaway: star formation generates SNe, energy feedback from SNe pressurizes the hot phase, the increase in pressure leads to an increase in molecular fraction and thus to an increase in SFR. The runaway halts when the molecular fraction saturates to unity. However, the dynamical response of the pressurized particle is able to limit this runaway through the expansion work done on neighbours. This intrinsic runaway behaviour, together with the long cooling times, are the main reasons for our efficient thermal feedback.
3 The SK relations in simulated discs
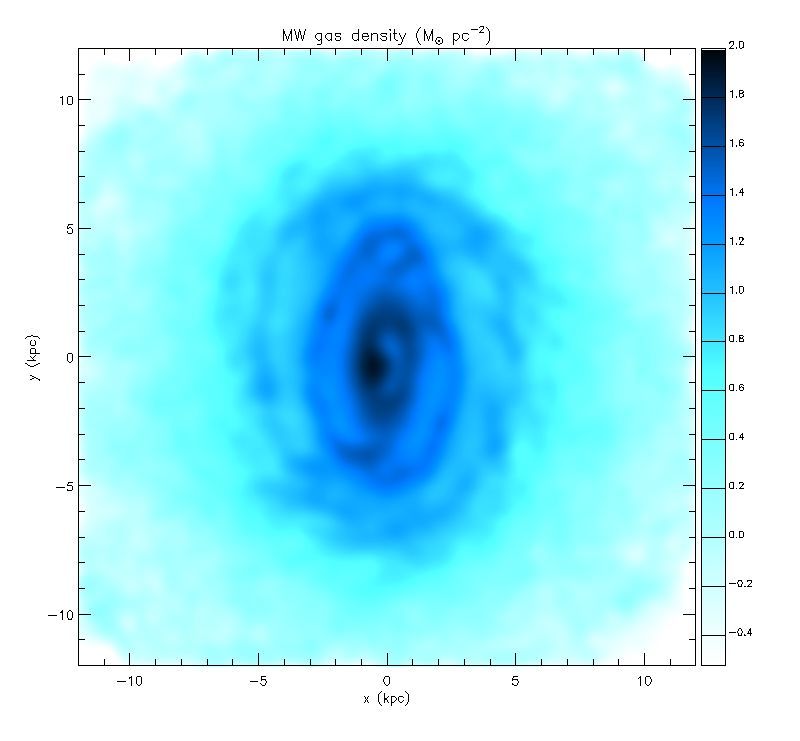
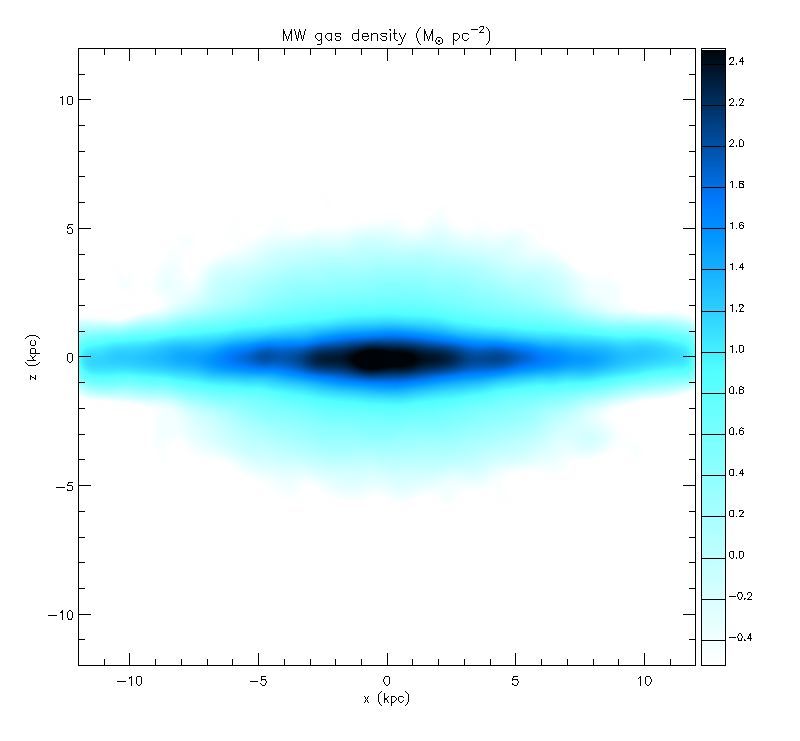
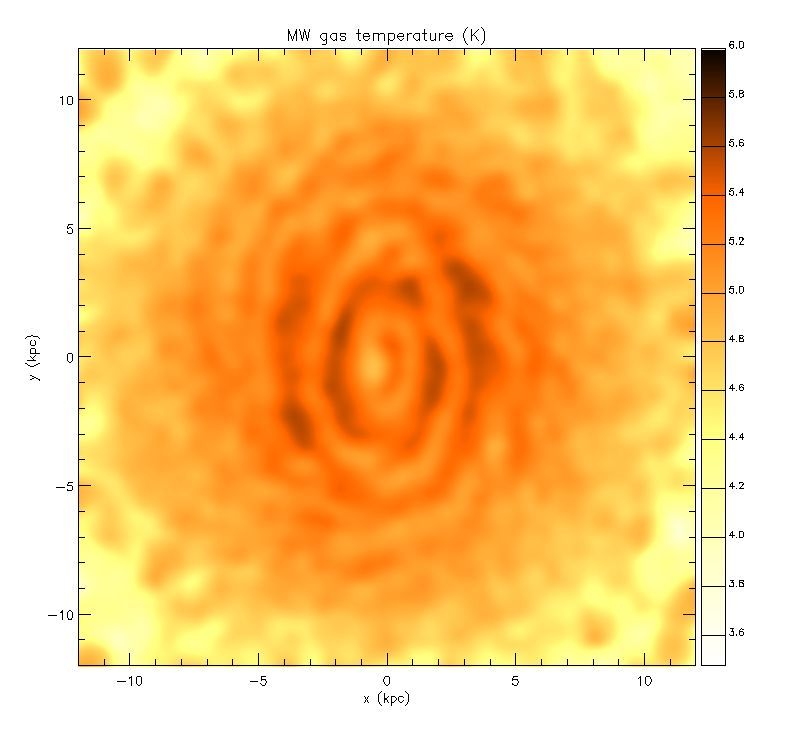
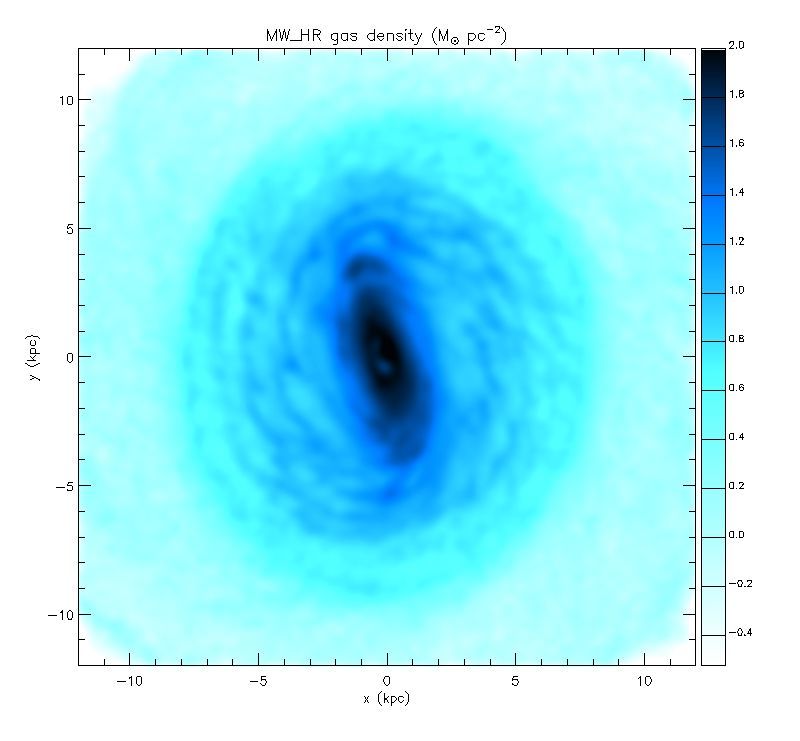
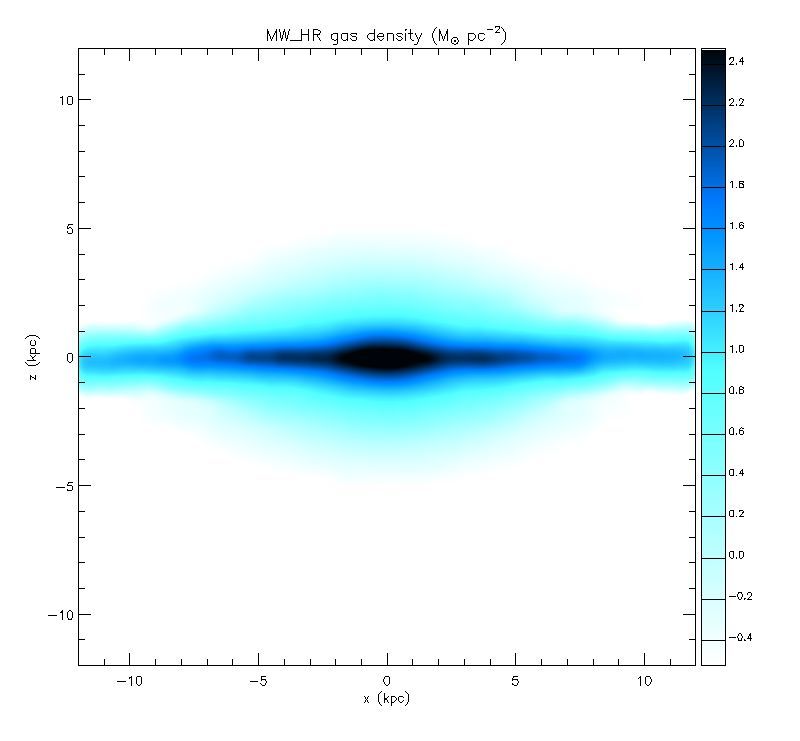
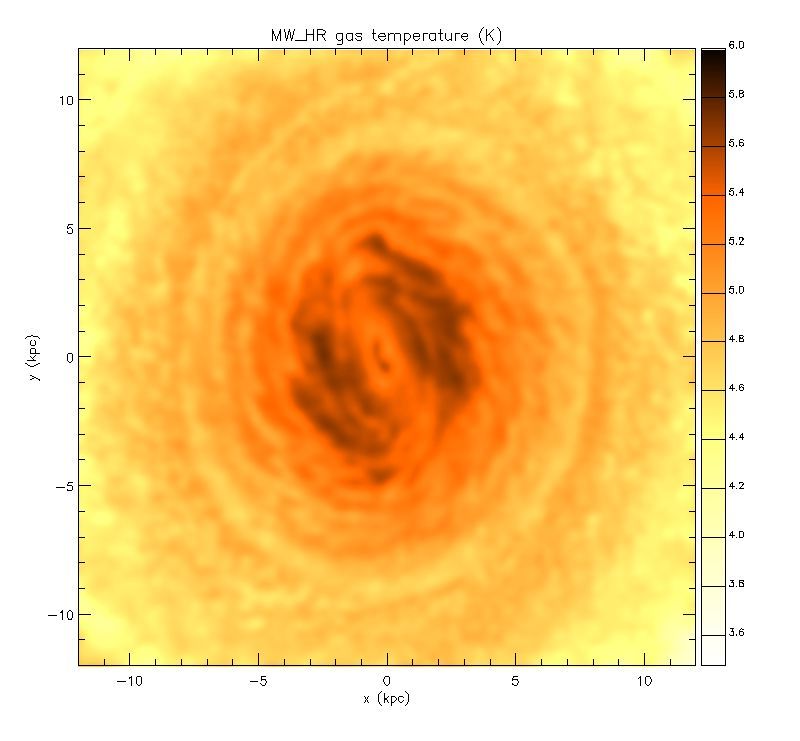
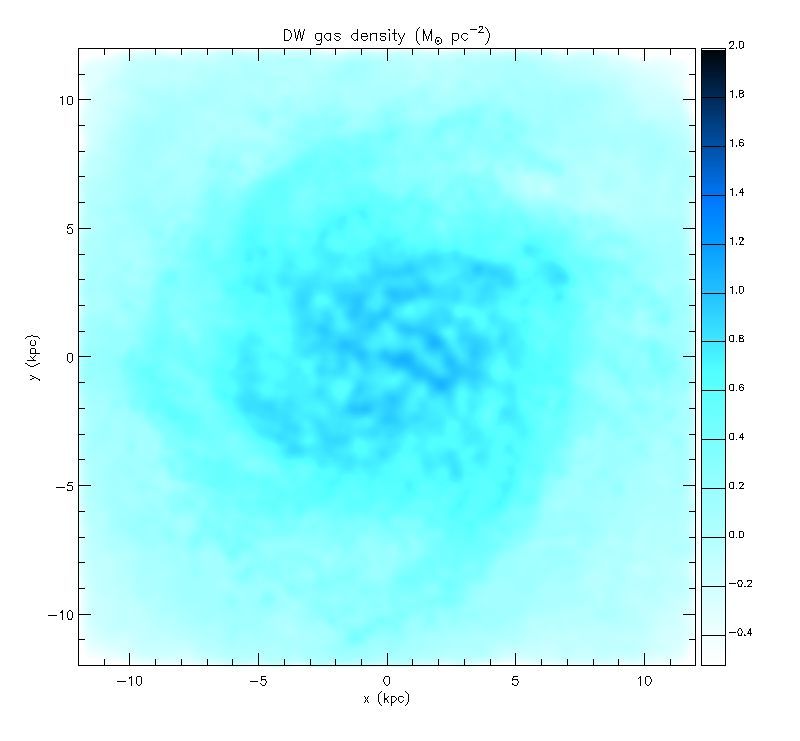
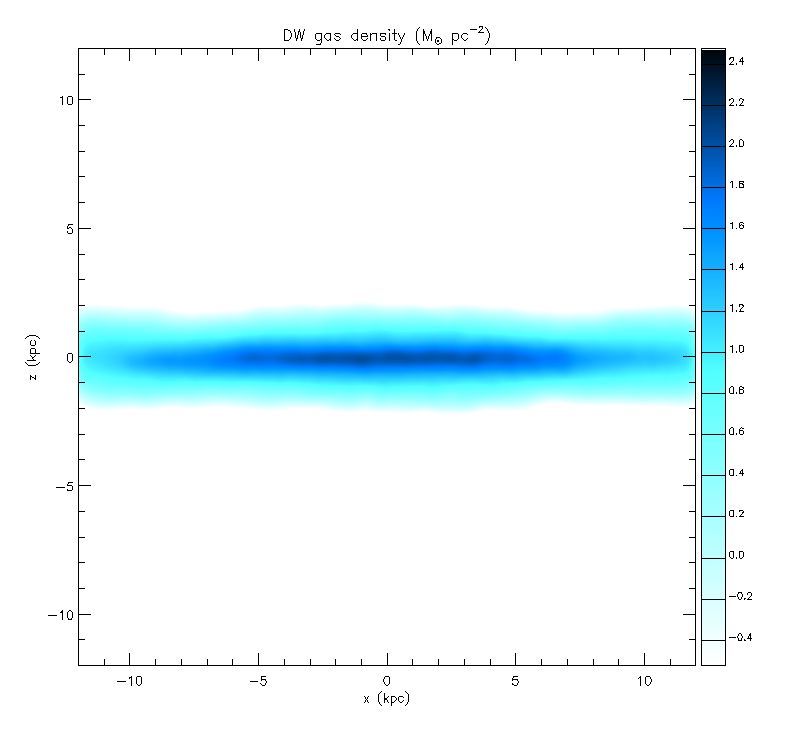
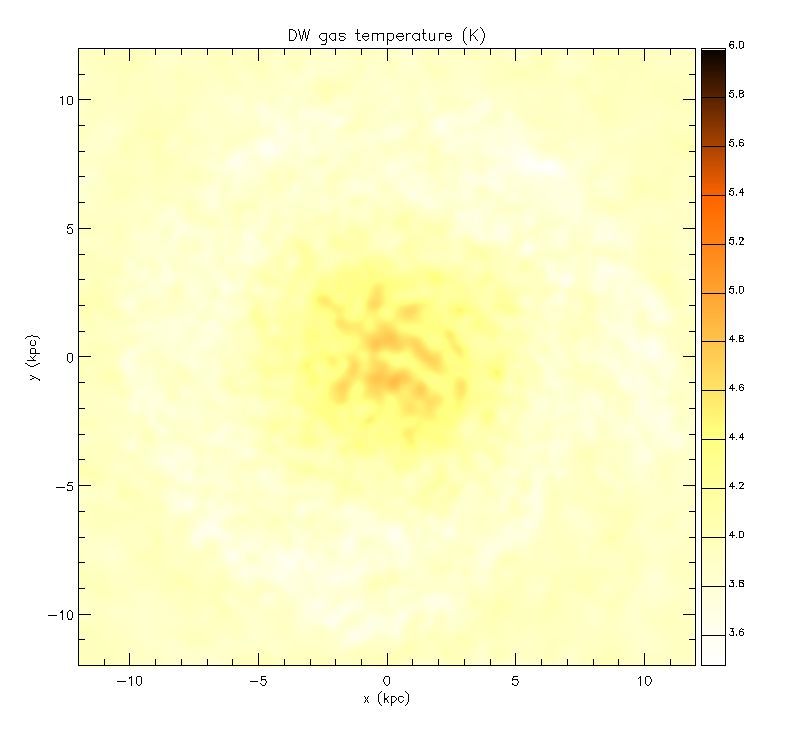
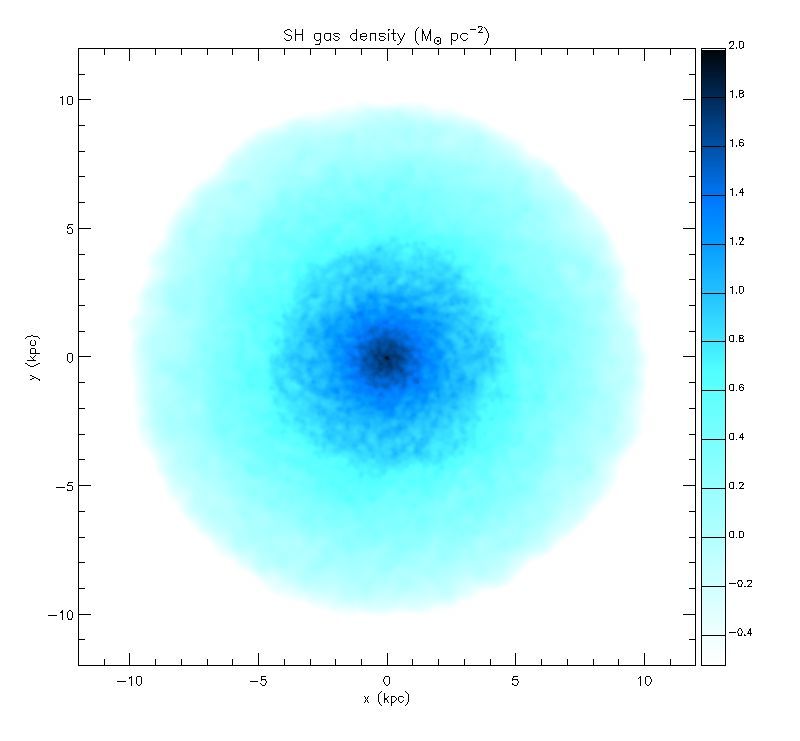
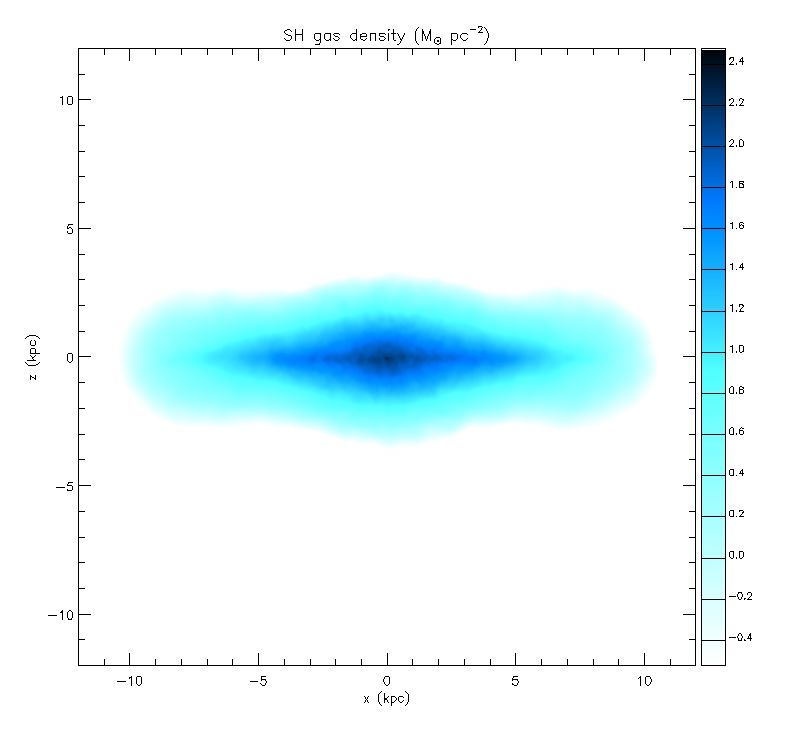
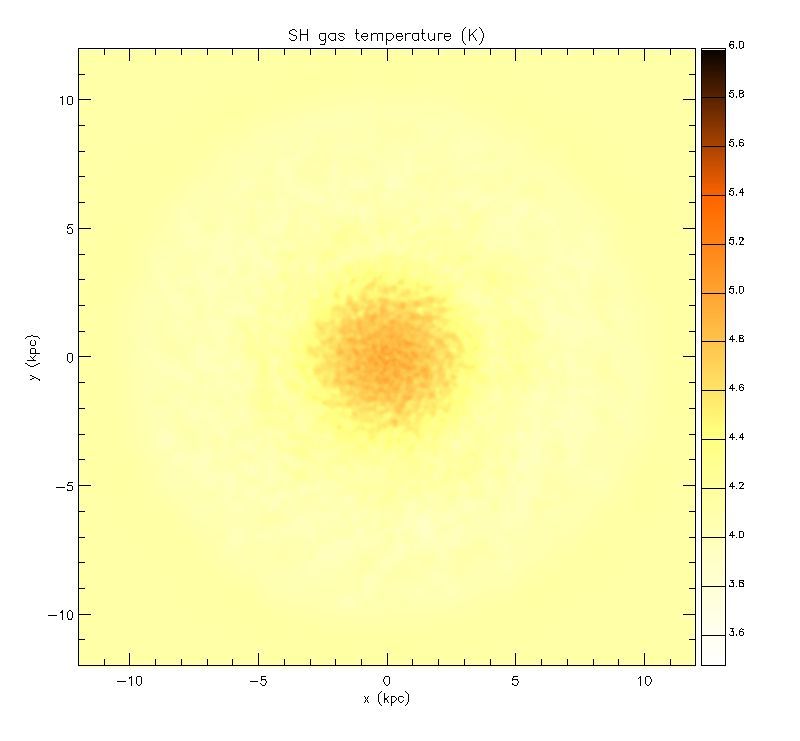
The first three simulations, the MW (at standard and high resolution) and DW test cases of paper I, start from already formed disc galaxies with 10 and 20 per cent gas fractions, and are shown at 0.5 Gyr, after the initial transients due to the switching on of stellar feedback have (almost) died out and while gas consumption is still negligible. The fourth simulation, the SH halo, forms in an isolated, static halo filled with rotating gas initially in virial equilibrium; we analyze the simulation at 0.7 Gyr, i.e. at the peak of its SFR, when the disc is still largely gas-dominated. In all cases, conclusions are unchanged when simulations are considered at other times. We show in figure 1 face-on and edge-on maps of gas surface densities and temperatures for the four simulations. It is interesting to notice that in the regions interested by star formation the discs (most of the MW and MW_HR discs and the inner few kpc of SH) are relatively hot and surrounded by thick coronae of gas heated by feedback and circulating above or below the disc in a galactic fountain. The effect of star formation on the DW galaxy is much less evident.
3.1 The standard, HI and molecular SK relations
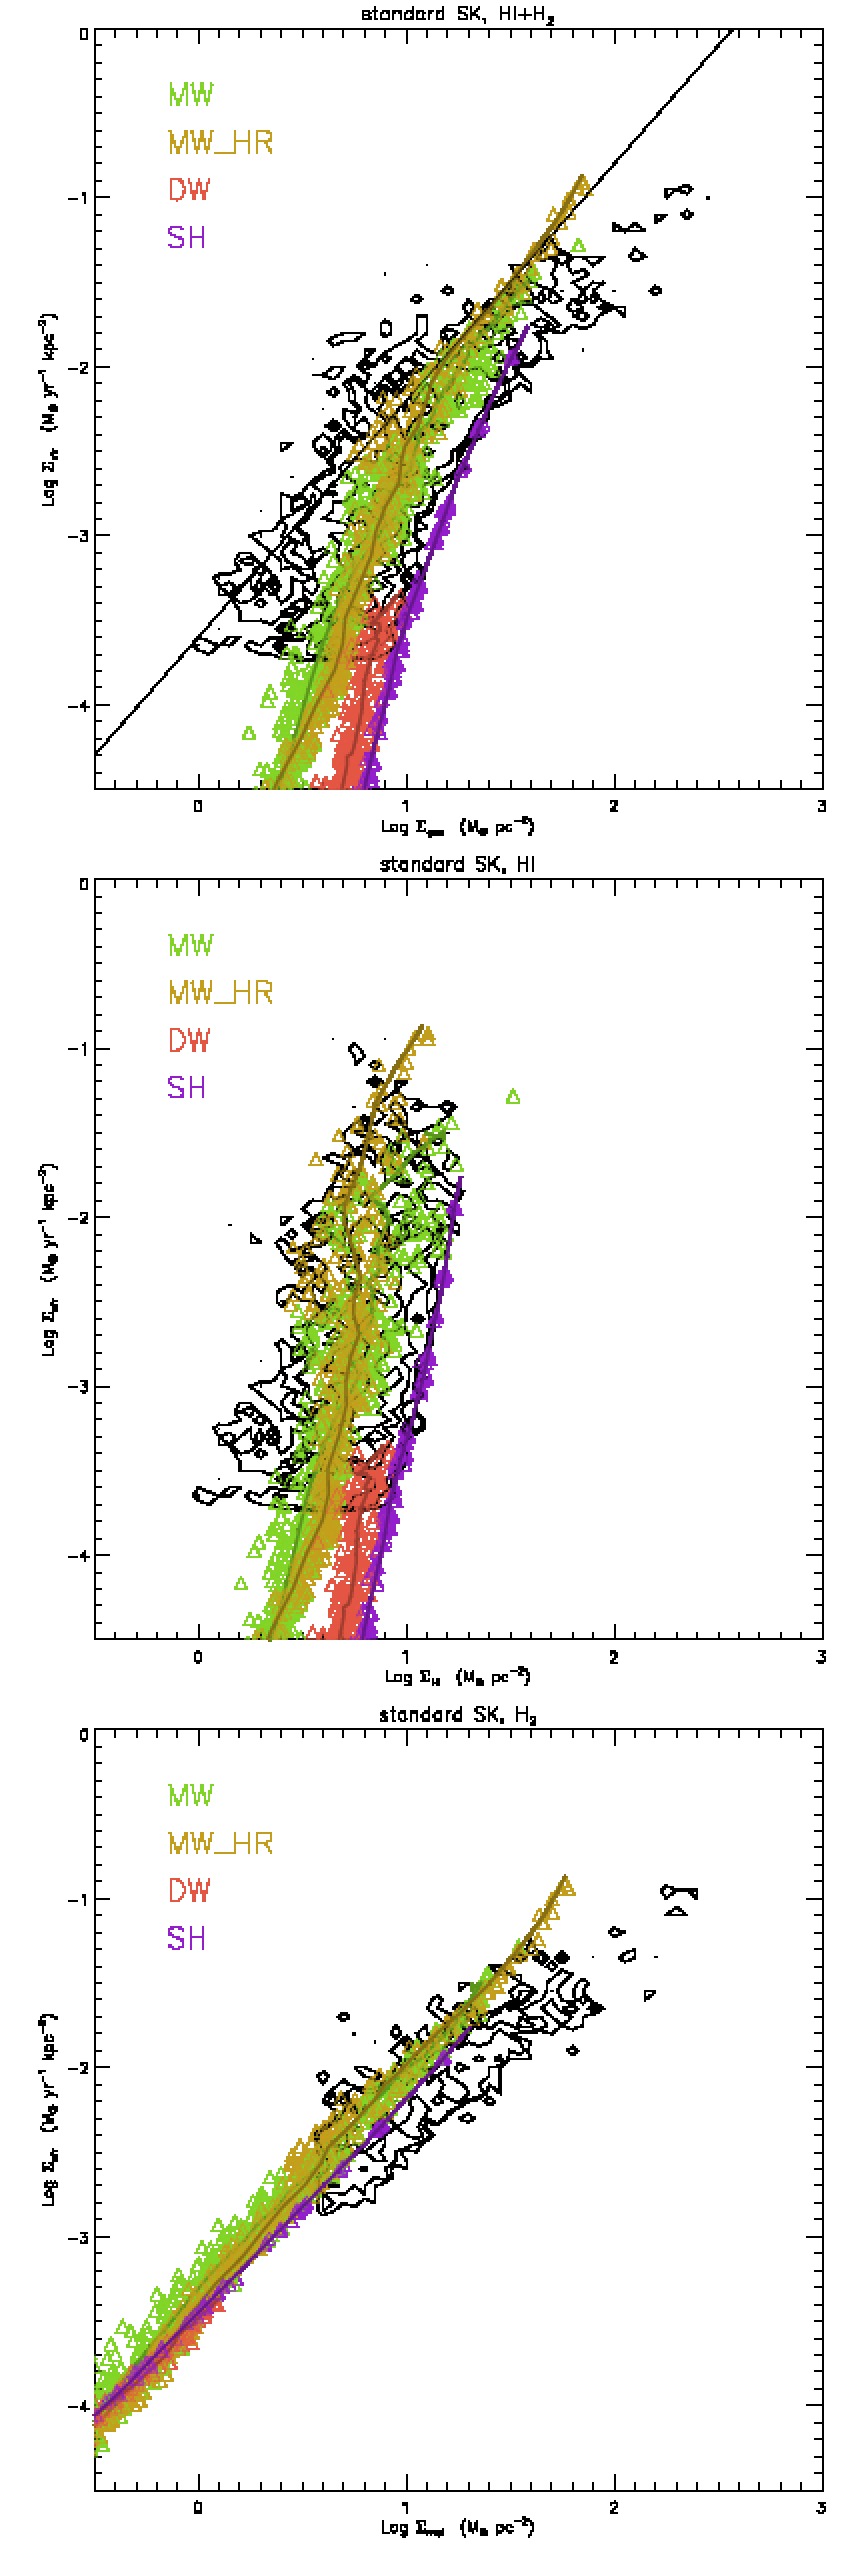
Figure 2 shows the standard, HI and molecular SK relations of the four simulations, compared with the data of Bigiel et al. (2008) for normal spiral galaxies. Gas surface densities are always meant to include contribution from helium. In the upper panel the thin line represents the fit proposed by Kennicutt (1998). Simulations have been processed as follows. Our analyses are restricted to cold gas; in this paper by cold gas we mean the cold phase of multi-phase particles plus all single-phase particles colder than K. The molecular gas surface density is computed using the molecular fraction of equation 2, applied only to multi-phase particles; HI gas is just cold minus molecular gas. A galaxy frame is defined by the inertia tensor of stars and cold gas, the z-axis corresponding to the largest eigenvalue. The angular momentum of the same particles is always found to be at most a few degrees off the z-axis. Then, radial surface densities (in cylindrical coordinates) of (cold, HI, molecular) gas and SFR are computed; these are reported in the figure as colored thick lines. The same quantities are computed on a square grid in the x-y plane, with bin size of 750 pc, as in the Bigiel et al. (2008) paper; these are reported as triangles, with the same color as the corresponding thick lines.
The following points are apparent from the figure: (i) the simulations trace different SK relations when the total or HI gas are used. (ii) These different relations correspond to different transitions from HI- to molecular-dominated gas, or equivalently to different saturation values of . (iii) The differences go in the direction highlighted by Bigiel et al. (2008), Bolatto (2009); Bolatto et al. (2011) and Bigiel et al. (2010) of a higher saturation in dwarf galaxies. (iv) The molecular SK relation is much tighter; also, it is steeper than the Bigiel et al. (2008) one and consistent with Liu et al. (2011). (v) The scatter around the SK relation is generally smaller than the data, especially for the SH simulation. (vi) As for the MW and MW_HR simulations, the SK relation is rather stable with resolution; this is confirmed by applying the same analysis to the SH halo at lower resolution.
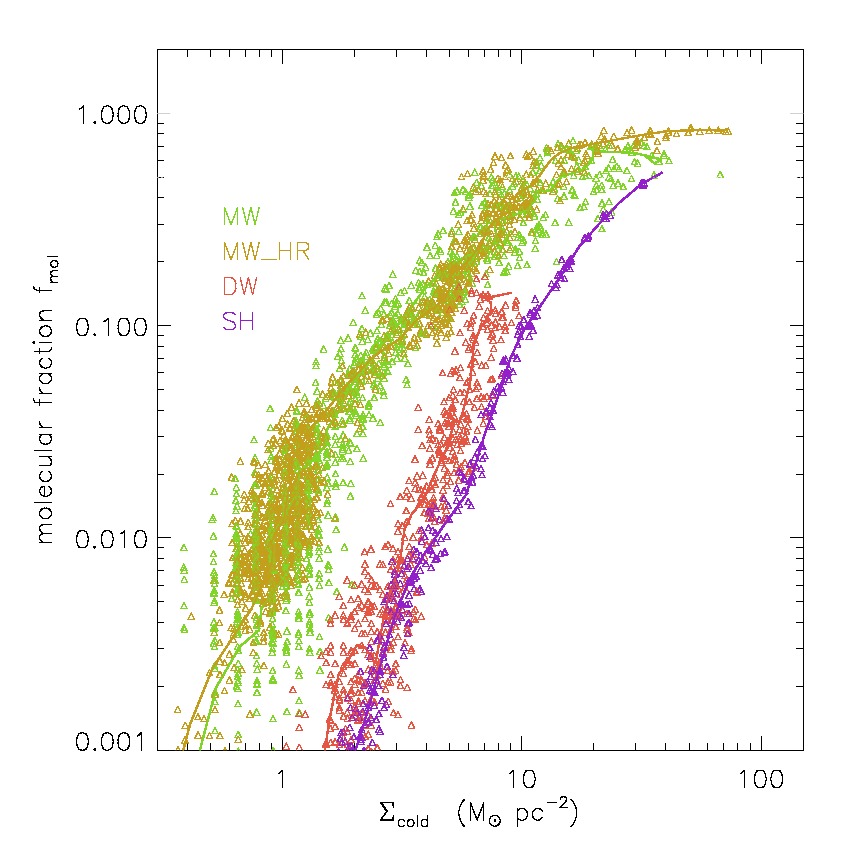
To better quantify the difference between the simulations, in figure 3 we show the relation between surface density and molecular fraction , a quantity that is directly comparable with data. The value at which the molecular fraction is ranges from 10 M⊙ pc-2 of MW to 35 M⊙ pc-2 of SH. This is in agreement with the measures of the Large Magellanic Cloud, though more extreme cases like the Small Magellanic Cloud are not recovered (Bolatto 2009; Bolatto et al. 2011; Fumagalli et al. 2010, see also references in).
As pointed out by Fumagalli et al. (2010), if the molecular SK is the “fundamental” relation then a pressure law for the molecular fraction results in an environment-dependent standard SK. This is true because, as evident in equation 1 for pressure in the case of vertical hydrostatic equilibrium, this quantity depends not on gas surface density alone (the quantity in the x-axis of the standard SK) but on gas and stellar surface densities, the latter being multiplied by the ratio of gas and star vertical velocity dispersions (see also Shi et al., 2011). In other words, the cut in the standard SK is determined by the (velocity-weighted) gas fraction. So our result is easy to interpret as long as hydrodynamic pressure of our discs scales with gas fraction in a similar way as the external one. It is worth noticing at this point that our simulated galaxies have gas fractions ranging from low to very high values, so they span most of the interesting range for this quantity.
However, the validity of equation 1, obtained in the case of gas in vertical hydrostatical equilibrium, must be checked in our simulations where energy is continually injected in discs. This is done in next sub-section.
3.2 Vertical structure of simulated discs
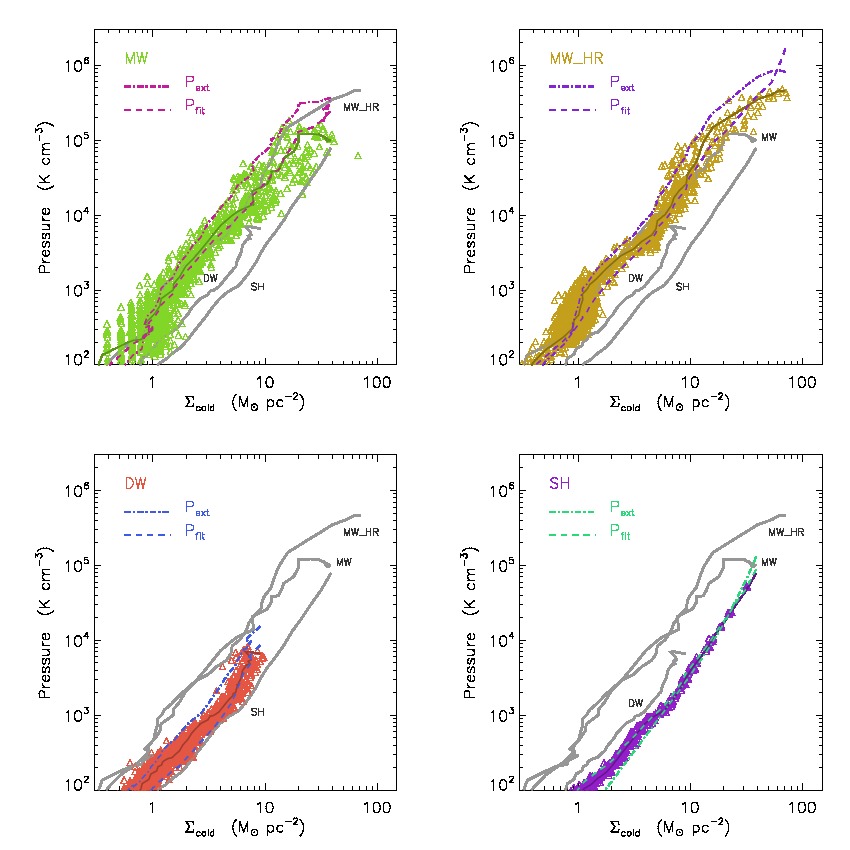
In figure 4 we report, for the four simulated galaxies, the relation between pressure and as found in the simulations. We show in each panel the hydrodynamical pressure found in simulations, , averaged in bins of the x-y grid as colored triangles, and the radial profile of the average of the same quantity as a line with a darker color. The external pressure is computed using equation 1 from the radial profiles (colored dot-dashed lines). Moreover, to ease the comparison, each panel reports, as grey thick lines, the radial relations from the other simulations. To obtain , vertical velocity dispersions of cold gas and star particles have been computed in the galaxy frame. For the stars, this quantity is equated to , while for the gas we use:
| (4) |
where is the gas sound speed, computed on the average particle temperature and density. Figure 4 shows that the relation between and varies in a very similar way as that between and . This confirms the validity of our interpretation for the environmental dependence of the standard SK. However, external and simulated pressures show significant dicrepancies that are worth addressing.
These discrepancies may be related to the fact that we are comparing the expected midplane pressure with the average one over the whole disc height. While for barely resolved discs the two quantities cannot differ much, the SH simulation allows us to test to what extent midplane and average pressures are comparable. As a matter of fact, particles in the midplane show a broad range of pressures, because the accumulation of cold mass at the beginning of a star formation cycle causes a depressurization by one order of magnitude, while successive star formation re-pressurizes the star-forming particles. As a result, pressure does not show a smooth decrease with height on the disc, and the (mass-weighted) average of pressure over the disc height is always very similar to the midplane one. A similar trend was found by Tasker & Bryan (2008), using a much better resolution, when energy feedback from SNe is considered.
We noticed that in our simulations the ratio of true pressure and , computed the first in radial bins and the second from radial profiles, correlates well with the Toomre parameter of the disc, computed at the same radius. For a disc made of a single component with surface density and velocity dispersion , we have , where is the epicyclic frequency and the rotation curve. Being our discs composed by stars and gas, we compute the disc total Toomre parameter by using the simple approximation of Wang & Silk (1994), that is correct for our discs characterized by relatively high velocity dispersions (Romeo & Wiegert, 2011):
| (5) |
It is easy to show that .
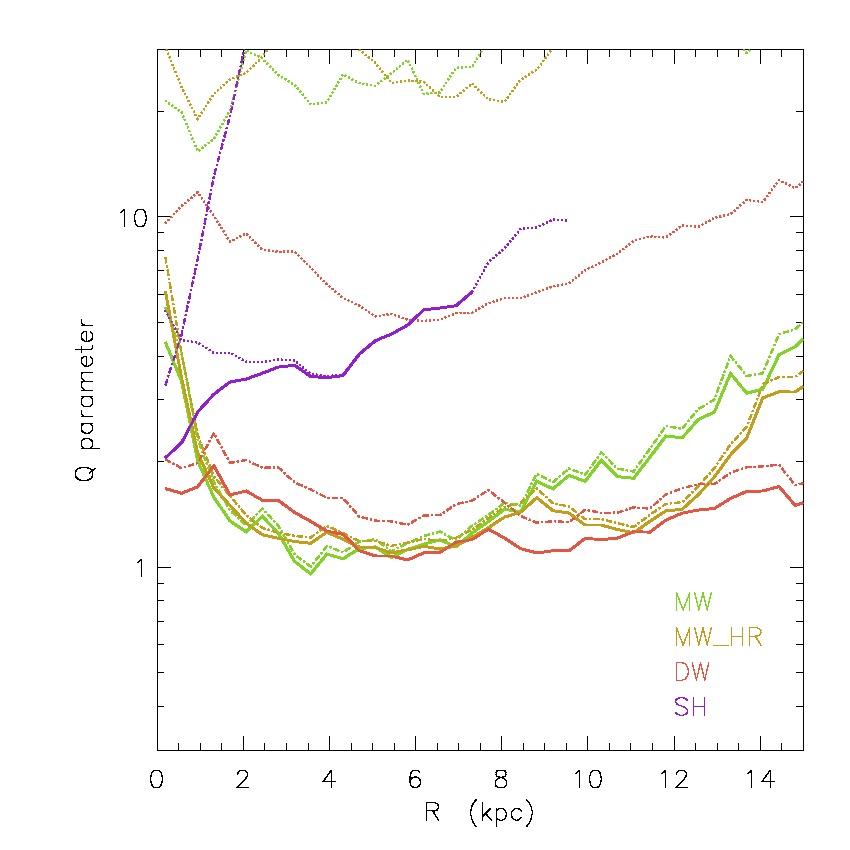
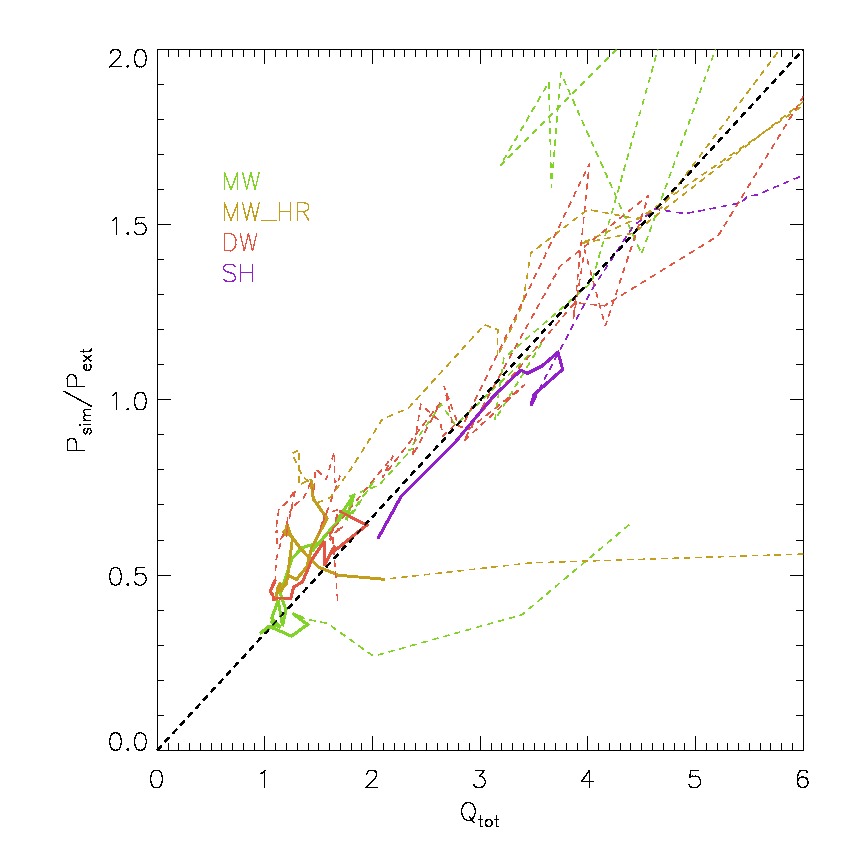
Figure 5 shows for our four simulations and at all radii the relation between and the ratio . The most interesting regions with M⊙ yr-1 kpc-2 and radius larger than two softening lengths have been highlighted as thick continuous lines. The two quantities show a linear correlation that is well fit by ; the round number 3 adapts well to the SH simulation where the vertical structure of the disc is fully resolved. Then, a much better fit to the relation is given by:
| (6) |
The second equality is obtained using equations 1 and 5. is shown in figure 4 as dashed lines; it gives a much better approximation to the relation, with some discrepancy for the DW galaxy at M⊙ pc-2, where is anyway very low. We checked the validity of by comparing it to the pressure profile of many versions of our galaxies, obtained in our tests by varying model parameters and assumptions. In particular, we tested changes in the computation of dynamical time used in equation 3 in several ways, e.g. by equating it to the average one at entrance into multi-phase or by recomputing it at each time-step. We found in all cases that equation 6 always gives a good fit to pressure, with significant discrepancies found only at very low pressure. Therefore we consider this result to be independent of details of our sub-resolution model. Presently, we have no analytical explanation of why multiplying the external pressure by gives a better fit to the average SPH pressure in our simulations. We interpret equation 6 as the quasi-equilibrium pressure of a disc with continuous injection of energy from SNe: hotter discs, with high , are characterized by higher pressure than , while marginally stable discs have a lower pressure by a factor up to (a similar result was found by Koyama & Ostriker 2009, see section 4 for more details).
More insight on the vertical structure of the disc can be obtained by analysing the quantities and , that enter in the computation of .
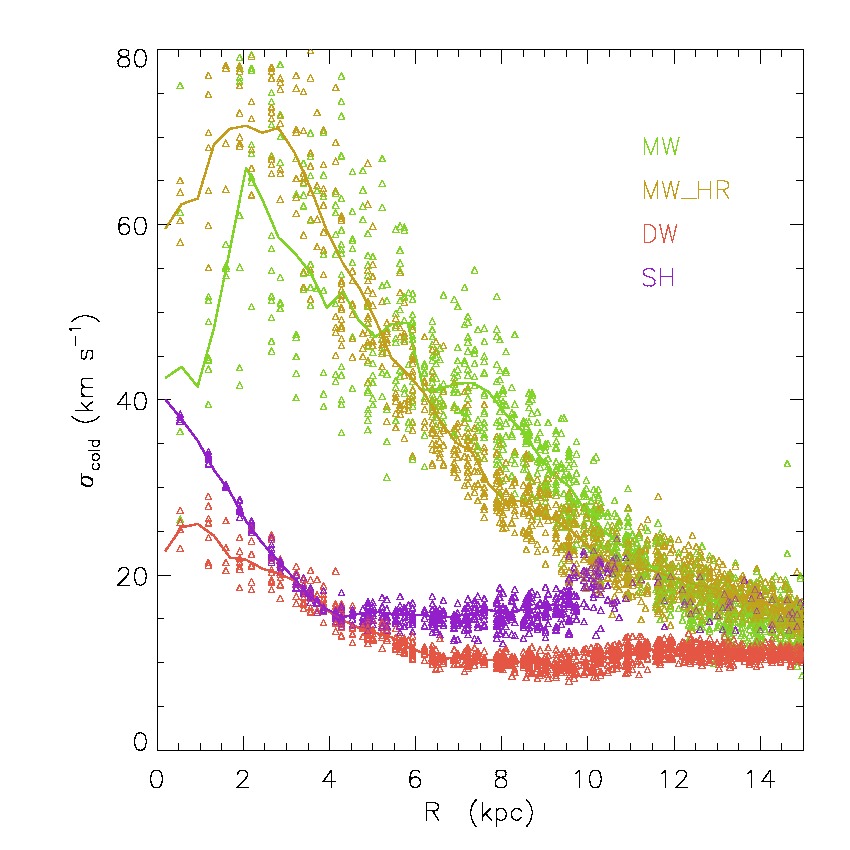
Figure 6 shows the values of gas vertical velocity dispersions for the four galaxies, computed both on the 750 pc grid and in radial profiles. Clearly the assumption of a constant velocity dispersion, often made in the literature to represent this quantity, is a poor approximation of our results. Moreover, these velocities are much higher than the km s-1 usually assumed for galaxy discs.222This quantity includes contribution from the thermal energy of the hot phase, so it is not directly comparable to observations. We will return on this in section 4.
The values of the Q parameters for the four simulations are shown in figure 7. was computed as in equation 5, the same parameter was computed only for gas and stars as (where is either cold or ), and its values are reported in the figure with dotted and dashed lines, respectively. The MW and DW discs have in the central, star-forming regions, while assumes higher values. is very high, ; this quantity cannot be directly compared with observations of cold gas, because the main contribution to comes from the sound speed, that is determined by the thermal energy of the hot phase of multi-phase particles. If the sound speed is neglected, we obtain . With this caveat, these values of the Toomre parameters are in very good agreement with what found by Leroy et al. (2008) in nearby galaxies, where is just above unity while and especially take up higher values. At the same time, the gas-dominated SH disc is much more stable and kinematically hot. As a conclusion, while our stellar-dominated discs tend to regulate to keep , this is not a general rule.
As a further test, we run our simulations, starting from the same four sets of initial conditions but using the effective model of Springel & Hernquist (2003), that is known not to provide efficient thermal feedback. We obtained colder discs, with higher parameters and hydrodynamical pressure not well fit either by or by our equation 6. The resulting standard SK relation is in line with that originally found by Springel & Hernquist (2003): it lies on the Kennicutt (1998) relation above 5 M⊙ pc-2, and cuts below that threshold, not following the mild steepening found in data. This surface density threshold somehow depends on the galaxy: we find it at 3, 4.5 and 6 M⊙ pc-2 for the MW, DW and SH simulations. This dependence is easy to understand: the cut is determined by the imposed volume density threshold for star formation. Since disc temperatures do not vary much (especially in these colder discs) the relation between volume and surface density of gas scales similarly to that between pressure and surface density. Of course no prediction can be made in this case for the HI and molecular SK. We conclude that a simple volume density threshold for star formation, used in conjunction with an ineffective feedback scheme, gives a standard SK with environmental dependence that goes in the same direction as the one presented in this paper, but cannot reproduce the data at the same level of detail.
3.3 The dynamical SK
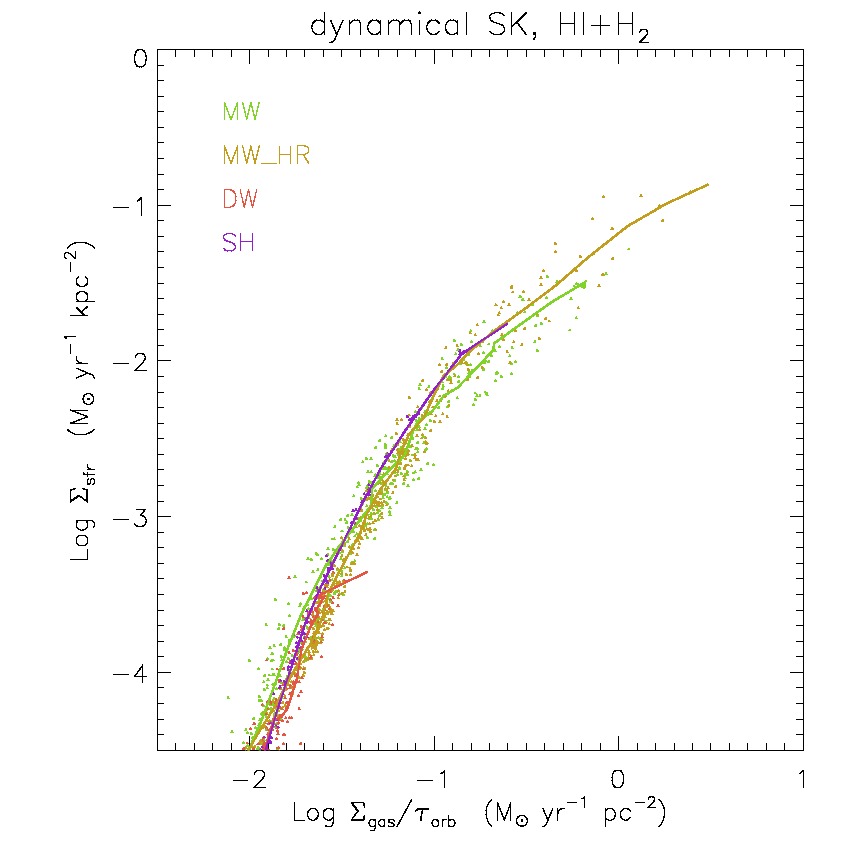
Figure 8 shows the dynamical SK of our four simulations. Unfortunately, a dataset like that of Bigiel et al. (2008) is unavailable for this relation; most observations give global estimates of galaxies. As a consequence, we do not compare this relation with data in this paper.
Remarkably, the four simulations, that produced different standard SK’s, now trace a unique, non-linear relation, with a scatter that is even lower than that in the molecular SK. To make this equality more evident, we decrease the point size of the grid-based relation to let radial profiles be more visible.
It is easy to show, using equations 1 and 5, that a “universal” dynamical SK relation, valid for all galaxies, can be obtained under the following simple assumptions: (i) the disc is in vertical hydrostatic equilibrium, so that pressure is well represented by ; (ii) the disc is marginally stable, with a Toomre parameter equal to 1; (iii) the velocity dispersion of gas is constant for all galaxies; (vi) the rotation curve is flat so that ; (v) SFR is a function of pressure. But we have shown above that the first three conditions don’t hold for our discs, so this simple interpretation cannot be valid here. On the other hand, we noticed that our simulated discs are rather hot when we take into account the effective temperature of gas particles, which is determined by the thermal energy of the hot phase. In the following we demonstrate that the dynamical SK can be interpreted as the result of the balance between energy injection and dissipation, without assuming that SFR is directly influenced by disc rotation.
Energy is continually injected by SN feedback and lost by radiative cooling and viscous dissipation. The equilibrium among these processes can be illustrated with the help of a simplified approach that quantifies the energy made available to gas particles, in both kinetic and thermal form, after cooling has radiated away a part of it. Injection of kinetic and thermal energy can be expressed as (see also equation 14 of paper I):
| (7) |
where the constant takes account of the energy made available for feedback by muppi and is an efficiency parameter that quantifies the fraction of injected energy that is not radiated away by cooling. This injected energy is then transformed by expansion into kinetic energy and is later dissipated by viscosity333 The fact that in our simulations viscosity is the numerical one included in our SPH code is at this stage immaterial, as long as this behaves similarly to dissipation of turbulence that would take place if the resolution were adequate to describe it. ; this keeps the disc in a quasi-stationary state. For a disc of height , disc energy will likely be dissipated on one disc height crossing time, . Notably, this is the same rate at which turbulence is dissipated, as long as the driving length of turbulence is the size of the typical SN-driven bubble (e.g. Mac Low, 2003), which must be if bubbles die by blowing out of the disc (see also Monaco, 2004b).
Let’s define the surface density of energy in the disc as:
| (8) |
where we assume equipartition between the three translational degrees of freedom. Then the energy dissipation rate is:
| (9) |
In the definition of effective disc height the midplane density can be substituted with pressure using the equation of state . Using equation 6 for the pressure, it is easy to show that:
| (10) |
It then follows that:
| (11) |
In a stationary system, the effective energy injection will equate dissipation, so that . This implies that:
| (12) |
or, using the approximated value of :
| (13) |
This relation allows us to recast the interpretation of a unique dynamical SK relation in terms of energy injection: it will hold as long as, at fixed , the post-cooling efficiency of energy injection scales with the square of the gas vertical velocity dispersion, i.e. the gas specific energy. This can be seen in the other direction: the specific energy of the gas must scale with the fraction of specific thermal energy that has time to perform work before cooling radiates it away, . This is a property that arises naturally from our sub-resolution feedback model, at least for values of free parameters that do not widely differ from the fiducial ones selected in paper I; as in the case of pressure, we tested the validity of this result with a large suite of muppi simulations on the same sets of initial conditions, and many combinations of parameters and physical assumptions. The result of an environment-dependent standard SK and a unique dynamical SK holds in all cases where a disc efficiently heated by feedback and in a stationary state is obtained.
According to our interpretation, the fact that our four simulations all lie on the same dynamical SK is no evidence that SFR is directly determined by galaxy rotation, at variance with the motivation that has been used to introduce this relation. To make this more clear, the dispersion rate of energy given in equation 9 can be written, without loss of generality, as . Pressure in our simulations is well reproduced by equation 6, that depends on the kinematical state of the disc through , and then on . As a result, the dynamical stationarity of the disc induces a dependence of SFR on the epicyclic frequency, i.e. on the orbital time. So, the fact that our four simulations all lie on the same dynamical SK is telling us that they are stationary discs kept out of vertical hydrostatic equilibrium by SN feedback, and not that their SFR is directly determined by rotation or shearing - it is only indirectly influenced by it through the dependence of pressure on . Indeed we noticed that some of our simulated discs stay out of this dynamical SK, and this happens when, e.g., a bar instability takes place. In this case the condition of stationarity is violated until a new equilbrium configuration is reached. So these discrepancies confirm our interpretation that simulations trace a unique dynamical SK as long as they are in a stationary condition.
When run with the effective model of Springel & Hernquist (2003), the three galaxies (MW, DW, SH) show similar but not unique dynamical SK, the differences being comparable to those in the standard SK (section 3.2). This is a result of inefficient thermal feedback in this model: as long as pressure is not well fit by equation 6 and the injection of energy is marginal, we do not expect galaxies to lie on a unique dynamical SK.
4 Discussion
One result of this paper is that our pressure-based model of star formation produces a standard SK with a knee at a gas surface density that depends on gas fraction in a way that resembles the metallicity dependence proposed by Krumholz et al. (2009b) and Gnedin & Kravtsov (2010). If the molecular fraction is regulated by pressure, gas-rich galaxies become dominated by molecular gas at higher gas surface densities. It is easy to show that the gas surface density at which equates , which we call , scales with the gas fraction , as:
| (14) |
Here is the normalization of equation 2. In most chemical evolution models, is related to metallicity; for instance, in the simple closed-box model, , where is the metal yield per stellar generation. Then, a pressure-based molecular fraction can mimic a metallicity dependence. But the maximum value of is reached for , in which case ; this is the value of the SH simulation, that has a 99 per cent gas fraction. According to Bolatto (2009), for the Large Magellanic Cloud is similar to 34 M⊙ pc-2, while for the Small Magellanic Cloud it is 100 M⊙ pc-2. This is confirmed by a quick comparison with Krumholtz et al’s model: an increase in by a factor of 3, as large as the difference between MW and SH, is obtained by a decrease of metallicity by a similar factor, which is relatively modest. The same conclusion can be reached by considering the saturation value, that reaches M⊙ pc-2 for our SH disc while, for instance, Fumagalli et al. (2010) report higher values for a few low metallicity dwarf galaxies. We conclude that a pressure-driven molecular fraction cannot explain the whole observed range of variation of . Because the motivation for molecular fraction being directly modulated by metallicity is very strong (but see the comments by Mac Low & Glover, 2010), it is well conceivable to construct mixed scenarios where equation 2 is valid and the normalization depends on metallicity.
The search for a physical interpretation of our results lead us to an expression for gas pressure in star-forming discs given by equation 6. Discs subject to this pressure have some interesting properties: for instance, neither nor appear in the expression of pressure (though the gravity of stars enters in determining ), gas effective height is related to the ratio of gas velocity dispersion and epicyclic frequency (equation 10) and the sound crossing time of effective height is simply proportional to the orbital time (equation 11). Comparison with data is not straightforward, as includes a major contribution from the sound speed of the hot phase (we give further comments below) and direct pressure estimates are hard to obtain. Nonetheless, these predictions can in principle be tested against observations of the Milky Way and nearby galaxies, so they may constitute a basis for a theory of the non-equilibrium vertical structure of discs effectively heated by feedback.
Our simulated discs show total vertical velocity dispersions (figure 6) that are well in excess of the km s-1 value that is usually assumed to hold for discs. However, in our simulations is dominated by the thermal sound speed (equation 4) computed at the particle effective temperature, and this last quantity is determined by the thermal content of the hot phase. This means that cannot be compared with the velocity dispersion of cold clouds in real galaxies. At the same time, vertical velocity dispersions of gas particles (computed without the sound speed) of MW and DW simulations show values that are in much better agreement with those measured in THINGS galaxies by Tamburro et al. (2009) (see figures 11 and 18 in paper I). In our simulations, multi-phase particles are composed by two phases at the sub-grid level, but are seen as a single entity by the SPH code. This means that, as long as a multi-phase cycle goes on, the hot phase is not free to leave the disc, while the cold phase is pulled by the former. This artificial entrainment results, at the macroscopic level, in a velocity dispersion of gas particles that is realistic and, from a detailed comparison of MW and MW_HR, rather stable with resolution in that part of the disc that is well resolved in both simulations. This means that our effective model is correctly producing a gas disc that is thermally warm but kinematically colder. It must be noticed that the hot coronae we produce around the discs have temperatures K and densities cm-3, so their presence is likely ruled out by X-ray observations (e.g. Crain et al., 2010). However, insertion of metal cooling would change this energy balance in favour of kinetic energy, so we expect this hot corona to be less prominent when chemical evolution is properly taken into account.
Our results thus suggest that a complete modeling of a disc heated by feedback must fully take into account the multi-phase nature of the ISM, where the kpc-height corona of warm/hot gas surrounding a spiral galaxy may have an important dynamical role. A step forward in the modeling of a spiral disc subject to contiuous production and dissipation of energy was recently taken by Elmegreen (2011), who addressed the stability of a disc where energy is continually injected and dissipated over some multiple of the crossing time of turbulence. However, in that paper only radial and tangential perturbations were considered and vertical equilibrium was assumed.
The results presented in this paper rely on how well the vertical structure of the disc is resolved in simulations. In the MW and DW cases effective disc heights are of the same order of the gravitational softening (that was kept of the same order as the one used in cosmological simulations with the same mass resolution), so numerical convergence of the results should be demonstrated. We showed results for the MW_HR simulation, and found no clear dependence on resolution in any of our results. Moreover, the light disc forming out of the SH simulation has an effective height of kpc, with a gravitational softening of only 43 pc, so in this case the vertical structure is well resolved. We conclude that, despite the vertical structure of the discs is barely resolved in some of our simulations, the results should be not strongly affected by resolution.
Due to the difficulty in performing measures of gas pressure, observers typically use equation 1 to estimate pressure (often making strong assumptions on velocity dispersions), but its validity has rarely been tested. Koyama & Ostriker (2009) compared this formula with simulations of turbulent ISM in a shearing disc. In their simulations the gas disc is assumed to be much thinner than the stellar one, heating terms take account of cosmic rays, X-rays and H2 formation and destruction, while radiative feedback from massive stars is modeled as localized increases of heating rate, but no SNe are present. Their spatial resolution is of order of 1 pc. They found that midplane and mass-weighted pressures typically differ by an order of magnitude, and that equation 1 is very close to the armonic mean of the two. Interestingly, their midplane pressure is a factor of three lower than , which is what we find for . Our results are not comparable to their simulation, due to the vastly different resolution and to the much hotter state of our discs (they have km s-1). They also proposed an improved analytic estimate of midplane pressure; we compared it with our and found that it does not improve much with respect to . Our simulations are instead comparable to those of Tasker & Bryan (2008) and Joung et al. (2009), that have resolutions of 25 and 2 pc respectively, include feedback frm SNe and show multi-phase structures of the ISM in broad agreement with the assumptions made to design muppi. Unfortunately, they don’t explicitly address the question whether their pressure is well reproduced by the external one of Elmegreen (1989).
5 Conclusions
In this paper we have shown how simulations based on the MUlti-Phase Particle Integrator (muppi) model developed within the gadget3 TreePM+SPH code, are able to give predictions on the various SK relations discussed in the literature. muppi is based on the assumption, suggested by observations of Blitz & Rosolowsky (2004, 2006), that the molecular fraction is modulated by pressure. Moreover, it has the interesting feature of making thermal feedback effective and able to heat discs. So, the interest of this paper does not rely only in the test of a specific sub-resoution model for star formation but it allows to understand what are the testable consequences of a pressure-based molecular fraction in discs efficiently heated by SN feedback.
Our main conclusions are the following.
(i) A pressure-based molecular fraction produces an environmental-dependent standard SK relation, owing to the fact that the relation between pressure and gas surface density is modulated by gas fraction. This variation is very similar to that found between spiral and dwarf galaxies (Bigiel et al., 2008, 2010), and it could be interpreted as a metallicity dependence, since gas fraction is typically related to metallicity in most chemical evolution scenarios. However, the variation in the quantity , the gas density at which the molecular fraction is 1/2, cannot be larger than a factor of 3 between normal spirals and gas-dominated discs, and values of M⊙ pc-2 cannot be obtained in this framework.
(ii) We analyzed in detail the vertical structure of our simulated galaxies, and found that hydrodynamical pressure is not well recovered by the vertical hydrostatic equilibrium value of Elmegreen (1989), because kinematically hotter discs show higher pressure. A better fit is given by:
(equation 6), that we interpret as the pressure of a disc with continuous energy injection. This expression allows to connect the effective disc height with the gas velocity dispersion (computed including kinetic and thermal energies) as (equation 10).
(iii) Quite interestingly, our four simulated galaxies lie on the same (non-linear) dynamical SK relation, independently of their gas fraction. This is not a straightforward consequence of our assumptions, and was not expected. It is worth recalling that a similar phenomenology was found by Daddi et al. (2010) in the very different context of star-forming galaxies. We interpret this result as a manifestation of balance between energy injection from SNe and energy dissipation. We have shown that, under the hypothesis that gas energy is dissipated both by cooling and by viscosity, and that the latter works on the timescale of one sound crossing time of the disc effective height, we can obtain for stationary discs a unique dynamical SK if the efficiency of energy injection after cooling scales with gas specific energy. This is found to result from energy balance in our multi-phase particles under a wide range of cases.
(iv) Other results are of some interest. The model follows well the standard, molecular and HI SK relations, with a tight molecular SK that is a straightforward consequence of the model assumptions. This molecular SK has a slope of , marginally steeper than the 1.2 value found by Bigiel et al. (2008) but in agreement with Liu et al. (2011). The scatter in the simulated relations is small, and this may hint that most scatter is due to observational errors, if not to putting together galaxies that lie on slightly different relations. However, our sub-resolution model gives by construction the average properties of the ISM on scales that are similar to the 750 pc scale used to bin the data, and this may be the reason for the low scatter.
These simulations show that energy injection by SNe is fundamental in determining the structure of star-forming discs, and that the warm/hot phases created by stellar feedback may have an important role in disc dynamics. Future observations will need to address the issue of directly determining gas pressure in order to test whether the usually assumed formula of Elmegreen (1989) or some different estimates, like that provided by equation 6, apply.
Acknowledgements
We thank Frank Bigiel for providing his data on the SK relation of spiral galaxies. Initial conditions for the simulations were kindly provided by S. Callegari and L. Mayer (MW, MW_HR, DW) and V. Springel (SH). Simulations were run at “Centro Interuniversitario del Nord-Est per il Calcolo Elettronico” (CINECA, Bologna), with CPU time assigned under an INAF/CINECA grant and under an agreement between CINECA and University of Trieste, and at CASPUR, with CPU time assigned with the “Standard HPC grant 2009” call. We thank Anna Curir, Bruce Elmegreen and Samuel Boissier for discussions. We acknowledge partial support by the European Commissions FP7 Marie Curie Initial Training Network CosmoComp (PITN-GA-2009-238356) and by grants ASI-COFIS, PRIN-MIUR 2007, PD51-INFN and PRIN-INAF 2009 titled ”Towards an italian network for computational cosmology”. K.D. acknowledges the support by the DFG Priority Programme 1177 and additional support by the DFG Cluster of Excellence ”Origin and Structure of the Universe”.
References
- Bigiel et al. (2010) Bigiel F., Leroy A., Walter F., Blitz L., Brinks E., de Blok W. J. G., Madore B., 2010, AJ, 140, 1194
- Bigiel et al. (2008) Bigiel F., Leroy A., Walter F., Brinks E., de Blok W. J. G., Madore B., Thornley M. D., 2008, AJ, 136, 2846
- Bigiel et al. (2011) Bigiel F., Leroy A. K., Walter F., Brinks E., de Blok W. J. G., Kramer C., Rix H. W., Schruba A., Schuster K. F., Usero A., Wiesemeyer H. W., 2011, ArXiv e-prints
- Blitz & Rosolowsky (2004) Blitz L., Rosolowsky E., 2004, ApJ, 612, L29
- Blitz & Rosolowsky (2006) Blitz L., Rosolowsky E., 2006, ApJ, 650, 933
- Boissier et al. (2007) Boissier S., Gil de Paz A., Boselli A., et al. 2007, ApJS, 173, 524
- Bolatto et al. (2011) Bolatto A. D., Leroy A. K., Jameson K., Ostriker E., Gordon K., Lawton B., Stanimirovic S., Israel F. P., Madden S. C., Hony S., Sandstrom K. M., Bot C., Rubio M., Winkler P. F., Roman-Duval J., van Loon J. T., Oliveira J. M., Indebetouw R., 2011, ArXiv e-prints
- Bolatto (2009) Bolatto A. e. a., 2009 Metallicity and Star Formation: the Resolved Star Formation Law in the Magellanic Clouds
- Boquien et al. (2011) Boquien M., Lisenfeld U., Duc P.-A., Braine J., Bournaud F., Brinks E., Charmandaris V., 2011, ArXiv e-prints
- Bouché et al. (2007) Bouché N., Cresci G., Davies R., et al. 2007, ApJ, 671, 303
- Bullock et al. (2001) Bullock J. S., Dekel A., Kolatt T. S., Kravtsov A. V., Klypin A. A., Porciani C., Primack J. R., 2001, ApJ, 555, 240
- Crain et al. (2010) Crain R. A., McCarthy I. G., Frenk C. S., Theuns T., Schaye J., 2010, MNRAS, 407, 1403
- Daddi et al. (2010) Daddi E., Bournaud F., Walter F., Dannerbauer H., Carilli C. L., Dickinson M., Elbaz D., Morrison G. E., Riechers D., Onodera M., Salmi F., Krips M., Stern D., 2010, ApJ, 713, 686
- Daddi et al. (2010) Daddi E., Elbaz D., Walter F., Bournaud F., Salmi F., Carilli C., Dannerbauer H., Dickinson M., Monaco P., Riechers D., 2010, ApJ, 714, L118
- Dib (2011) Dib S., 2011, ApJ, 737, L20
- Elmegreen (1989) Elmegreen B. G., 1989, ApJ, 338, 178
- Elmegreen (1997) Elmegreen B. G., 1997, in J. Franco, R. Terlevich, & A. Serrano ed., Revista Mexicana de Astronomia y Astrofisica Conference Series Vol. 6 of Revista Mexicana de Astronomia y Astrofisica, vol. 27, Theory of Starbursts in Nuclear Rings. pp 165–+
- Elmegreen (2011) Elmegreen B. G., 2011, ArXiv e-prints
- Fumagalli et al. (2010) Fumagalli M., Krumholz M. R., Hunt L. K., 2010, ApJ, 722, 919
- Genzel et al. (2010) Genzel R., Tacconi L. J., Gracia-Carpio J., et al. 2010, MNRAS, 407, 2091
- Gnedin & Kravtsov (2010) Gnedin N. Y., Kravtsov A. V., 2010, ArXiv e-prints
- Gnedin et al. (2009) Gnedin N. Y., Tassis K., Kravtsov A. V., 2009, ApJ, 697, 55
- Hernquist (1990) Hernquist L., 1990, ApJ, 356, 359
- Joung et al. (2009) Joung M. R., Mac Low M., Bryan G. L., 2009, ApJ, 704, 137
- Katz et al. (1996) Katz N., Weinberg D. H., Hernquist L., 1996, ApJS, 105, 19
- Kennicutt (1998) Kennicutt Jr. R. C., 1998, ApJ, 498, 541
- Kennicutt et al. (2007) Kennicutt Jr. R. C., Calzetti D., Walter F., et al. 2007, ApJ, 671, 333
- Koyama & Ostriker (2009) Koyama H., Ostriker E. C., 2009, ApJ, 693, 1346
- Krumholz et al. (2009a) Krumholz M. R., McKee C. F., Tumlinson J., 2009a, ApJ, 693, 216
- Krumholz et al. (2009b) Krumholz M. R., McKee C. F., Tumlinson J., 2009b, ApJ, 699, 850
- Leroy et al. (2008) Leroy A. K., Walter F., Brinks E., Bigiel F., de Blok W. J. G., Madore B., Thornley M. D., 2008, AJ, 136, 2782
- Liu et al. (2011) Liu G., Koda J., Calzetti D., Fukuhara M., Momose R., 2011, ApJ, 735, 63
- Mac Low (2003) Mac Low M., 2003, in E. Falgarone & T. Passot ed., Turbulence and Magnetic Fields in Astrophysics Vol. 614 of Lecture Notes in Physics, Berlin Springer Verlag, MHD Turbulence in Star-Forming Regions and the Interstellar Medium. pp 182–212
- Mac Low & Glover (2010) Mac Low M., Glover S. C. O., 2010, arXiV:1011.3054
- Martin & Kennicutt (2001) Martin C. L., Kennicutt Jr. R. C., 2001, ApJ, 555, 301
- McKee & Ostriker (1977) McKee C. F., Ostriker J. P., 1977, ApJ, 218, 148
- Monaco (2004a) Monaco P., 2004a, MNRAS, 354, 151
- Monaco (2004b) Monaco P., 2004b, MNRAS, 352, 181
- Murante et al. (2010) Murante G., Monaco P., Giovalli M., Borgani S., Diaferio A., 2010, MNRAS, 405, 1491
- Navarro et al. (1996) Navarro J. F., Frenk C. S., White S. D. M., 1996, ApJ, 462, 563
- Papadopoulos & Pelupessy (2010) Papadopoulos P. P., Pelupessy F. I., 2010, ApJ, 717, 1037
- Pelupessy & Papadopoulos (2009) Pelupessy F. I., Papadopoulos P. P., 2009, ApJ, 707, 954
- Pelupessy et al. (2006) Pelupessy F. I., Papadopoulos P. P., van der Werf P., 2006, ApJ, 645, 1024
- Robertson & Kravtsov (2008) Robertson B. E., Kravtsov A. V., 2008, ApJ, 680, 1083
- Romeo & Wiegert (2011) Romeo A. B., Wiegert J., 2011, ArXiv e-prints
- Schaye (2004) Schaye J., 2004, ApJ, 609, 667
- Schaye & Dalla Vecchia (2008) Schaye J., Dalla Vecchia C., 2008, MNRAS, 383, 1210
- Schmidt (1959) Schmidt M., 1959, ApJ, 129, 243
- Shi et al. (2011) Shi Y., Helou G., Yan L., Armus L., Wu Y., Papovich C., Stierwalt S., 2011, ApJ, 733, 87
- Silk (1997) Silk J., 1997, ApJ, 481, 703
- Solomon et al. (1987) Solomon P. M., Rivolo A. R., Barrett J., Yahil A., 1987, ApJ, 319, 730
- Springel (2005) Springel V., 2005, MNRAS, 364, 1105
- Springel & Hernquist (2002) Springel V., Hernquist L., 2002, MNRAS, 333, 649
- Springel & Hernquist (2003) Springel V., Hernquist L., 2003, MNRAS, 339, 289
- Tamburro et al. (2009) Tamburro D., Rix H.-W., Leroy A. K., Low M.-M. M., Walter F., Kennicutt R. C., Brinks E., de Blok W. J. G., 2009, AJ, 137, 4424
- Tan (2010) Tan J. C., 2010, ApJ, 710, L88
- Tasker & Bryan (2008) Tasker E. J., Bryan G. L., 2008, ApJ, 673, 810
- Teyssier (2002) Teyssier R., 2002, A&A, 385, 337
- Teyssier et al. (2010) Teyssier R., Chapon D., Bournaud F., 2010, ApJ, 720, L149
- Walter et al. (2008) Walter F., Brinks E., de Blok W. J. G., Bigiel F., Kennicutt R. C., Thornley M. D., Leroy A., 2008, AJ, 136, 2563
- Wang & Silk (1994) Wang B., Silk J., 1994, ApJ, 427, 759
- Wolfe & Chen (2006) Wolfe A. M., Chen H., 2006, ApJ, 652, 981
- Wong & Blitz (2002) Wong T., Blitz L., 2002, ApJ, 569, 157
- Wyse & Silk (1989) Wyse R. F. G., Silk J., 1989, ApJ, 339, 700