GMRT 333 MHz observations of 6 nearby normal galaxies
Abstract
We report Giant Meterwave Radio Telescope (GMRT) continuum observations of six nearby normal galaxies at 333 MHz. The galaxies are observed with angular resolutions better than (corresponding to a linear scale of about 0.4 – 1 kpc). These observations are sensitive to all the angular scales of interest, since the resolution of the shortest baseline in GMRT is greater than the angular size of the galaxies. Further, for five of these galaxies we show that at 333 MHz, the mean thermal fraction is less than 5%. Using archival data at about 1 GHz, we estimate the mean thermal fraction to be about 10% at that frequency. We also find that the nonthermal spectral index is generally steeper in regions with low thermal fraction and/or located in the outer parts of the galaxy. In regions of high thermal fraction, the nonthermal spectral index is flatter, and has a narrow distribution peaking at with a spread of 0.16, putting stringent constraints on the physical conditions for generation, diffusion and energy losses of cosmic ray electrons at scales of 1 kpc.
keywords:
galaxies: spiral — galaxies: individual (NGC 1097, NGC 3034, NGC 4736, NGC 5055, NGC 5236, NGC 6946) — (ISM:) cosmic rays — (ISM:) Hii regions — techniques: interferometric — techniques: image processing1 Introduction
| Name | RA | Dec | Morphological | Angular | Distance | Spatial | Other data | |
|---|---|---|---|---|---|---|---|---|
| type | size (D25)(′) | (∘) | (Mpc) | resolution (pc/) | available¶ | |||
| (1) | (2) | (3) | (4) | (5) | (6) | (7) | (8) | (9) |
| NGC 1097 | 02h46m19.0s | -30d16′30 | SBbc | 9.36.3 | 45 | 14.5† | 70.3 | H, 70m, 160m, |
| 20cm | ||||||||
| NGC 3034∗ | 09h55m52.7s | +69d40′46 | IO | 11.24.3 | 75 | 3.97† | 21 | H, 20cm |
| (M82) | ||||||||
| NGC 4736 | 12h50m53.0s | +41d07′14 | SAab | 11.29.1 | 41 | 4.661 | 22.3 | H,70m, 160m, |
| (M94) | 20cm | |||||||
| NGC 5055 | 13h15m49.3s | +42d01′45 | SAbc | 12.67.2 | 59 | 9.2† | 44.6 | H, 70m, 160m, |
| (M63) | 18cm | |||||||
| NGC 5236 | 13h37m00.9s | -29d51′56 | SABc | 11.211 | 24 | 4.512 | 22 | H, 70m, 160m |
| (M83) | 20cm | |||||||
| NGC 6946 | 20h34m52.3s | +60d09′14 | SABcd | 11.59.8 | 33 | 6.83 | 33 | H, 70m, 160m, |
| 6cm, 20cm |
In column (5) D25 refers to the optical diameter measured at the 25 magnitude arcsec-2 contour from de Vaucouleurs et al. (1991). Column (6) gives the inclination angle () defined such that is face-on. Distances in column (7) are taken from: 1 Karachentsev et al. (2003), 2 Karachentsev et al. (2002), 3 Karachentsev, Sharina & Huchtmeier (2000) and the NED †.Column (9) lists available ancillary data that have been used in this paper. ¶ The wavelengths represents the waveband in which other data were available/used (see Section 2 for exact frequencies). ∗ Thermal-nonthermal emission separation was not done for this galaxy (see text for details).
The radio continuum emission from normal galaxies originates from two emission processes: thermal free-free emission from Hii regions predominantly seen at recent star formation sites, and the nonthermal synchrotron emission (hereafter referred to as nonthermal emission) due to acceleration of cosmic ray electrons (CRe) in the ambient galactic magnetic field. A typical galactic magnetic field strength of few microgauss (1 – 15 G) and CRe in the energy range 1 to 10 GeV give rise to radio nonthermal emission between 0.1–10 GHz. However, only at frequencies below 1 GHz, does the thermal fraction of the emission reduce significantly, and hence low frequency studies are direct probes of nonthermal emission in galaxies.
It is now abundantly clear that CRe in normal galaxies are accelerated in supernova remnant (SNR) shock fronts (with typical linear size 1 pc) of Type II and Type Ib supernovae produced by short lived ( yr) massive stars. Subsequently, the CRe diffuse away from their sites of origin and lose their energy primarily via synchrotron and inverse-Compton radiation in about 108 yrs (see Condon 1992 for a review). In turbulent magnetic fields, such as those encountered in the spiral arms, the CRe diffusion speed is the Alfvén speed ( 100 km/s), and hence the CRe can expand to a volume of radius 1 kpc without loosing much energy, thus increasing the observed extent of the nonthermal emitting source. Note that the CRe would occupy a larger volume when observed at lower frequencies, since lower energy electrons suffer lesser energy loss and hence can diffuse farther. The CRe generated at the shock front have steep electron energy spectra which results in a nonthermal synchrotron spectrum, well represented by a power law, , where is the nonthermal radio flux density at a frequency and is the nonthermal spectral index. The effects of CRe generation and propagation will cause to vary from point to point in the galaxy. At the acceleration sites one expects (Bell, 1978; Bogdan & Vlk, 1983; Biermann & Strom, 1993), getting steeper due to various losses as the CRe diffuse away.
To confirm the aforementioned scenarios a host of studies have been done in the past (see e.g. van der Kruit, Allen & Rots 1977; Segalovitz 1977a, b; Beck & Grave 1982; Klein et al. 1982; Klein, Grave & Wielebinski 1983; Carilli et al. 1992; Niklas & Beck 1997; Berkhuijsen, Beck & Hoernes 2003; Beck et al. 2005; Murgia et al. 2005; Paladino, Murgia & Orr 2009). However, due to the presence of thermal free-free emission, the is contaminated, making the measured value flatter than the true value. This is because the thermal emission has a spectral index of , while the nonthermal emission is significantly steeper ()111Note that we use the parameter for the total spectral index, where , and is the total (thermalnonthermal) flux density.. At frequencies below 1 GHz, the nonthermal emission is expected to dominate. Niklas, Klein & Wielebinski (1997) have shown for a sample of 74 galaxies, about 8% of the emission at 1 GHz is thermal in origin. At even lower frequencies, the contribution of thermal fraction reduces significantly, although there can be considerable local variation between, e.g, arms, interarms and giant Hii regions etc., so as to make the separation of the thermal emission important. Previous studies at low frequencies probed linear scales larger than 1 kpc, and hence any small scale structures were lost. These considerations emphasize the importance of high resolution, low frequency observations.
In this paper we report 333 MHz interferometric observation of six nearby galaxies, NGC 1097, NGC 3034, NGC 4736, NGC 5055, NGC 5236 and NGC 6946, using the Giant Meterwave Radio Telescope (GMRT). The galaxies have angular size in the optical and the GMRT observations have a resolution better than 20, probing linear scales of 0.4–1 kpc. The typical noise in the maps is Jy/beam (except for NGC 3034), making them 10 times more sensitive than previous studies at similar frequency of other nearby galaxies (Paladino, Murgia & Orr, 2009; Heesen et al., 2009; Sukumar, Klein & Grave, 1987). All our maps have a dynamic range , which allows us to reliably determine the flux densities in regions near strong emission sites, mainly the nuclear region. We also use the technique developed by Tabatabaei et al. (2007), using archival H maps, for spatially separating thermal and nonthermal emission as discussed in Section 4. However, we emphasize that in using this robust technique, the resolution is limited by much coarser () far infrared maps (discussed in Section 4). In Section 2 we define the sample and discuss the observation and analysis procedure in Section 3. Section 4 discusses the procedure to estimate . Results on individual galaxies are presented in Section 5. We summarize the results in Section 6. The thermal nonthermal emission separation procedure using H and infrared data is discussed in Appendix A.


2 Sample definition
Our sample (see Table 1) includes six nearby spiral galaxies, with clearly demarcated arm and interarm regions as seen both in the optical and radio continuum. The optical size of these galaxies are typically 9–12 and the GMRT synthesized beam (typically ) at 333 MHz can resolve the arm interarm regions.
All the galaxies have 1.4 GHz integrated continuum flux density greater than 200 mJy (as measured in NVSS, Condon et al. 1998, data), which is necessary to ensure detection of low surface brightness diffuse emission across the galaxy. High resolution infrared and H data (see Table 1) are also used. The infrared data were all taken from the Spitzer Infrared Nearby Galaxy Survey (sings) (Kennicutt et al., 2003) obtained using Multiband Imaging Photometer (mips, Rieke et al. 2004) on the Spitzer Space Telescope at 70 m and 160m, while the H images were obtained from the ancillary datasets of the sings and other public datasets, as described in Appendix A. For five galaxies the data could be used for thermal nonthermal separation, however in the case of NGC 3034, the 160m mips image was not usable due to nonlinearity and streaking effects. Finally, a higher frequency, near 1.4 GHz, archival continuum interferometric data/maps were used to find the spectral index with 333 MHz (see Table 1).
An interferometer with the shortest baseline , can detect all the flux from angular scales less than , provided the uv-plane is densely sampled at the shortest spacings. The galaxies in our sample have optical angular size less than . For face-on galaxies, the optical and radio continuum sizes are comparable, however, for highly inclined galaxies, the sizes may differ slightly. In GMRT 100 meters, at 333 MHz allows us to detect all the flux from angular scales less than 18. Given that all the galaxies in our sample are less than 12, the uv-plane is well sampled (see Figure 1) and hence we do not expect any missing flux density222The extent of missing flux density with our GMRT data was tested as follows: we took an existing archival 1.465 GHz map of NGC 6946, which was made by combining interferometric data from the Very Large Array (VLA) using C and D array (Beck, 2007). This galaxy is 11 in size. The map was then sampled to the 333 MHz GMRT UV coverage and subsequently imaged. All the flux in the source (%) could be recovered.. This is an issue for the archival higher frequency data which is discussed below along with a short description of the sample galaxies.
NGC 1097, in the optical is a spectacular barred spiral galaxy with prominent dust lanes in the bar. The central bar extends for about 20 kpc and then continues into the two optical spiral arms. The galaxy has an active Seyfert nucleus, and a circumnuclear ring of about 1.5 kpc diameter. Amongst the major radio continuum studies of this galaxy, Ondrechen & van der Hulst (1983) reported radio emission at 1465 MHz coincident with the narrow dust lanes in the bar. Recently Beck et al. (2005) obtained a spectral index map for this galaxy from observations at 4.8 and 8.4 MHz, which revealed relatively steep spectral index of in the inner ridge of the bar, and becoming shallower to as one moves to the outer ridge.
To find the spectral index with GMRT 333 MHz, we analyzed the archival 1465 MHz data observed using CD array from the VLA333The Very Large Array (VLA) is operated by the NRAO. The NRAO is a facility of the National Science Foundation operated under cooperative agreement by Associated Universities, Inc. (project code: AW237). The map has an angular resolution of , and the shortest measured baseline is 150, which can detect angular scales up to 14. However, the uv coverage is sparse for angular scales above 8 (see Figure 1). Since the size of the galaxy is about 9, we expect missing flux density at large angular scales in these data.
NGC 3034 (M82) is a prototypical, starburst, edge-on galaxy. The galaxy was initially classified as irregular, however recently Mayya, Carrasco & Luna (2005), have reported the discovery of two symmetric spiral arms in the near infra-red. The galaxy is bright in the radio continuum, and has a synchrotron emitting halo extending up to a diameter of about 8 kpc. Based on a low frequency spectral index study of the whole galaxy from 330 MHz to 4835 MHz, Seaquist & Odegard (1991) found a spectral index of in the nuclear region, steepening to at a radius of 1 kpc due to transport of CRe from the disk by galactic winds.
We used the archival 1490 MHz VLA map (Condon 1987, obtained from the NED) at a resolution to obtain the spectral index with 333 MHz. The 1490 MHz observations were made with the VLA D configuration with shortest baseline length of , and are sensitive to angular sizes less than . This should be sufficient to detect the galaxy, which has an optical size () of . However, due to very bright emission from the core, the high resolution radio continuum map is dynamic range limited.
NGC 4736 (M94) is the nearest large spiral galaxy, which has double ringed morphology. The inner ring is mainly made of recent star forming Hii regions, showing bremsstrahlung spectra (Duric & Dittmar, 1988) and is distinctly visible in the H. The outer ring however is a low surface brightness feature in the optical. The rings were suggested to be caused by inner and outer Lindblad resonances (Schommer & Sullivan, 1976). The radio continuum study by de Bruyn (1977) between 610 MHz and 1415 MHz, reported spectral index maps with the spectral index being towards the center of the galaxy and steepening towards the outer parts of the galaxy.
We used the archival WSRT444The Westerbork Synthesis Radio Telescope (WSRT) is operated by the Netherlands Foundation for Research in Astronomy (NFRA) with financial support from the Netherlands Organization for scientific research (NWO). 1374.5 MHz map taken from the Westerbork sings sample (Braun et al., 2007) at a resolution of after smoothing to to obtain the spectral index. The observations was made using the “maxi-short” array configuration of the WSRT where the shortest east-west baseline was , and (36, 54 and 72 meters respectively), and are sensitive to angular scales less than . NGC 4736, having a angular size of in the radio, has good sampling of the uv-plane and thus this map is not affected by lack of short spacing measurements.
NGC 5055 (M63) is a nearby flocculent spiral which has short multiple arms. Although this galaxy lacks organized spiral arms in the optical, polarization observation at 10.55 GHz shows regular, spiral magnetic fields with radial component due to dynamo action (Knapik et al., 2000). Radio continuum spectral index maps between 610 MHz and 1417 MHz by Hummel & Bosma (1982) showed spectral index of about in the central regions of the galaxy, which steepens to towards the outer parts. The galaxy appears featureless in the above study as well as in the high frequency 10.7 GHz map by Klein & Emerson (1981).
The archival 1696 MHz map from the Westerbork sings (Braun et al., 2007), after smoothing to , was used for obtaining the spectral index with 333 MHz. The “maxi-short” configuration of the WSRT at 1695 MHz allows us to image angular scales up to 10. However, the uv coverage is too sparse to detect flux from structures above . NGC 5055 has an angular extent , and thus we believe this map has missing flux density.
NGC 5236 (M83) is a large barred spiral galaxy and is seen almost face-on. The central bar extends up to 3 ( kpc), showing clear dust lanes. The galaxy is bright in radio continuum and the central bar and the disk is in the 1465 and 4885 MHz observation of Ondrechen (1985). Sukumar, Klein & Grave (1987) found the total and nonthermal integrated spectral index to be and respectively, obtained between 327, 1465 and 4750 MHz and a thermal fraction of 20% at 4750 MHz.
The archival data at 1452 MHz VLA CD array (project code: AS325) were downloaded and analyzed to produce a map, which was used for obtaining spectral index with our 333 MHz observations. The 1452 MHz dataset had shortest baseline of which is sensitive to a maximum angular size of . The uv coverage is sparse for structures above . NGC 5236 is about in size and hence there may be a small amount of missing flux density in this observation.
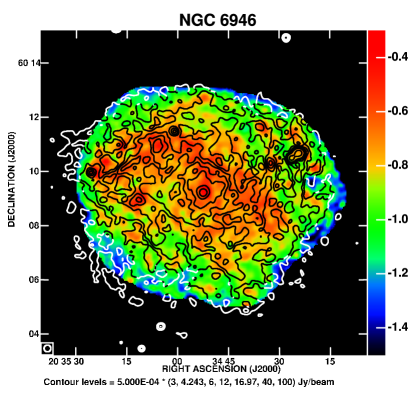
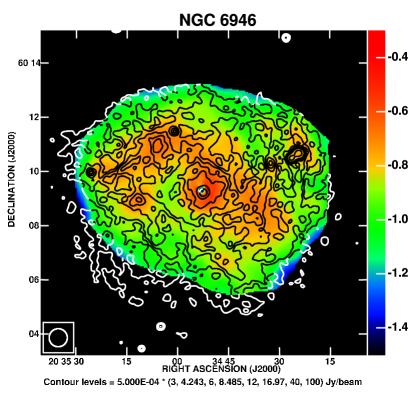
NGC 6946 is a large spiral galaxy with multiple arms. The galaxy has well separated arm and interarm regions and has been the subject of several studies in the radio continuum. There are several star forming regions in the galaxy and one of them shows the first likely detection of “anomalous” dust emission, due to spinning dust, outside of the Milky Way (Murphy et al., 2010). Observations at 610 MHz, 1415 MHz and 5 GHz by van der Kruit, Allen & Rots (1977) revealed a bright radio disk of nonthermal origin. Klein et al. (1982), based on observations at 10.7 GHz, estimated a thermal fraction of %. The spectral index study by Beck (2007) between 1465 MHz and 8.5 GHz, clearly shows a flatter spectral index of in the arms which steepens to about in the interarm regions.
For obtaining the spectral index with 333 MHz, we used an archival VLA map at 1465 MHz. The VLA map was made by combining interferometric data from C configuration (Beck, 2007) and D configuration (Beck, 1991). Beck (2007) noted the integrated flux density from the VLA map and single dish Effelsberg measurement had similar values and there was no indication of missing large angular scale structures.
We emphasize that the GMRT 333 MHz images of the galaxies do not suffer from missing flux density, while some of the higher frequency maps (especially NGC 1097 and NGC 5055) may have missing flux density from large angular size structures. Thus, the true spectral index, particularly in the outer parts of the galaxies, is flatter than determined in this study.
3 Observations and analysis
| Name | Obs. | Time on | Calibrators | used | Synthesized beam | Integrated Flux | |
|---|---|---|---|---|---|---|---|
| date | source (hrs) | () | (Jy/beam) | (Jy) | |||
| (1) | (2) | (3) | (4) | (5) | (6) | (7) | |
| NGC 1097 | 29-Oct-09 | 6 | Flux Cal: | 3C48 | 1611 | 300 | 2.00.14 |
| 3C286 | |||||||
| Phase Cal: | 0116-208 | ||||||
| 0409-179 | |||||||
| NGC 3034 | 31-Oct-09 | 4.5 | Flux Cal: | 3C48 | 2215 | 3000 | 141 |
| (M82) | Phase Cal: | 0834+555 | |||||
| 1459+716 | |||||||
| NGC 4736 | 04-Jul-09 | 7 | Flux Cal: | 3C286 | 1312 | 250 | 0.90.06 |
| (M94) | Phase Cal: | 3C286 | |||||
| NGC 5055 | 02-Nov-09 | 3 | Flux Cal: | 3C286 | 1710 | 240 | 2.30.2 |
| (M63) | Phase Cal: | 3C286 | |||||
| NGC 5236 | 31-Oct-09 | 5 | Flux Cal: | 3C286 | 1612 | 500 | 7.40.5 |
| (M83) | Phase Cal: | 1311-222 | |||||
| NGC 6946 | 29-Jul-09 | 6.5 | Flux Cal: | 3C286 | 1211 | 300 | 4.30.24 |
| 3C147 | |||||||
| Phase Cal: | 1459+716 | ||||||
| 2350+646 |
We conducted interferometric observations at 333 MHz for the six galaxies in our sample with the Giant Meterwave Radio Telescope (GMRT) near Pune, India (Swarup et al., 1991). The data with 16 MHz bandwidth (corresponding to of 325 to 341 MHz, and a center of 333 MHz), divided into 128 channels, were recorded following the usual protocol of observing flux and phase calibrator interlaced with observation on the source. At the beginning and end of the observing run, one of the flux calibrators 3C48, 3C286 or 3C147 was observed for about 1020 minutes. At the beginning and end of the observing run, one of the flux calibrators 3C48, 3C286 or 3C147 was observed for about 1020 minutes. Phase calibrators were observed every 3035 minutes for 45 minutes. Calibrators chosen for each of the observed sources are listed in Table 2.
Data reduction was done using the Astronomical Image Processing System (aips) following standard procedure. After editing the data for strong radio frequency interference (RFI), standard flux and phase calibration were applied to the source. The Baars et al. (1977) absolute flux density scale was used to determine the flux densities of the flux calibrators and then applied them to the phase calibrator and the source.
The task ‘flgit’ was used to remove low level RFI at level across the frequency channels. Even lower level RFI was subsequently removed using the tasks ‘tvflg’, ‘wiper’ and/or ‘spflg’. The procedure was iteratively done by obtaining the gain solutions after every RFI removal stage. The final gain solution that was applied to the target source when the closure errors were less than 1% on the phase calibrators.
The calibrated data were then used to obtain the deconvolved images using the task ‘imagr’. Prior to this, the data were condensed in frequency by vector averaging 6 adjacent channels of 125 KHz each (resulting in channel width of 750 KHz) using the task ‘splat’. This ensured that the bandwidth smearing was less than the size of one synthesized beam at 333 MHz. To account for wide field imaging with non-coplanar baselines, the technique of polyhedron imaging was used in imagr (Cornwell & Perley, 1992), where the field of view is subdivided into a number of smaller fields (facets). For our purpose we used facets covering the primary beam up to the half power beam width (HPBW ). Strong sources outside the HPBW, if present, were included in additional facets.
Several rounds of phase only self-calibration were done iteratively, by choosing point sources such that, the flux density within one synthesized beam is more than 8. Any stripe present in the map due to bad data, were removed using a Fourier transform method555 see http://www.ncra.tifr.res.in/aritra/stripe_removal.pdf. In the last iteration, one round of amplitude and phase self calibration was done. Final maps were made from full uv coverage and the uv data were weighted using Briggs robust weighting of 0 (Briggs, 1995). To clean the extended diffuse emission from the galaxies we used sdi clean algorithm (Steer, Dewdney & Ito, 1984). The final full resolution images obtained are shown in Figure 2 and their corresponding synthesized beams are listed in column 6 of Table 2.
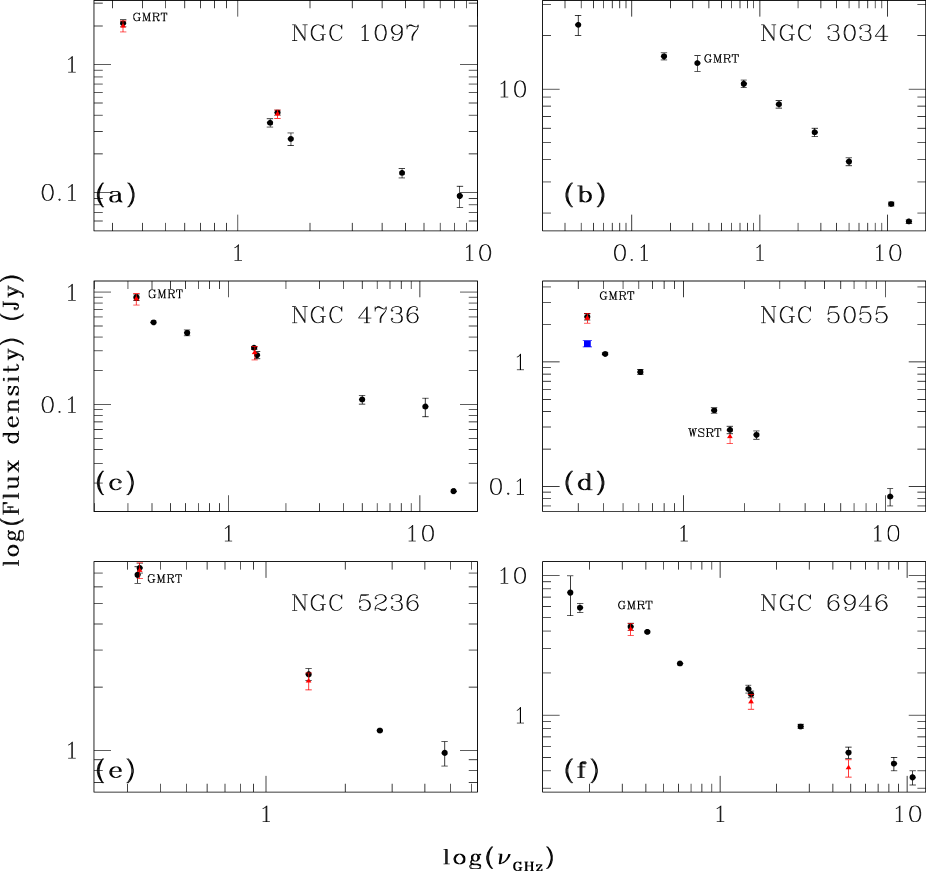
The integrated flux density of the all the six galaxies were obtained by integrating within the 4 (where is the map noise) contour and is given in Table 2. We compared the flux density obtained for each of our sample galaxies with measurements done at other radio frequencies by other researchers, as given in Table 3. Figure 3 shows the integrated broadband spectrum for our sample galaxies. Our flux density measurements are in good agreement with the interpolated flux densities from higher and lower radio frequency observations reported in earlier studies.
The uncertainties in the estimated flux density () depend on the rms noise in the map as well as on errors associated with uncalibrated system temperature () variations, which is about 5% (Roy & Rao, 2004) at 333 MHz for the GMRT. The flux density error () can be calculated as,
The flux density also has an systematic error of about 8% associated with the absolute flux scale error at 333 MHz.
| Source | Frequency | Flux density | Ref. |
| (GHz) | (Jy) | ||
| NGC 1097 | 0.333 | 2.10.14 | This paper |
| 1.365 | 0.3500.025 | 1 | |
| 1.465 | 0.420.02 | VLA CD array | |
| 1.665 | 0.2620.030 | 1 | |
| 4.850 | 0.1420.012 | 1 | |
| 8.450 | 0.0940.018 | 1 | |
| NGC 3034 | 0.038 | 233 | 2 |
| 0.178 | 14.60.7 | 2 | |
| 0.333 | 141 | This paper | |
| 0.750 | 10.70.5 | 2 | |
| 1.415 | 8.00.4 | 3 | |
| 2.695 | 5.70.3 | 2 | |
| 5.0 | 3.90.2 | 2 | |
| 10.7 | 2.250.06 | 4 | |
| 14.7 | 1.790.04 | 4 | |
| NGC 4736 | 0.333 | 0.90.06 | This paper |
| 0.408 | 0.539 | 5 | |
| 0.610 | 0.4350.026 | 7 | |
| 1.365 | 0.3200.01 | 6 | |
| 1.415 | 0.2760.02 | 7 | |
| 4.995 | 0.1110.01 | 7 | |
| 10.7 | 0.0960.018 | 8 | |
| 15 | 0.017 | 9 | |
| NGC 5055 | 0.333 | 2.30.13 | This paper |
| 0.408 | 1.160.022 | 5 | |
| 0.610 | 0.830.04 | 10 | |
| 0.750 | 0.88- | 11 | |
| 1.417 | 0.4090.02 | 10 | |
| 1.696 | 0.2850.02 | WSRT | |
| 2.295 | 0.260.02 | 12 | |
| 3.7 | 0.254 | 13 | |
| 10.7 | 0.1170.026 | 14 | |
| NGC5236 | 0.327 | 6.860.62 | 15 |
| 0.333 | 7.30.4 | This paper | |
| 1.452 | 2.30.15 | VLA CD array | |
| 1.465 | 2.20.11 | 15 | |
| 2.7 | 1.24 | 16 | |
| 4.75 | 0.970.13 | 15 | |
| NGC 6946 | 0.158 | 7.54 | 17 |
| 0.178 | 5.880.44 | 18 | |
| 0.333 | 4.e0.24 | This paper | |
| 0.408 | 3.95 | 5 | |
| 0.610 | 2.34 | 19 | |
| 1.415 | 1.540.10 | 19 | |
| 1.465 | 1.410.08 | VLA CD array | |
| 2.695 | 0.830.03 | 20 | |
| 4.86 | 0.540.05 | VLAEffelsberg | |
| 8.50 | 0.450.05 | 21 | |
| 10.70 | 0.3590.042 | 8 |
1Beck et al. (2002), 2Kellermann et al. (1969), 3Hummel (1980), 4Klein, Wielebinski & Morsi (1988), 5Gioia & Gregorini (1980), 6Braun et al. (2007), 7de Bruyn (1977), 8Klein & Emerson (1981), 9Nagar, Falcke & Wilson (2005), 10Hummel & Bosma (1982), 11de Jong (1966), 12Arp (1973), 13Kuril’chik, Onishchenko & Turyvskii (1967), 15Sukumar, Klein & Grave (1987), 16Wright et al. (1990), 17Brown & Hazard (1961), 18Caswell & Wills (1967), 19van der Kruit, Allen & Rots (1977), 20de Jong (1967), 21Kuril’chik et al. (1970).
 |
 |
 |
|
 |
 |
4 Nonthermal spectral index ()
The nonthermal spectral index , is the main parameter of interest because it is used to model CRe generation and propagation. However, it is not possible to measure it directly. The quantity which is measured is the total spectral index which is contaminated by thermal free-free emission. This contamination is significant for spatially resolved regions of the galaxy where the thermal fraction666Thermal fraction is defined as: , where, is the flux density of the thermal emission. In the text we express as percentages. (henceforth, ) is high. In this section, we assess the effect of on obtained between 333 MHz and near 1.4 GHz in spatially resolved regions of the galaxy. To do this, we use the method of thermal-nonthermal separation developed by Tabatabaei et al. (2007) and apply it to five of our galaxies (except NGC 3034). The method uses dust extinction corrected H maps to get a template for the free-free emission across the galaxy, and extrapolates it to the desired radio frequency to obtain spatially resolved thermal radio emission maps. The extinction correction is achieved by estimating the dust temperature and optical depth using the far infra-red maps at 70m and 160m (see Appendix A for details). The far infrared 160m map has an angular resolution of , and hence the final nonthermal spectral index maps have this angular resolution, which is significantly coarser than the total spectral index (hereafter ) maps. The usefulness of this method lies in the fact that it can be used in spatially resolved parts of the galaxy. Further, Tabatabaei et al. (2007) demonstrate the robustness of their method over several other existing thermal-nonthermal separation techniques (see references therein and Broadbent, Osborne & Haslam 1989; Gioia, Gregorini & Klein 1982; Hummel & Bosma 1982).
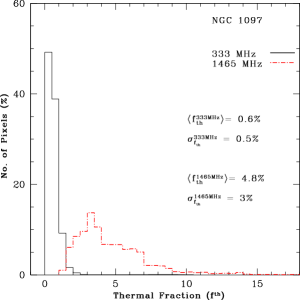
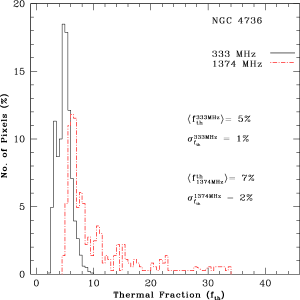
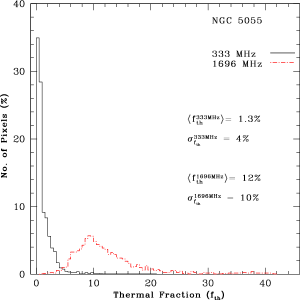
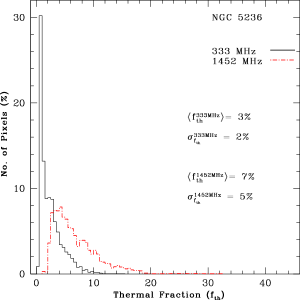
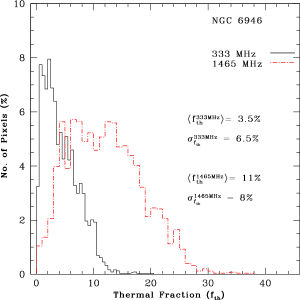
The mean for all our sample galaxies was found to be less than 5% at 333 MHz, although the value can go up to 10% in some specific bright Hii regions and in the spiral arms. Applying the same method to the available higher frequency data at or close to 1.4 GHz, we found the mean to be less than 12%. The distribution of the at 333 MHz and near 1.4 GHz for five galaxies is shown in Figure 11 of the appendix.
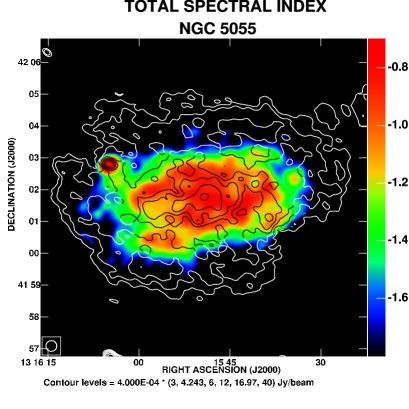
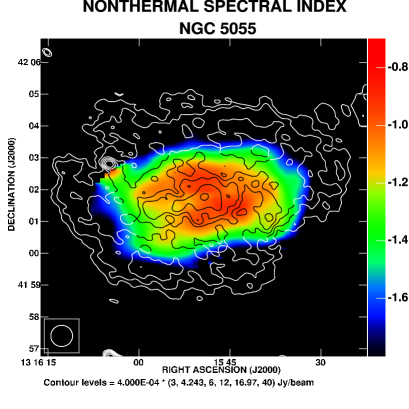
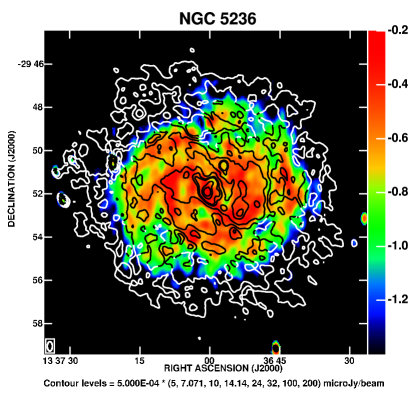
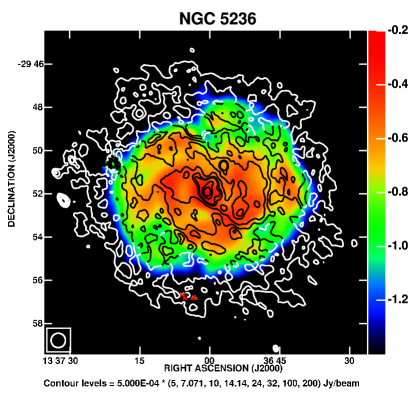
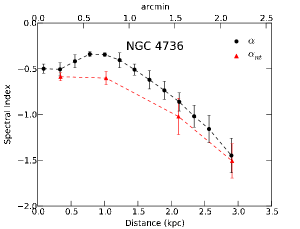
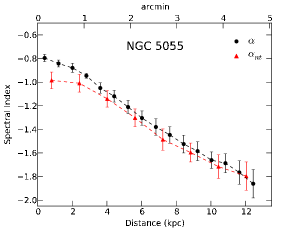
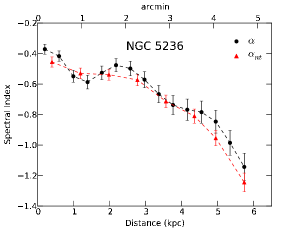
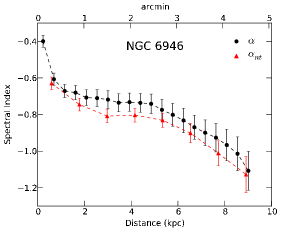
The nonthermal 333 MHz and higher frequency maps were further used to obtain variation for the five galaxies. The left panels of Figure 4, show the maps and the right panels show the maps. Figure 5 shows the variation of and with radius for the galaxies. Here, the spectral index was estimated by azimuthally averaging over annuli of one beam width. The radial profiles clearly reveal that the nonthermal spectral index is nominally steeper than the uncorrected values, and further steepens towards the outer parts of the galaxy. However, we note that towards the outer parts of the galaxies, the steepening of both the total and nonthermal spectral indices may be caused due to “missing flux density” problems.
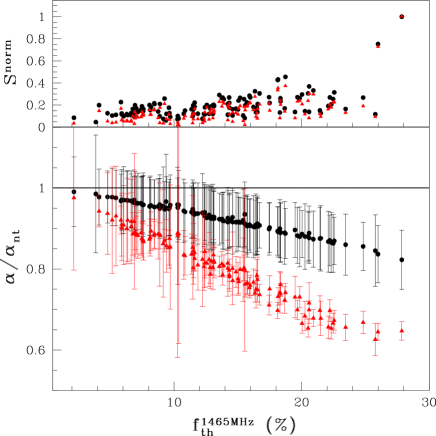
We are now in a position to quantify the importance of thermal-nonthermal separation, for robust estimates of between 333 MHz and near 1 GHz. The uncertainty in can be estimated by propagating the various sources of errors in obtaining the nonthermal maps. Three primary sources of error affect the measurement, namely: the rms in the two radio maps (), the error associated with the uncalibrated system temperature of the instrument , and the error in thermal fraction, . is about 5% at 333 MHz for the GMRT and assumed about 2% for VLA and WSRT near or at 1.4 GHz maps. The error is estimated to be about 10% at these frequencies by Tabatabaei et al. (2007) (also see Appendix A). Incorporating these errors, we have computed the ratio in regions by dividing the galaxy into rectangular grids of size of approximately 40. We find that for thermal fraction less that 5% at 333 MHz and less than about 10% near 1.4 GHz, . This effect is illustrated for NGC 6946 in the bottom panel of Figure 6, where the is plotted (in black) as a function of thermal fraction near 1.4 GHz. Within the error bars the ratio is consistent with unity for thermal fraction less than 10%. For higher thermal fraction (predominantly in the arms or Hii regions) the ratio drops below unity, and correction to , to obtain , could be as high as 20%. The thermal-nonthermal separation is even more important for calculated between higher frequency pairs like 1.4 GHz and 4.8 GHz. The ratio for NGC 6946 obtained between 1465 MHz and 4860 MHz (using archival map downloaded from NED, Beck 2007) is plotted in red in Figure 6, where we clearly see that the ratio is significantly below unity for the whole range of thermal fractions. Note that since there is also a systematic uncertainty associated with the absolute calibration scale for calibrating radio flux densities, the absolute value of the spectral index can vary by about 10%.
5 Discussion on Individual Galaxies
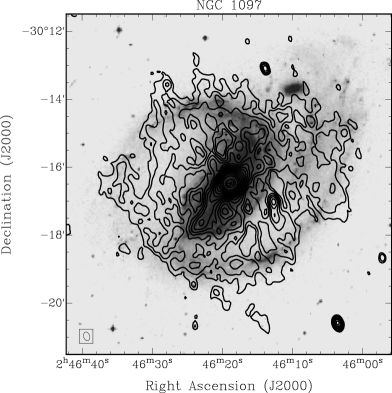
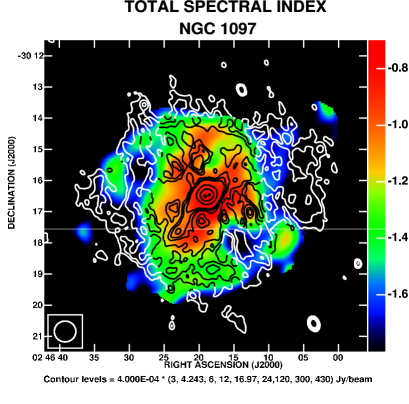
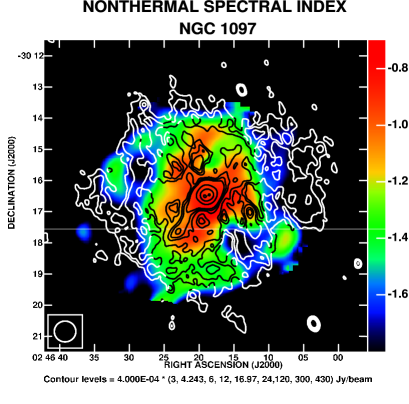
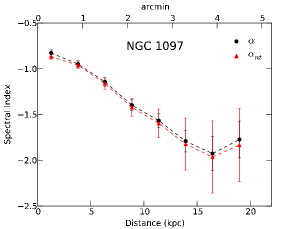
NGC 1097: Our 333 MHz map (see Figure 2) has an angular resolution of 1611, which corresponds to a spatial resolution of 1.1 kpc, if the galaxy is at a distance of 14 Mpc. The only other low frequency radio continuum study of this galaxy was done by Ondrechen & van der Hulst (1983) and Ondrechen, van der Hulst & Hummel (1989) at 1465 MHz. They reported strong radio emission coincident with the narrow dust lanes in the bar. The central bar region is also clearly visible in our 333 MHz map, and is coincident with dust emission inferred from the far infra-red 24m images from Spitzer, as seen in Figure 7. The bar pattern rotates in the clockwise direction (see Ondrechen, van der Hulst & Hummel 1989), and as expected prominent shock fronts are visible on the leading side of the bar with respect to the sense of rotation. The in the bar region at 333 MHz is estimated to be 1%, hence the radio emission at this frequency is entirely nonthermal in origin. These observations fit well with the explanation that the radio emission from the bar results due to shock compression of gas, dust and magnetic field, as was concluded by Ondrechen & van der Hulst (1983). The total emission from the bar and the central component (the region shown in Figure 7) is 83557 mJy, out of which 75052 mJy arises from the central compact region (2521). For a similar sized central region Ondrechen & van der Hulst (1983) quote a flux density of 260 mJy at 1465 MHz, based on which we get a of . The within a 40 region based on our analysis is . This close to the nuclear region is steeper when compared with other galaxies in our sample. This indicates possibility of radiative cooling by inverse Compton/synchrotron processes.
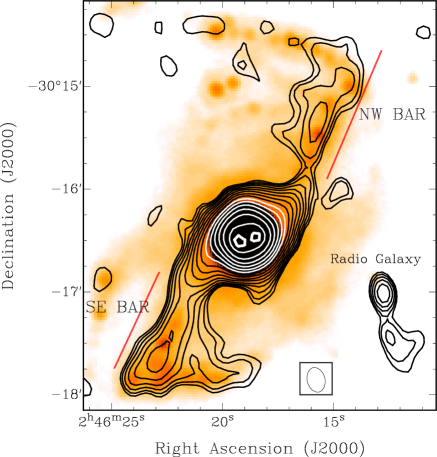
The southeastern (SE) side of the bar has a flux density of mJy and the northwestern (NW) side has a flux density of mJy, measured within the 2 mJy closed contours. The red lines in Figure 7 show the SE bar and NW bar. In the optical, the bar region continues into two prominent arms however the radio emission is highly diffuse. We find the thermal fraction of the interarm region at 333 MHz and 1465 MHz to be 0.2% and 2.5% respectively whereas in the spiral arm regions it is 1% and 4.5% respectively. In the arm regions, the is while it gets significantly steeper () in the interarm regions which may be caused due to missing flux density problems. The radial profile of the and in Figure 5, gets steep towards the outer parts of the galaxy possibly due to missing flux density. We emphasize that the overall thermal fraction in this galaxy is very low, with of 0.6% at 333 MHz and 4.8% at 1465 MHz (see Figure 11).
At 333 MHz, we detect the radio galaxy discovered by Beck et al. (2005), located 90 from the nucleus of NGC 1097 towards the southwest at a PA of (see Figure 7). The radio galaxy has a total flux density of mJy, with mJy in the northern component (, (J2000)) and mJy in the southern component (, (J2000)).
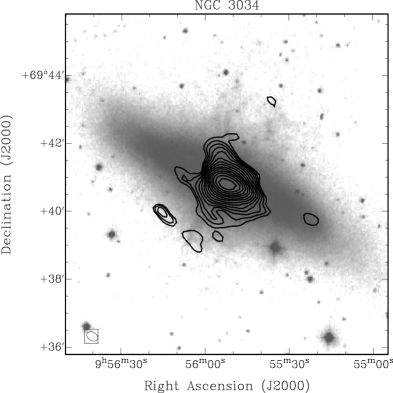
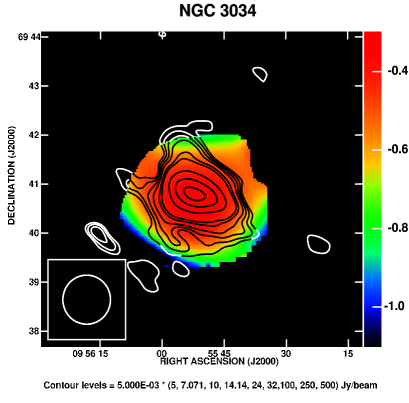
NGC 3034 (M82): The 333 MHz map (see Figure 2) of this galaxy has an angular resolution of 22, corresponding to a spatial resolution of about 0.5 kpc for a distance of 3.9 Mpc. We find the integrated flux density at 333 MHz to be 14 Jy which is consistent with flux densities measured at other frequencies. The rms of the image, which is 3 mJy/beam, is dynamic range limited since the peak flux density in the galaxy is 3 Jy/beam. Morphologically the galaxy is featureless at our resolution, although the northern extension () is coincident with the base of the H/optical horn (see Figure 2), which is likely due to synchrotron emitting particles convected outwards by the nuclear wind, tracing the H horns. The galaxy was observed between 330 MHz to 4835 MHz by Seaquist & Odegard (1991), and a similar horn was seen at 1515 MHz. Their study also revealed a nonthermal radio halo surrounding the galaxy, however our observations do not show this due to dynamic range limitations.
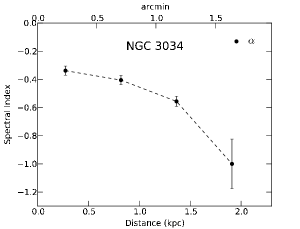
For this galaxy, the thermal-nonthermal separation was not possible, but we have computed the map and radial profile as shown in Figure 4 and 5. The 333 MHz GMRT map was convolved to the resolution of VLA map at . This is a good approximation for index variation across the galaxy since the thermal fraction of this galaxy has been estimated to be 15% at 32 GHz (Klein, Wielebinski & Morsi, 1988), corresponding to % and % at 1.4 GHz and 333 MHz respectively. The spectral index is seen to be very flat with towards the center and steepens to at a distance of 2 kpc from the center. Similar radial variation of the spectral index was also reported by Seaquist & Odegard (1991).
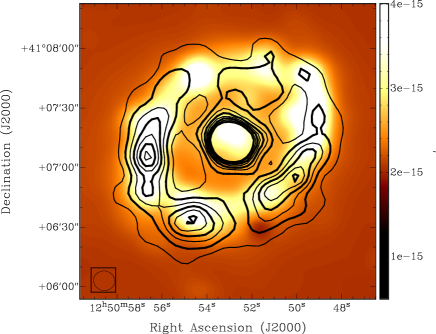
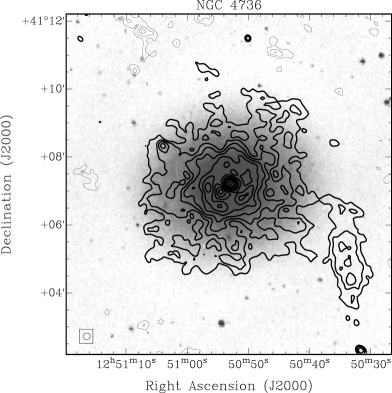
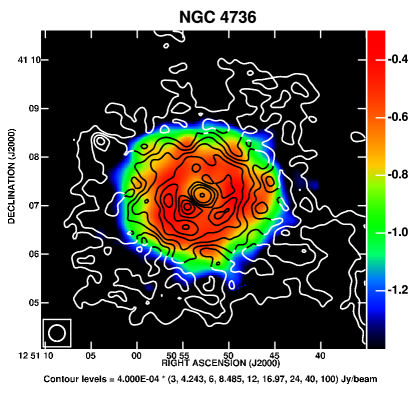
NGC 4736 (M94): The 333 MHz map (see Figure 2) of this galaxy has an angular resolution of 13, corresponding to an spatial scale of about 0.3 kpc for a distance of 4.7 Mpc. The other low frequency study of this galaxy exist at 610 MHz (de Bruyn, 1977), observed with much lower angular resolution of 56. At our angular resolution we clearly detect emission from the inner star forming circumnuclear ring of the galaxy as shown in Figure 8 overlaid on the H map. The ring is located at about 50 (major axis), corresponding to 1.1 kpc, from the center, and is 19 (420 pc) wide (up to the half power) having a flux density of 24013 mJy. The estimated thermal fraction of the ring at 333 MHz and 1374.5 MHz is % and % respectively, and hence the ring at 333 MHz is largely nonthermal in origin. The ring is seen to be coincident with the H ring, which is shown in Figure 8 after convolving to the same radio resolution.
Radio emission from the ring is also seen in the higher frequency 8.46 GHz observations made by Chyy & Buta (2008), however at these frequencies the emission is a mixture of thermal and nonthermal components. The ring has relatively high thermal fraction which leads to a noticeable change in spectral index (see Figure 5) : is , while the is . The ring has massive on going star formation (Smith et al., 1991) and value indicates that both CRe generation and escape happens on timescales shorter than the radiative timescale. The compact nucleus lies within the central 0.5 kpc (2522) with integrated flux density of 1106 mJy and a peak flux of 45 mJy/beam and . Outside the ring extending to the edge of the galaxy there is no thermal emission observed leading to ,
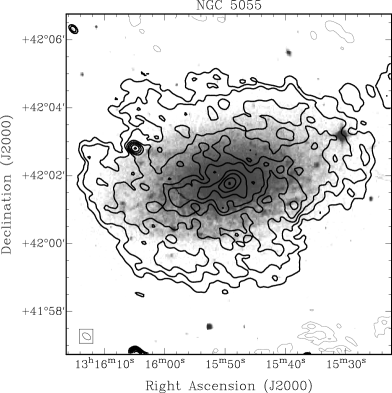
NGC 5055 (M63): The 333 MHz observation (see Figure 2) has an angular resolution of 1710 corresponding to a spatial scale of 0.7 kpc at a distance of 9 Mpc. As is evident from the figure, the extent of the galaxy is larger at 333 MHz than the optical. In an earlier study by Hummel & Bosma (1982) at 610 MHz and 1410 MHz at the much lower angular resolution of 5887, the galaxy appears featureless which is also the case in our higher resolution 333 MHz map. However, 10.55 GHz polarization observations by Knapik et al. (2000) show regular spiral structure. The overall radio emission at 333 MHz at a level of 4 is 8.65.3 in extent, which has an integrated flux density of 2.30.13 Jy. This value is higher than what one would obtain using a spectral index of estimated between 610 and 1417 MHz (Hummel & Bosma, 1982). The reason for this is Hummel & Bosma (1982) estimate the integrated flux density within a region 6.73.2 at 610 MHz, which is smaller than our detected size at 333 MHz. However, if a similar size region is considered, we obtain a flux density of 1.40.1 Jy which is consistent with a spectral index of as seen in Figure 3(d). NGC 5055 is highly inclined, with inclination angle, , and the extended low frequency radio emission can result due to escape of low energy ( 2 GeV) CRe from the disc which travel larger distances ( 4.5 kpc) into the galactic halo.
The mean thermal fraction at 1696 MHz (18cm) and 333 MHz is 12% and 1.3% respectively. The in the central region is which steepens to towards the outer parts of the galaxy777Note that Hummel & Bosma (1982) using observations at 610 and 1417 MHz quote a spectral index variation of to between the central and outer parts of the galaxy, while we find much steeper values. The WSRT 1696 MHz map has a flux density of 284 mJy within the same region of 6.73.2, which when extrapolated using a spectral index of , has a much lower value (see Figure 3(d)). This may be due to missing flux density issues as discussed in Section 2. Thus the true spectral index should be flatter than what is observed by us. (see Figure 5). This result supports the conclusion drawn by Hummel & Bosma (1982) that the spectral index steepening is mainly due to energy losses of CRe and decrease in number of relativistic electrons with increasing galactic radius.
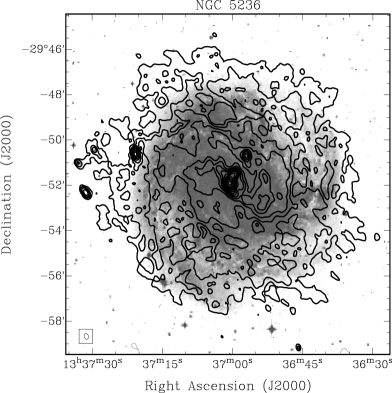
NGC 5236 (M83): The 333 MHz observation (see Figure 2) has an angular resolution of 1612, which correspond to a linear scale of about 0.4 kpc at a distance of 4.2 Mpc. An early study of this galaxy by Sukumar, Klein & Grave (1987) at 327 MHz using the Ooty Synthesis Radio Telescope (OSRT) quotes integrated flux density of 6.860.62 Jy at a resolution of , while our GMRT observations has a slightly higher integrated flux density of 7.40.4 Jy.
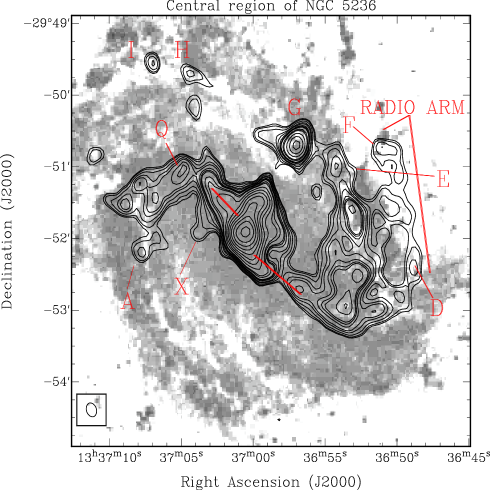
Ondrechen (1985) has reported several point sources in this galaxy. To verify the presence of these sources at 333 MHz, we made a high resolution image of as shown in Figure 9. Comparing this with Ondrechen (1985) we detect the central bar (shown in red lines) and the Hii regions named as A, F, H and I, and nonthermal polarized point sources D, G and X. Note that source G is identified as a background galaxy by Maddox et al. (2006). The region E was identified as a shocked region in the arm, and has a flux density of mJy, while the point source Q is a Hii region and has flux density of 5 mJy/beam. However, we were unable to detect point sources B and C. The flux densities of the point sources are given in Figure 9. In addition to this we see an extended radio arm, which runs along the faint narrow dust lane visible in the infrared 70m map.
The galaxy has a low mean thermal fraction of about 3% at 333 MHz and about 7% at 1452 MHz, and hence as seen in the radial spectral index profile of the galaxy in Figure 5. In the arms, at 333 MHz, the thermal fraction is estimated to be %, where ranges from to which gets modified to as to . along the arms is seen to change significantly from within the central 3 kpc to beyond 3 kpc. Thermal fraction at 333 MHz in the interarm regions is % and beyond the central 4.5 kpc is less than 1%, indicating purely nonthermal emission. In the interarm regions, values lie in the range to .
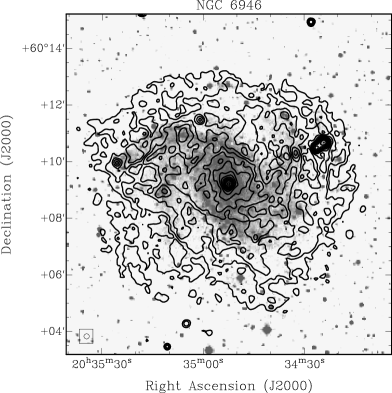
NGC 6946: The 333 MHz observation (see Figure 2) has an angular resolution of 1211 which corresponds to a spatial resolution of 0.4 kpc at a galaxy distance of 6.8 Mpc. The integrated flux density at 333 MHz is 4.50.24 Jy. Using our 333 MHz and archival 1465 MHz VLA maps, we estimate the mean thermal fraction to be about 4.3% and 11% respectively.
Spectral index study by Klein et al. (1982) between 610 MHz and 10.7 GHz showed variation from about near the center to about towards the edge. The spectral index between GMRT 333 MHz map and VLA 1465 MHz map shows a similar trend, with spectral index of at the center and towards the edge. Recently, Beck (2007) studied the spectral index between 4860 MHz and 1465 MHz which showed flatter spectral index in the arm than the interarm due to higher thermal fraction. In our studies, thermal fraction is higher in the arm (5–10%) than in the interarm (1–5%). In the arm, lies in the range to , while the is steeper to . In the interarm regions the average spectral index is steeper with , while the does not change significantly, .
The 333 MHz map prominently shows the giant Hii regions identified by van der Kruit, Allen & Rots (1977). The Hii region at , (J2000) (region C in van der Kruit, Allen & Rots (1977)), is about 35 (1.2 kpc) in size, and can be seen in the low resolution nonthermal maps. This region is a suitable candidate to investigate the CRe injection near high star forming sites. We find the thermal fraction to be % at 333 MHz and % at 1465 MHz. The in this region is , whereas before the separation the spectral index is .
The central 35 region (at , (J2000)) has a flux density of 22613 mJy at 333 MHz while at 1465 MHz the same region has a flux density of 1176 mJy. This corresponds to an of at a resolution of . However, after the separation, similar region has a of (see Figure 4). In the nuclear region about 15% of the total emission is due to thermal emission at 333 MHz, higher than the rest of the galaxy, where the thermal emission lies within 10%.
6 Summary
The 333 MHz GMRT observations of six nearby galaxies (greater than 10 in size) presented in this paper are by far the highest angular resolution maps for these galaxies at this frequency which are sensitive to both small ( kpc) and large ( kpc) scale structures. The hybrid array of GMRT enables us to recover emission from both the diffuse and small scale emission in these sources, which we have adequately verified by comparing our estimated integrated flux densities with those available in the literature. Our observations have comparable resolution as that attained at higher frequencies, and probe linear scales of about 0.4–1 kpc.
At 333 MHz the galaxies appear smoother than at higher frequencies, where spiral arms are often discernable. The thermal emission (which is primarily associated with ionized structures observed in H maps) for all the galaxies was found to be less than 5% of the total emission, and hence at these frequencies, the emission is essentially nonthermal. The smooth appearance is consistent with the conjecture that nonthermal emission at 333 MHz primarily results from a population of old ( yrs) CRe, which diffuses away from their formation sites filling up a volume of radius 1 kpc, without loosing much energy. This scale is larger than the width of the gaseous spiral arms and comparable to the width of the inter-arm region (see e.g. Condon 1992), hence reducing any contrast in intensity across the galaxy. The prominent radio structures observed at higher frequencies ( 1 GHz) are visible solely due to the increased thermal fraction.
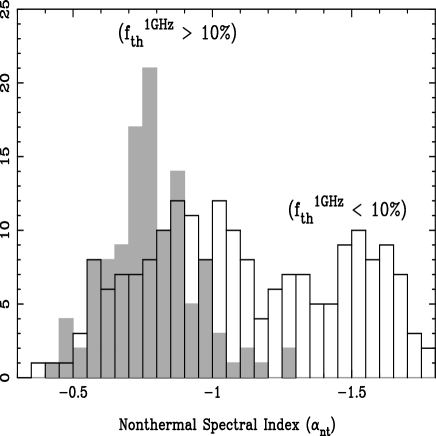
We have determined robust estimates of spatially resolved (see Section 3) for five galaxies in our sample, with a resolution of 40, corresponding to a linear scale of 1–3 kpc, which also corresponds to the diffusion scale of the CRe. The observed ranges from to in various regions of the galaxies. Generally CRe are thought to be accelerated at SNR where both the theoretical prediction (Bell, 1978) and observation based on Galactic SNR suggest mean (Green, 1998; Kothes et al., 2006). The SNR are short lived ( yrs), while the CRe diffuse away from their acceleration sites losing their energy through several physical mechanisms for typically 108 yrs, and hence their initial energy spectrum gets distorted leading to a change in . If the energy losses are due to ionization, flattens (Longair, 2011). Synchrotron radiation and inverse Compton scattering loss leads to a steepening of the spectra, while adiabatic cooling and bremsstrahlung keep the spectra unchanged. To assess the behaviour of in spatially resolved parts of the galaxy we plot distribution (as shown in Figure 10) for two regimes of thermal fraction: (filled grey histogram) and (unfilled histogram), using data from 4 galaxies888We did not use NGC 5055, since we think that there is a missing flux density problem at 1690 MHz and hence the derived and might be steeper than the actual value.. To do this, we have computed by dividing the galaxy in rectangular grids of 40. The histograms are binned with step size 0.05 in . The high thermal fraction corresponds to bright regions in H which traces gas ionized by massive OB stars in star forming regions. These regions host the CRe generation and acceleration sites. The distribution of for such high thermal fraction regions has a Gaussian shape, with mean and narrow spread of 0.16. It is interesting that this narrow distribution arises from multiple spatially resolved regions from an assorted set of galaxies with very different star formation histories. This is clearly indicative of a generic process of energy loss of CRe by synchrotron radiation and inverse Compton scattering as they propagate from their acceleration sites. The flatter part of () primarily arises from NGC 5236, indicating that ionization losses are dominant (Longair, 2011). Niklas, Klein & Wielebinski (1997), based on integrated flux density of 74 galaxies found the average which is comparable to the value that we have obtained. The galaxy integrated spectral index is an average over tens of kpc where the flux density is highly dominated by bright regions which are mostly spiral arms or Hii regions. Our analysis shows that the contribution to the average spectral index primarily arises at least on kpc scales.
The unfilled histogram, corresponding to low thermal fraction () regions, has a much larger spread ranging from . The steepening in the range arises from the interarm regions, and indicates energy losses through synchrotron emission and inverse Compton scattering. , is mostly from low flux density regions, primarily in the outer parts of the galaxies, and may be affected due to missing flux density in the higher radio frequency maps. Note that we have averaged in a region 40, which for all these galaxies corresponds to 1 kpc to 3 kpc, and hence the flatter part of distribution may be affected due to bright regions. As mentioned earlier, the absolute value of can change by 10% due to uncertainty in flux scale at 333 MHz. A recent study by Paladino, Murgia & Orr (2009) for NGC 628, NGC 3627 and NGC 7331, using infrared emission (70m) as a tracer of star forming regions, found that obtained using VLA observations at 325 MHz and near 1.4 GHz, is flatter for infrared bright regions. This is similar to what we observe in our set of galaxies. The high angular resolution 333 MHz observations presented in this paper can be used to study in detail the spatially resolved FIR – radio and CO – FIR correlations, which will be reported in a future paper.
Appendix A Thermal Nonthermal Flux Separation
The Tabatabaei et al. (2007) method uses an H map of the galaxy as a template of thermal emission. Since H emission is affected by extinction, far-infrared data at 70m and 160m are used to obtain a model for extinction, which is then used to correct the H data. The corrected H image is then used to predict the thermal emission at radio frequencies of interest (the whole process is described in detail in sections 3 to 6 of Tabatabaei et al. 2007). In this section, we summarize the various steps and the intermediate results that we obtained in the separation process.
-
•
Data sets: The far infrared images at m and m were obtained from the publicly available data from the Spitzer Infrared Nearby Galaxy Survey (sings; Kennicutt et al. 2003). All m images have a pixel size of 4.5 and a point spread function (PSF) of about 16. At m, each pixel is 9 in size and has a PSF of 40. Both the m and m maps are calibrated in surface brightness units of .
The continuum subtracted H images for NGC 1097 (1.5m CTIO, filter: CT6586) and NGC 6946 (KPNO 2m, filter: KP1563) were obtained from the ancillary data at the sings website. The maps were in units of , which was converted to using the calibration provided in the sings Fifth Data Delivery documentation999http://data.spitzer.caltech.edu/popular/sings/20070410 _enhanced_v1/Documents/sings_fifth_delivery_v2.pdf.
The continuum subtracted H images for NGC 4736, observed with the 1m JKT at La Palma, filter: Ha6570, (Knapen et al., 2004), NGC 5055 observed with the 2.3m telescope at KPNO, filter: 6580 and NGC 5236 observed with the 0.9m telescope at CTIO, filter:6563 were downloaded from the NED.
The counts per second (cps), in these maps were converted to apparent magnitude, , using the zero-point given in the FITS header. The apparent magnitude was further converted to specific intensity, using . The flux in units of was computed using, .
All the m and continuum subtracted H maps were convolved to the coarser 40 PSF of m, and pixels were re-gridded to 9. All the subsequent calculations were done on a pixel by pixel basis.
-
•
Dust Temperature and Optical Depth:
Following Tabatabaei et al. (2007), as a first step for extinction correction of H maps we need to estimate the optical depth due to obscuring dust. For this the colour temperature of the dust () is found by fitting a black body spectrum incorporating dust absorption efficiency (see equation 1 of Tabatabaei et al. 2007) to the far infrared maps at 70m and 160m. The distribution of the dust temperature for all the five galaxies is shown in the left panel of Figure 11. The mean temperature estimated for all the galaxies is between 1922 K. Note that a single dust temperature model has been assumed. The optical depth at 160m () was then obtained by using equation 2 of Tabatabaei et al. (2007) using the estimated . The H optical depth was obtained as (Krgel, 2003) with H filling factor (Dickinson et al., 2003). For all the five galaxies the lies in the range 0.03 – 0.6 at linear scales 1 kpc, with the highest values being towards the center of the galaxies.
-
•
Emission Measure:
Extinction corrected H maps was used to estimate the emission measure ( pc cm-6, where is the thermal electron density) using equation 3 and 4 of Tabatabaei et al. (2007) (also see Valls-Gabaud 1998) and assuming an electron temperature of K. The emission measure radial profile for all the five galaxies is shown in the middle panel of Figure 11. The emission measure towards the center of the galaxy lies in the range of pc cm-6 and falls off to pc cm-6 towards the edge of the galaxy. These range of emission measure values are consistent with those observed in the Milky way (see e.g. Berkhuijsen, Mitra & Mueller 2006).
-
•
Thermal emission at Radio frequencies:
Equation 5 and 6 of Tabatabaei et al. (2007), were used to determine the radio continuum optical depth and the brightness temperature () using the Rayleigh-Jeans approximation. The thermal flux density () at a radio frequency was obtained from the using,
Here, and size of the restoring beam in the radio map (in this case 40).
For all the five galaxies, the pixel-wise distribution of the thermal fraction () at 333 MHz and near 1 GHz are shown in the rightmost panel of Figure 11. The mean at 333 MHz and near 1 GHz for all the galaxies were found to be less than 5% and less than 12% respectively. However, in certain giant Hii regions, the thermal fraction can go up to 10% at 333 MHz and 30% near 1 GHz. Tabatabaei et al. (2007) pointed out that the primary source of error in the thermal fraction arises from the unknown value of the . Using similar arguments, we estimate the uncertainty in the thermal fraction at 333 MHz and near 1 GHz to be 10% and % respectively.


Acknowledgments
We thank the referee, Elly Berkhuijsen and the editor, for insightful comments that have improved both the content and presentation of this paper. We thank the GMRT staff for technical support during the observations. GMRT is run by the National Centre for Radio Astrophysics of the Tata Institute of Fundamental Research. This research has made use of the NASA/IPAC Extragalactic Database (NED) which is operated by the Jet Propulsion Laboratory, California Institute of Technology, under contract with the National Aeronautics and Space Administration. The Digitized Sky Surveys were produced at the Space Telescope Science Institute under U.S. Government grant NAG W-2166. The images of these surveys are based on photographic data obtained using the Oschin Schmidt Telescope on Palomar Mountain and the UK Schmidt Telescope. This work is based [in part] on observations made with the Spitzer Space Telescope, which is operated by the Jet Propulsion Laboratory, California Institute of Technology under a contract with NASA.
References
- Arp (1973) Arp, H., 1973, ApJ, 183, 791
- Baars et al. (1977) Baars J. W. M., Genzel R., Pauliny-Toth I. I. K., et al., 1977, A&A, 61, 99
- Beck & Grave (1982) Beck, R., Grave, R., 1982, A&A, 105, 192
- Beck (1991) Beck, R., 1991, A&A, 251, 15
- Beck et al. (2002) Beck, R., Shoutenkov, V., Ehle, E., Harnett, J. I., Haynes, R. F., Shukurov, A., Sokoloff, D. D., Thierbach, M., 2002, A&A, 391, 83
- Beck et al. (2005) Beck, R., Fletcher, A., Shukurov, A., et al., 2005, A&A, 444, 739
- Beck (2007) Beck, R. 2007, A&A, 470, 539
- Bell (1978) Bell, R., 1978, MNRAS, 182, 443
- Berkhuijsen, Beck & Hoernes (2003) Berkhuijsen, E. M., Beck, R., Hoernes, P., 2003, A&A, 398, 937
- Berkhuijsen, Mitra & Mueller (2006) Berkhuijsen, E. M., Mitra, D., & Mueller, P. 2006, Astronomische Nachrichten, 327, 82
- Biermann & Strom (1993) Biermann, P. L., Strom, R. G., 1993, A&A, 275, 659
- Bogdan & Vlk (1983) Bogdan, T. J., Vlk, H. J., 1983, A&A, 122, 129
- Braun et al. (2007) Braun, R., Oosterloo, T. A., Morganti, R., Klein, U., Beck, R., 2007, A&A, 461, 455
- Briggs (1995) Briggs, D. S. 1995, Ph.D. Thesis, New Mexico Institute of Mining Technology, Socorro, New Mexico, USA
- Broadbent, Osborne & Haslam (1989) Broadbent, A., Osborne, J. L., Haslam, C. G. T. 1989, MNRAS, 237, 381
- Brown & Hazard (1961) Brown, R. H., Hazard, C., 1961, MNRAS, 122, 479
- de Bruyn (1977) de Bruyn, A. G., 1977, A&A, 54, 491
- Carilli et al. (1992) Carilli, C. L., Holdaway, M. A., Ho, P. T. P., de Pree, C. G., 1992, ApJ, L59, 399
- Caswell & Wills (1967) Caswell, J. L., Wills, D., 1967, MNRAS, 135, 231
- Chyy & Buta (2008) Chyy, K. T., Buta, R. J., 2008, ApJ, 677, L17
- Condon (1987) Condon, J. J., 1987, ApJ Suppl., 65, 485
- Condon (1992) Condon, J. J., 1992, ARA&A, 30, 575
- Condon et al. (1998) Condon, et al. 1998, AJ, 115, 1693
- Cornwell & Perley (1992) Cornwell, T. J., Perley, R. A., 1992, A&A, 261, 353
- Dickinson et al. (2003) Dickinson, C., Davies, R. D., Davis, R. J., 2003, MNRAS, 341, 369
- Duric & Dittmar (1988) Duric, N., Dittmar, M. R., 1988, ApJ, 332, L67
- Gioia & Gregorini (1980) Gioia, I. M., Gregorini, L., 1980, A&A Suppl., 41, 329
- Gioia, Gregorini & Klein (1982) Gioia, I. M., Gregorini, L., Klein, U., 1982, A&A, 116, 164
- Green (1998) Green D.A., 1998, A Catalogue of Galactic Supernova Remnants (1998 September version). Mullard Radio Astronomy Observatory, Cambridge, United Kingdom (available on the World-Wide-Web at http://www.mrao.cam.ac.uk/surveys/snrs/)
- Heesen et al. (2009) Heesen, V., Beck, R., Krause, M., Dettmar, R. J., 2009, A&A, 494, 563
- Hummel (1980) Hummel, E., 1980, A&AS, 41, 15
- Hummel & Bosma (1982) Hummel, E., Bosma, A., 1982, AJ, 87, 242
- de Jong (1966) de Jong, M. L., 1966, ApJ, 144, 153
- de Jong (1967) de Jong, M. L., 1967, ApJ, 150, 1
- Karachentsev, Sharina & Huchtmeier (2000) Karachentsev, I. D., Sharina, M. E., Huchtmeier, W. K., 2000, A&A, 362, 544
- Karachentsev et al. (2002) Karachentsev, I. D., Sharina, M. E., Dolphin, A. E., et al., 2002, A&A, 385, 21
- Karachentsev et al. (2003) Karachentsev, I. D., Sharina, M. E., Dolphin, A. E., et al., 2003, A&A, 398, 467
- Kellermann et al. (1969) Kellermann, K. I., Pauliny-Toth, I. I. K., Williams, P. J. S., 1969, ApJ, 157, 1
- Kennicutt et al. (2003) Kennicutt, Jr., R. C., Armus, L., Bendo, G., et al. 2003, PASP, 115, 928
- Klein & Emerson (1981) Klein, U., Emerson, D. T., 1981, A&A, 94, 29
- Klein et al. (1982) Klein, U., Beck, R., Buczilowski, U. R., Wielebinski, R., 1982, A&A, 108, 176
- Klein, Grave & Wielebinski (1983) Klein, U., Grave, R., Wielebinski, R., 1983, A&A, 117, 332
- Klein, Wielebinski & Morsi (1988) Klein, U., Wielebinski, R., Morsi, H. W., 1988, A&A, 190, 41
- Knapen et al. (2004) Knapen, J. H., Stedman, S., Bramich, D.-M., Folkes, S. L., Bradley, T. R., 2004, A&A, 426, 1135
- Knapik et al. (2000) Knapik, J., Soida, M.,Dettmar, R.-J., Beck, R., Urbanik, M., 2000, A&A, 362, 910
- Kothes et al. (2006) Kothes, R., Fedotov, K., Foster, T. J., Uyanıker, B., 2006, A&A, 457, 1081
- Krgel (2003) Krgel, E. 2003, The physics of interstellar dust, The physics of interstellar dust, ed. E. Kruegel (IoP Series in astronomy and astrophysics, Bristol, UK: The Institute of Physics).
- Kuril’chik, Onishchenko & Turyvskii (1967) Kuril’chik, V. N., Onishchenko, L. V., Turyvskii, V. M., 1967, Sov. Astron. J., 11, 528
- Kuril’chik et al. (1970) Kuril’chik, V. N., Andrievskii, A. E., Ivanov, V. N., Spangenberg, E. E., 1970, Sov. Astron. J., 13, 881
- van der Kruit, Allen & Rots (1977) van der Kruit, P. C., Allen, R. J., Rots, A. H., 1977, A&A, 55, 421
- Longair (2011) Longair, M. S., 2011, High Energy Astrophysics 3-ed, Cambridge University Press.
- Maddox et al. (2006) Maddox, L. A., Cowan, J. J., Kilgard, R. E., Lacey, C. K., Prestwich, A. H., Stockdale, C. J., Wolfing, E., 2006, AJ, 132, 310
- Mayya, Carrasco & Luna (2005) Mayya, Y. D., Carrasco, L., Luna, A., 2005, ApJ, 628, L33
- Murgia et al. (2005) Murgia, M., Helfer, T. T., Ekers, R., Blitz, L., Moscadelli, L., Wong, T., Paladino, R., 2005, A&A, 437, 389
- Murphy et al. (2010) Murphy, E. J., Helou, G., Condon, J. J., Schinnerer, E., Turner, J. L., Beck, R., Mason, B. S., Chary, R.-R., Armus, L., 2010, ApJ, 709, L108
- Nagar, Falcke & Wilson (2005) Nagar, N. M., Falcke, H., Wilson, A. S., 2005, A&A, 435, 521
- Niklas & Beck (1997) Niklas, S., Beck, R., 1997, A&A, 320, 54
- Niklas, Klein & Wielebinski (1997) Niklas, S., Klein, U., Wielebinski, R., 1997, A&A, 322, 19
- Ondrechen & van der Hulst (1983) Ondrechen, M. P., van der Hulst, J. M., 1983, ApJ, 269, L47
- Ondrechen (1985) Ondrechen, M. P., van der Hulst, J. M., Hummel, E., 1985, AJ, 90, 1474
- Ondrechen, van der Hulst & Hummel (1989) Ondrechen, M. P., 1989, ApJ, 342, 39
- Paladino, Murgia & Orr (2009) Paladino, R., Murgia, M., Orr, E., 2009, A&A, 503, 747
- Rieke et al. (2004) Rieke, G., et al., 2004, ApJS, 154, 25
- Roy & Rao (2004) Roy, S., Rao P. A., 2004, MNRAS, 349, L25
- Schommer & Sullivan (1976) Schommer, R. A., Sullivan, W. T., 1976, Ap. Letters, 17, 191
- Seaquist & Odegard (1991) Seaquist, E. R., Odegard, N., 1991, ApJ, 369, 320
- Segalovitz (1977a) Segalovitz, A., 1977a, A&A, 61, 59
- Segalovitz (1977b) Segalovitz, A., 1977b, A&A, 54, 703
- Smith et al. (1991) Smith, B. J., Lester, D. F., Harvey, P. M., Pogge, R. W., 1991, ApJ, 380, 677
- Steer, Dewdney & Ito (1984) Steer, D. G., Dewdney, P. E., Ito, M. R., 1984, A&A, 137, 159
- Sukumar, Klein & Grave (1987) Sukumar, S., Klein, U., Grave, R., 1987, A&A, 184, 71
- Swarup et al. (1991) Swarup, G., Ananthakrishnan, S., Kapahi, V. K., et al. 1991, Current Science, 60, 95
- Tabatabaei et al. (2007) Tabatabaei, F., Beck, R., Krugel, E., , Krause, M., Berkhuijsen, E. M., Gordon, K. D., Menten, K. M. 2007, A&A, 475, 133
- Valls-Gabaud (1998) Valls-Gabaud, D., 1998, PASA, 15, 111
- de Vaucouleurs et al. (1991) de Vaucouleurs, G., et al. 1991, Third Reference Catalogue of Bright Galaxies (Berlin: Cambridge University Press)
- Wong & Blitz (2001) Wong, T., Blitz, L., 2001, ApJ, 540, 771
- Wright et al. (1990) Wright, A. E., Wark, R. M., Troup, E., Otrupcek, R., Hunt, A., Cooke, D. J., 1990, PASA, 8, 261.