Baltic Astronomy, vol. xx, xxx–xxx, xxxx
SOME PROPERTIES OF GALAXY STRUCTURES
Piotr Flin1, Monika Biernacka1, Włodzimierz Godłowski2, Elena Panko3 and Paulina Piwowarska2
1
Institute of Physics, Jan Kochanowski University,
Swietokrzyska 15, 25-406 Kielce, Poland, sfflin@cyf-kr.edu.pl,bmonika@ujk.edu.pl
2
Institute of Physics, Opole University,
Oleska 48, 45-041 Opole,Poland, godlowski@uni.opole.pl,paoletta@interia.pl;
3
Kalinenkov Astronomical Observatory, Nikolaev State University,
Nikolskaya 24, Nikolaev, 54030 Ukraine, panko.elena@gmail.com;
Received: ; accepted:
Abstract.
We analysed some properties of galaxies structures based on PF Catalogue of galaxy structures (Panko & Flin 2006) and Tully NBG Catalog (Tully 1988) At first, we analyzed the orientation of galaxies in the 247 optically selected rich Abell clusters, having in the area considered as cluster at least 100 members. The distribution of the position angles of the galaxy as well as two angles describing the spatial orientation of galaxy plane were tested for isotropy, applying three statistical tests. We found that anisotropy increases with the number of member galaxies, which means there exists the relation between anisotropy and cluster richness. We do not find connection of galaxy alignment and Bautz - Morgan morphological type of parent cluster. The statistically marginal relation between velocity dispersion and cluster richness was observed. However it was found that velocity dispersion decreases with Bautz - Morgan type at almost level. Separately we analyzed ellipticities for 6188 low redshift () poor and rich galaxy structures which have been examined along with their evolution. Finally we analysed the Binggeli effect. The orientation of galaxy groups in the Local Supercluster (LSC), is strongly correlated with the distribution of neighbouring groups in the scale till about 20 Mpc. During analyses of galaxy structures from PF catalogue the situation was quite different. The efect is observed only for more elongated structures (). The range of the distance in which the effect was observed, was estimated as about .
Key words: galaxies: clusters and groups; galaxies: orientation: evolution:
1. INTRODUCTION
The formation of large scale structures is one of the most important problem in the modern astrophysics. There are many theories called scenarios of structure formation (Peebles 1969, Zeldovich 1970, Sunyaew & Zeldovich 1972, Doroshkevich 1973, Shandarin 1974, Dekel 1985, Wesson 1982, Silk & Efstathiou 1983, Bower et al. 2005). In the presently most popular CDM model, the structures were formed from the primordial adiabatic, nearly scale invariant Gaussian random fluctuations (Silk 1968, Peebles & Yu 1970, Sunyaew & Zeldovich 1970). A very important problem is to distinguish between different models of galaxy and galaxy structure formation. An investigation of the orientation of galaxies in clusters is regarded as a standard test of theories of galaxy and large scale structure formation. Thus, theories of the galaxy formation make predictions regarding to the angular momenta of galaxies (Peebles 1969, Doroshkevich 1973, Shandarin1974, Silk 1983, Catelan & Theuns 1996, Li 1998, Lee & Pen 2002, Trujillio, Carretero and 2006). Because this parameter is known for small number of galaxies, instead of the angular momenta, the orientation of member galaxies in structure is studied. There are two approaches to this problem, because either the distribution of galaxy position angles or the distribution of the orientation of galaxy planes can be investigated. The analysis of the orientation of galaxies is performed on the sample of 247 optically selected rich Abell clusters, having in the area considered as cluster at least 100 members. The distribution of the orientation of the brightest galaxies in clusters as well as an analysis of the cluster elipcities is presented for a statistically complete sample of 6188 galaxy structures from PF Catalogue (Panko & Flin 2006 hereafter PF). Moreover we analysed the orientation of galaxy groups in the Local Supercluster and alignment of galaxy clusters.
2. OBSERVATIONAL DATA
The PF Catalogue of galaxy structures (Panko & Flin 2006) is the observational basis for the present study. The catalogue was created using data from the Muenster Red Sky Survey (Ungruhe, Seitter, Duerbeck 2003, hereafter MRSS), which is a large-scale galaxy catalogue covering an area of about 5000 square degrees in the southern hemisphere, complete to a magnitude limit of . The same magnitude limit defines the completeness limit for galaxies in the PF Catalogue. The MRSS is the result of scanning 217 ESO plates with .
The 2D Voronoi tessellation technique (Ramella et al. 2001, Panko and Flin 2006) was applied to the galaxy catalogue to search for overdense regions. As a result PF includes 6188 such structures, with at least 10 galaxies in each structure field. The Voronoi procedure gives only the area and equivalent radius for the overdense structures, while the PF contains information about their shape and orientation on the celestial sphere. A covariance ellipse method involving five moments for the distribution of galaxy coordinates was used to calculate the elliptical shape describing each structure as well as the position angle of its long axis. Lists of galaxies in the magnitude range to , where is the brightness of the third brightest galaxy in the structure area, and the rectangular coordinates x and y of the galaxies were employed for the calculation of the semiaxes a and b of the resulting ellipses, the ellipticity parameter , and the position angle of each structure’s long axis.
Since the MRSS does not contain galaxy distances, in order to obtain distance estimates for the PF structures, we calibrated the relation following Dalton et al. (1997). The first step of the procedure was to compare the positions of the structure centers, as given in the PF Catalogue, with those in the ACO ( Abell et all. 1989) and APM cluster (Dalton et al. 1997) If the distance between the centers of the PF and ACO clusters was less than 0.5 of the PF equivalent cluster radius, the two objects were regarded as identical. More than 1000 such identifications were found. Only 466 ACO clusters from the list have measured redshifts z in NED. The calibration of the relation in the form: based on 455 data points is illustrated in Fig. 1 of papers Biernacka, Flin and Panko (2009) and Panko et al. (2009a). The structure identification was repeated using a value of 0.3 of the PF cluster radius as a new criterion of identity. That produced a similar relationship, but based on a smaller number of center coincidences.
We repeated the procedure with data from APM clusters, taking the measured redshift from the APM cluster catalogue (Dalton et al. 1997). Additional calibration of the relation was possible through the comparison of a deeper version of the PF catalogue with the ACO catalogue. The deeper version of the catalogue is not statistically complete, because the limiting magnitude of considered galaxies is . For future work we select the relation: . Each particular relation is located within the confidence limits for the other relations: but even the most discordant relations give a maximal difference in of only 0.02 for a magnitude limit of .
3. THE METHOD OF INVESTIGATION


There are two methods for galaxy orientation study. In the first one (Hawley & Peebles 1975) the analysis of the distribution of the observed position angle of the galactic image major axis was carried out. The second approach allowed us to use also the face-on galaxies. This method, based on the de-projection of the galaxy images, was originally proposed by Öpik (1970), applied by Jaaniste & Saar (1977) and significantly modified by Flin & Godłowski (1986, 1989) and Godłowski (1993, 1994). In this method, the galaxy’s inclination with respect to the observer’s line of sight is considered. Two possible orientations of the galaxy plane were determined, which gave two possible directions perpendicular to the galaxy plane. It is expected that one of these normals corresponds to the direction of galactic rotation axis. Such study gives a four-fold ambiguity in the solution for angular momentum. By the reason of no information connected with the direction of the galaxy spin our analysis is reduced to only two solutions. The inclination angle was calculated according to the formula valid for oblate spheroids Holmberg (1946): , where observed axial ratio and is ”true” axial ratio. We used standard value . For each galaxy, two angles are determined: - the angle between the normal to the galaxy plane and the main plane of the coordinate system and - the angle between the projection of this normal onto the main plane and the direction towards the zero initial meridian. Using the equatorial coordinate system, the following relations hold between angles (, , ) and (, )
| (1) |
| (2) |
where . In order to detect non-random effects in the distribution of the investigated angles: , and we carried out three different statistical tests. These test were : the test, the autocorrelation test and the Fourier test (Hawley & Peebles 1975, Godłowski 1993, 1994). Studying the distribution of position angles, face-on and nearly face-on galaxies were excluded from the analysis. In this case only galaxies with axial ratio were taken into consideration. In our previous paper (Godłowski et al. 2010), during analysis of and angles, we took into account all galaxies, including face-on. In the present paper also in this case we taking into account only galaxies with axial ratio . It mean that we exclude face-on and nearly face-on galaxies. We checked whether the distributions of the investigated angles (, and ) in each individual cluster were isotropic (for details see Godłowski, et. al 2010).
4. RESULTS
4.1. The dependence of alignment on the cluster richness

Expected isotropic distribution of and (polar and azimuthal) angles are modified if some galaxies (for example face on galaxies) are excluded from the analysis. In such situation expected isotropic distribution should be found from Monte Carlo simulation. In the paper Godłowski et al. (2010) during analysis of and angles we took into account all galaxies. Figure 1 in this paper shows the observed and theoretical distribution the investigated angles (, and ) for two studies in the past, cluster A2254 and A2771. Now we present appropriate theoretical and observed distribution of , , and angles for clusters A2254 and A2771 (Fig.1) in the case when we excluded galaxies with . Please note that our plots are very similar to that obtained by Aryal, Paudel, Saurer (2007).
On the base of our previous papers (Godłowski, Baier and Mac Gillivray 1998, Godłowski & Ostrowski 1999, Baier, Godłowski and Mac Gillivray 2003 and Godłowski, Szydłowski Flin 2005) the suggestion was found that we do not observe any alignment in sparsely populated clusters, while such alignment is observed in a number of rich clusters of galaxies. However, this suggestion (Godłowski, Szydłowski and Flin 2005 and later confirmed by Aryal, Pudel and Saurer 2007) was only a qualitative and quantitative analysis on this issue was not provided.
| sample | ||||||||||||
|---|---|---|---|---|---|---|---|---|---|---|---|---|
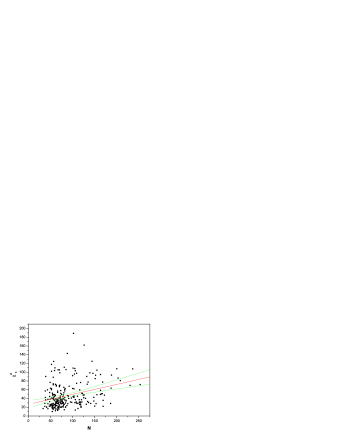
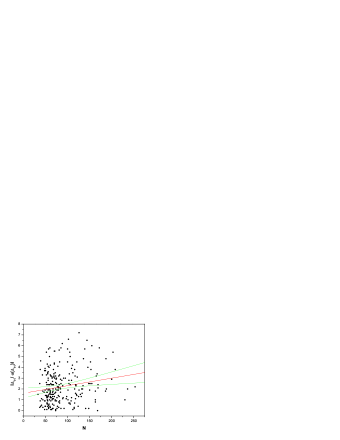
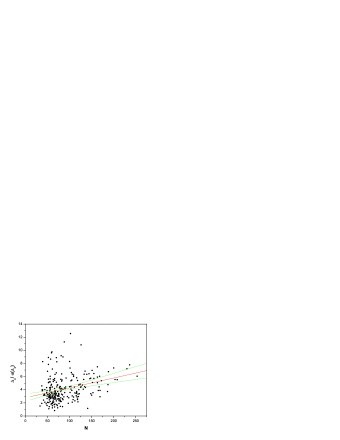
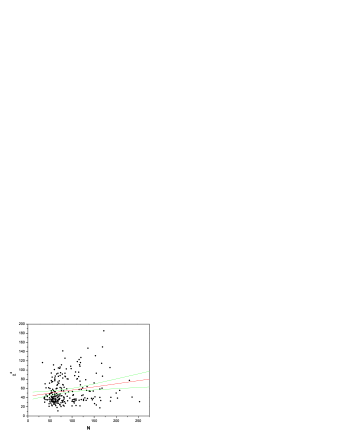
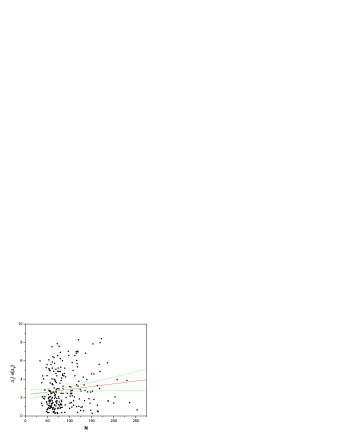
Therefore Godłowski et al. (2010) examined orientation of galaxies in clusters both qualitatively and quantitatively and found a sharp increase of galaxy orientation alignment with richness of the cluster. Both in the present paper and Godłowski et al. (2010) we analyzed the orientation of galaxies in the 247 optically selected very rich Abell clusters, having in the area considered as cluster at least 100 members. In the paper Godłowski at al. (2010) during analysis of and angles we took into account all galaxies (including face-on ones). Now we present the analysis of , angles in the case when galaxies seen face-on and nearly face-on are excluded. The position angles of the galaxy major axis image as well as two angles , and describing the spatial orientation of galaxy plane were tested for isotropy, applying three different statistical tests. We investigated the relation between the values of the applied statistics and the cluster richness for investigated angles, both in equatorial and supergalactic coordinate system. The results are shown on Fig.2 and Table 1. We found that the values of applied statistics increase with the number of member galaxies, which means the relation between anisotropy and cluster richness. The search for connection of galaxy alignment and Bautz - Morgan morphological type of parent cluster gave only weak dependence. The statistically marginal relation between velocity dispersion and cluster richness was observed. At almost level velocity dispersion decreases with Bautz - Morgan type. The effect increases if we restricted the cluster membership to galaxies brighter than , which suggests that this effect is really connected with clusters. We also repeated the analysis using sample of galaxies containing magnitude range . There was no significant differences between results of linear regression for sample with magnitude range and . One should note that excluding from analysis face-on and nearly face-on galaxies does not change our results significantly with comparision to the results Godłowski et al. (2010) paper.
These results showing the dependence of galaxy alignment on either the cluster richness or other tested parameters are due to environmental effect. In our opinion the observed relation between the richness of galaxy cluster and the alignment is due to tidal torque, as suggested by Catelan & Theuns 1996). One should note however, that our finding is also in agreement with prediction of the Li model (Li 1998, Godłowski Szydłowski and Flin 2003).
4.2. The alignment of the brightest cluster galaxy with the parent cluster
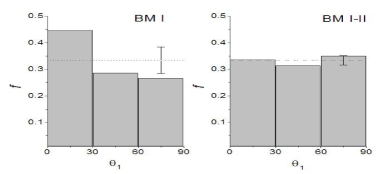
For 1056 PF structures, which has been identified with ACO (Abell et al. 1989) clusters, with known BM morphological types we studied the alignment of the brightest galaxy with the parent cluster. We investigated for isotropy acute angle being the difference between the structure position angle and the position angle of the brightest cluster galaxy (Panko et al. 2009b). Several subsamples were analaysed for isotropy of the angle. The distance between clusters as well as the BM morphological types served for subsamples selection. The isotropy of the distrbtion was tested by applying statistcal tests mentioned above (section 4.1). Only in the case of clusters BM I the distribution was non random; the small excess of small angles was observed, which means that the brightest cluster member tends to be aligned with the parent cluster. In Fig.3 two distributions of the angles for cluster of BM types I and I-II are given. (Panko et al. 2009b). Moreover the orientation of the tenth brightest galaxies in each structure was checked for the isotropy. The distribution of (where i=1,2,3,10, ) appeared to be isotropic (Panko et al. 2009b). A separate test was performed to establish whether the observed angle in a particular bin deviates from a isotropy by more than a standard deviation - where N is the number of objects expected in the bin for a random distribution. Separately, the isotropy of the distribution of 6188 structures position angles, as well as 1056 PF structures identified with ACO clusters was tested. In any cases, we do not find any significance deviation from isotropy. Therefore, we concluded, that the analysed distributions were isotropic.
4.3. The alignment of galaxy clusters
Binggeli (1982) found that galaxy clusters tend to point each other. We search for Binggelli’s efect through invesigations of the dfference between the postion angle of cluster and direction toward neigbouring structures. The resulting acute angle was tested for isotropy. Only after restrictng our samples to more elongated structures ( ) the distributions became anisotropic, with the excess of small angles, which indcates the existece of the Binggeli’s effect. This effect was statistically weak and observed in the case of all 1056 structures, as well as after dividing according to BM types. The strongest effect was for BM I and BM III. The range of the distance in which the effect was observed, was about .
4.4. The orientation of galaxy groups in the Local Supercluster
We analysed also the orientation of galaxy groups in the Local Supercluster (Godłowski & Flin 2010). It is strongly correlated with the distribution of neighbouring groups in the scale till about 20 Mpc. The group major axis is in alignment with both the line joining the two brightest galaxies and the direction toward the centre of the LSC. These correlations suggest that two brightest galaxies were formed in filaments of matter directed towards the protosupercluster centre. Afterwards, the hierarchical clustering leads to aggregation of galaxies around these two galaxies. The groups are formed on the same or similarly oriented filaments.
5. CONCLUSIONS
We study the distribution of several parameters connected with the angular momenta of galaxies. In the CDM model, which is the most popular one, the angular momenta of galaxies are mainly due to tidal torquing of neigbouring galaxies. Our result that alignment of galaxies in rich cluster is increasing with the number of galaxies in clusters is due to tidal torque, as suggested by Catelan & Theuns (1996). One should note however, that our finding is also in agreement with prediction of the Li model (see also Godłowski 2011).
The observed alignment of the brightest cluster galaxy with the parent cluster for BM I type clusters shows the special role played by gigantic cD galaxy during the evolution of cluster. The alignment of groups in the LSC is observed till about Mpc. The group major axis is aligned with both the line joining the two brightest galaxies and the direction toward the centre of the LSC, this is Virgo Cluster. Two brightest galaxies were formed on the filament of matter directed toward the protocluster centre. Afterwards, the hierarchical clustering leads to aggregation of galaxies around these two galaxies. The groups were formed on the same or similarly oriented filaments. This picture is in agreement with both the prediction of numerical simulation and expectation of CDM models.
The covariance ellipse method is a good tool for cluster ellipticity studies (Biernacka & Flin 2011). The shape of each structure projected on the celestial sphere was determined using the covariance ellipse method. Analysis of the data indicates that structure ellipticity changes with redshift. Nearer structures are more round, which can be attributed to virialisation processes occurring in the not so distant past (see also Struble &. Ftaclas)
ACKNOWLEDGMENTS. The present research has made use of the NASA/IPAC Extragalactic Database (NED), which is operated by the Jet Propulsion Laboratory, California Institute of Technology, under contract with the National Aeronautics and Space. This research has also made use of NASA’s Astrophysics Data System. The present research was partially supported by the Jan Kochanowski University grants BS 052 and BW116. EP thanks the Jan Kochanowski University for support during her stays in Poland.
REFERENCES
Abell, G.O., Corin, H.G., Olowin, R.P., 1989, APJS, 70,1
Aryal, B., Paudel, S., Saurer, W. 2007, MNRAS, 379, 1011
Baier, F., Godłowski, W., Mac Gillivray H.T., 2003, A&A, 403, 847
Biernacka, M., Flin, P., Panko, E., 2009, ApJ
Biernacka, M., Flin, P., 2011, AN, 332, 537
Binggeli, B., 1982, A&A, 107, 338
Bower, R. G., Benson, A.J., Malbon, R., et al. 2006, MNRAS, 370, 645
Catelan, P., Theuns, T. 1996, MNRAS, 282, 436
Dalton, G., Maddox, S., Sutherland W., Efstathiou, G., 1997. MNRAS 289, 263
Dekel, A., 1985, APJ, 298, 461
Doroshkevich, A. G. 1973, APJL, 14, 11
Flin, P., Godłowski, W., 1986, MNRAS, 222, 525
Flin, P., Godłowski, W., 1989 Sov.Astron.Lett. 15, 374 (Pisma Astr.Zur. 15, 869)
Godłowski, W. 1993, MNRAS, 265, 874
Godłowski, W. 1994, MNRAS, 271, 19
Godłowski, W. 2011, IJMPD (accepted) arXiv 1103.5786
Godłowski, W., Baier, F., Mac Gillivray, H.T., 1998, A&A, 339, 709
Godłowski, W., Ostrowski, M., 1999, MNRAS, 303, 50
Godłowski, W., Flin, P., 2010 APJ, 708, 920
Godłowski, W., Piwowarska, P., Panko, E., Flin, P., 2010, APJ, 723, 985
Godłowski, W., Szydłowski, M., Flin, P., Biernacka, M., 2003 GRG, 35, (5), 907
Godłowski, W., Szydłowski, M., Flin, P. 2005 GRG, 37, (3) 615
Hawley, D. I., Peebles P. J. E. 1975, AJ, 80, 477
Holmberg, E. 1946, Medd. Lund. Astron. Obs. Ser. VI, Nr. 117
Jaaniste, J. Sarr, E. 1977 Tartu Obs. Preprint A-2
Lee, J., Pen, U. 2002, APJ, 567, L111
Li, Li-Xin. 1998, GRG, 30, 497
Öpik, E.J. 1970, Irish AJ, 9, 211
Panko, E., Flin P., 2006 The Journal of Astronomical Data 12, 1
Panko, E., Juszczyk, T., Biernacka, M., Flin, P., 2009a, APJ, 700, 1686
Panko, E., Juszczyk, T., Flin, P., 2009b, AJ, 138, 1709
Peebles, P.J.E. 1969, APJ, 155, 393
Peebles, P.J.E., Yu, J., T. 1970, APJ, 162, 815
Ramella M., Boschin W., Fadda D., Nonino M. 2001, A&A, 368, 776
Silk, J. 1968, APJ, 151, 459
Silk, J., Efstathiou, G. A. 1983, Fundamentals of Cosm. Phys. 9, 1
Struble, M., F. Ftaclas C. 1994, AJ 108, 1
Sunyaev, A. R., Zeldovich, Ya. B., 1970, Astroph. Sp. Sci., 7, 3
Sunyaev, A. R., Zeldovich, Ya. B., 1972 A&A, 20, 189
Shandarin, S.F. 1974, Sov. Astr. 18, 392
Trujillo, I., Carretero C., Patri G. 2006, APJ, 640, L111
Tully, R. B. 1988, Nearby Galaxy Catalog, Cambridge Univ.Press: Cambridge
Ungruhe, R., Seitter, W., Durbeck, H. 2003, Journal of Astronomical Data, 9, 1
Wesson, P. S. 1982, Vistas Astron., 26, 225
Zeldovich, B. Ya. 1970, A&A, 5, 84