Estimating within-school contact networks to understand influenza transmission
Abstract
Many epidemic models approximate social contact behavior by assuming random mixing within mixing groups (e.g., homes, schools and workplaces). The effect of more realistic social network structure on estimates of epidemic parameters is an open area of exploration. We develop a detailed statistical model to estimate the social contact network within a high school using friendship network data and a survey of contact behavior. Our contact network model includes classroom structure, longer durations of contacts to friends than nonfriends and more frequent contacts with friends, based on reports in the contact survey. We performed simulation studies to explore which network structures are relevant to influenza transmission. These studies yield two key findings. First, we found that the friendship network structure important to the transmission process can be adequately represented by a dyad-independent exponential random graph model (ERGM). This means that individual-level sampled data is sufficient to characterize the entire friendship network. Second, we found that contact behavior was adequately represented by a static rather than dynamic contact network. We then compare a targeted antiviral prophylaxis intervention strategy and a grade closure intervention strategy under random mixing and network-based mixing. We find that random mixing overestimates the effect of targeted antiviral prophylaxis on the probability of an epidemic when the probability of transmission in 10 minutes of contact is less than 0.004 and underestimates it when this transmission probability is greater than 0.004. We found the same pattern for the final size of an epidemic, with a threshold transmission probability of 0.005. We also find random mixing overestimates the effect of a grade closure intervention on the probability of an epidemic and final size for all transmission probabilities. Our findings have implications for policy recommendations based on models assuming random mixing, and can inform further development of network-based models.
doi:
10.1214/11-AOAS505keywords:
.T1Supported by the NIH/NIGMS MIDAS Grant U01-GM070749.
, , and
1 Introduction
Schools play an important role in transmission of infectious diseases, so understanding the transmission process within schools can improve our ability to plan effective interventions. School closure is known to reduce disease transmission, as demonstrated by Chao, Halloran and Longini (2010), Rodriguez et al. (2009) and Hens et al. (2009a), but this approach is costly on both an individual and societal level. Mathematical models show that vaccinating school-aged children is an effective strategy when vaccine supplies are limited; see, for example, Loeb et al. (2010) and Basta et al. (2009). When a new strain of influenza virus or other pathogen has emerged, large-scale agent-based epidemic simulation models have been used to predict epidemic spread and compare intervention strategies. The methodology underlying these models is described in Halloran et al. (2008), Germann et al. (2006), Eubank et al. (2004) and Ferguson et al. (2006). These models simulate human contact behavior, and disease may be transmitted when an infectious person contacts a susceptible person. In most such models, social contact behavior is approximated by random mixing within classrooms and schools, as well as homes, workplaces and other mixing groups. That is, people contact other mixing group members with equal probability during each time step. This process is a simplification of the true underlying social structure.
Simulation studies have shown that network structure can influence epidemic dynamics. Several papers have demonstrated the varying influence of clustering and repetition in contacts on disease spread for a range of parameter values. Among these, Eames (2008), Smieszek, Fiebig and Scholz (2009) and Duerr et al. (2007) simulate idealized, simplified networks that are not informed by data on contact behavior. For example, the number of contacts in their models is equal for all individuals. Miller (2009) explores these network structures using Episims, a realistic agent-based network simulation model built from transportation, location, activity and demographic data, but not directly informed by contact surveys [Eubank et al. (2004)]. Keeling and Eames (2005) and Read, Eames and Edmunds (2008) explored the influence of degree distribution on disease spread, where the degree of a person is the number of contacts he/she makes. The former of these uses a contact survey of 49 respondents, while the latter performs simulations based on idealized networks. The development of statistical techniques to infer detailed and realistically complex network models for face-to-face contacts based on available survey data is a relatively new area. Recent work with the multicountry European POLYMOD study, a diary-based survey of contact behavior, has inferred within-household contact networks [Potter et al. (2011a)] and age-based mixing matrices [Mossong et al. (2008), Hens et al. (2009b)], but we do not yet have a clear picture of the entire contact network, nor a complete understanding of the relevant network structures for epidemic transmission.
Some papers have focused on characterizing within-school contact behavior in the context of understanding disease transmission. Glass and Glass (2008) administered contact surveys in an American elementary, middle and high school, and characterized contact duration and intensity by grade and location. Conlan et al. (2011) developed a new method to collect contact network data and analyzed mixing patterns, clustering and other network properties in 11 British primary schools. Although these studies provide important information regarding contact behavior within schools, neither develops a method for inference of the entire within-school contact network. Cauchemez et al. (2009) analyzed network and symptom status data in a fourth grade class during the H1N1 influenza pandemic. They found that selective mixing by gender influences the disease dynamics, but found no evidence for a playmate network or classroom neighbor effect on the transmission probability. However, because the sample size was small and asymptomatic and unobserved cases were not accounted for in the analysis, their findings are not definitive. Stehlé et al. (2011a) describe a face-toface contact network in a primary school using proximity sensor data. Salathé et al. (2010) analyze wireless sensor data to describe the contact network in an American high school and demonstrate through simulation studies that using network data to inform interventions can reduce the disease burden. Xia et al. (2010) demonstrate that modeling network structure within schools in a large-scale simulation model can impact global epidemic dynamics.
In this paper we develop a statistical model of a within-school contact network in order to understand how social network structures within schools influence disease transmission. In Section 2 we describe our two data sources: friendship network data from a high school and a survey on contact behavior in high schools. Section 3 describes our methodology to model the contact network and compare epidemics based on this contact network to those under random mixing. In Section 3.1 we outline our method to model the contact network conditional on the friendship network. In Section 3.2 we describe how we estimate the contact degree distribution from the contact survey, and in Section 3.3 we describe how we model the contact network conditional on the degree distribution. In Section 3.4 we describe how we simulate contact networks from our model, and we describe our influenza simulation procedure in Section 3.5. We then compare performance of different variations of the contact network model in Section 3.6. In Section 3.7 we present our model for the friendship network itself. In Section 3.8 we describe our procedure to compare epidemics based on our network model to random mixing under three different scenarios: no intervention, a targeted antiviral prophylaxis intervention, and a grade closure strategy. Results from these comparisons are presented in Section 4 and discussed in Section 5.
2 Data
We use two data sources to inform our contact network model. The first is friendship network data from the Add Health study, a survey of health, demographic and relational data administered in 80 American high schools spanning grades 7–12, or high school plus feeder school combinations for high schools not spanning those grades [Harris (2009)]. The second was A Survey on Epidemics in High Schools, administered in two Virginia high schools by the Network Dynamics and Simulation Science Laboratory at Virginia Polytechnic Institute and State University during the spring of 2009 [Xia et al. (2010)]. The goal of the Add Health study was to survey all students in each school [Harris et al. (2009)]. Prior to the survey, each school created a school roster listing all students with identification numbers. Students were given a copy of the roster and identified their five best male friends and five best female friends. Students could nominate friends not on the roster, and could nominate fewer than five friends of each sex. In this paper, we analyze one school configuration with 1,314 students. We selected this school because it is fairly large and has less missing data than other schools. We model contact behavior among the 1,074 students who responded to the survey, were on the school roster on the survey date, and have nonmissing grade values. We assume that two students are friends if a reciprocated or unreciprocated nomination occurred. By defining friendship in this way, the friend degree distribution in this data set is similar to that found in the contact survey. The two degree distributions are compared in Figure 1.
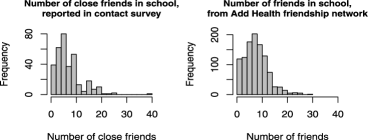
Our contact data source, A Survey on Epidemics in High Schools, was administered in two Virginia high schools. In one, classes were randomly sampled and the survey given to all consenting students in the sampled classes, resulting in a sample of 116 of 1,116 students. In the other, the goal was to survey all 425 students, but only 246 students returned the survey because interviewers did not explicitly state that students were supposed to return the form. We’ll refer to this from here on as the “epidemic survey.” The survey defines a “contact” to mean “being in close proximity for more than roughly five minutes.” Respondents reported the average number of contacts they make during class breaks and the lunch break, the number of close friends they have in their school, and whether students sitting near them in class are mostly close friends, classmates but not close friends or a mix of the two. They also estimated the percentage of contacts they made to friends.
Figure 2 shows the relationship between friendship network, contact network and transmission network. The top panel depicts a subset of the Add Health friendship network.
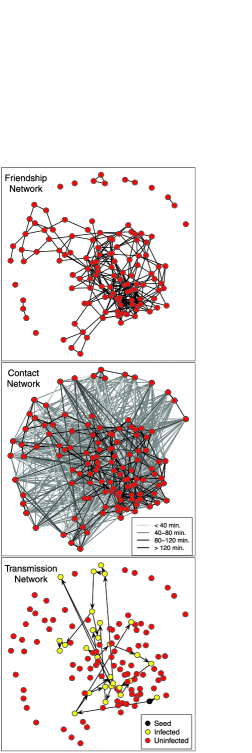
The middle panel shows a simulated contact network among this same set of students for one day. Here, an edge between two nodes means they made one or more contacts, and the shade of the edge represents the total duration of contact throughout the day for that pair. The contact network is denser than the friendship network, as students tend to contact their close friends as well as many other students during a typical school day. Of key scientific interest is the transmission network, an example of which is shown in the bottom panel. The dependency in the networks is shown by the higher numbers of contacts between friends and higher numbers of transmission events between friends. In this paper we focus on inference of the contact network and explore how contact network structure impacts the transmission process.
3 Methodology
Our friendship network data forms the basis for our contact network model. One approach to model the contact network for these students would be to let friendships represent contacts, assuming that students contact all of their close friends, and no other schoolmates, on a given day. Such a model would be overly simplistic. We believe that students are more likely to contact their friends and make longer durations of contacts to friends, but also contact other students in their classes and in the school. We build a complex model capturing these tendencies. We model contact behavior among the students in the Add Health friendship network, using the epidemic survey to estimate numbers of contacts and preference of contacts to friends. Finally, we estimate the friendship network itself from individual-level attributes so that our model can be used for an arbitrary school.
3.1 Modeling the contact network conditional on the friendship network
We first describe our methodology to estimate the contact network conditional on the empirical friendship network. We chose to model the friendship network itself as a final step. Comparison of epidemics based on the empirical friendship network to those based on a friendship network simulated from our model assists with model validation for the friendship network model. Through this comparison, we assess whether the friendship network model captures the network structures relevant to the transmission process.
We can represent the contact network graphically by letting each student be a node and each contact be an edge between two nodes. The degree of a node is the number of contacts made by that student during one day. We denote the contact network by an by sociomatrix , where is the number of students in the school. denotes the number of 10-minute contacts between student and student . Each pair of nodes in the network is referred to as a dyad.
We assume that students have seven classes of 40 minutes each, a 50-minute lunch break and five 10-minute nonlunch breaks. We define a “contact” to be a 10-minute face-to-face social contact. If two students spend an hour together, that is considered six “contacts.” We allow a maximum of 38 contacts (6 hours and twenty minutes) between any two students on a given day.
3.2 Modeling the contact degree distribution
We model the degree distribution of the network using data from the epidemic survey. We assume that students reported numbers of schoolmates contacted rather than numbers of 10-minute chunks of time spent in contact. We model break contacts and lunch contacts with negative binomial distributions because the observed sample mean and variance indicate over-dispersion. We used number of friends as a predictor, expecting students with higher numbers of friends to make more contacts at school. We fit a generalized linear model with the glm.nb function in the MASS library in R [Venables and Ripley (2002), R Development Core Team (2008)]. Before fitting, we modified some outliers: we recoded 11 reports of break contacts greater than 20 to 20, and we removed 11 reports of numbers of close friends that were over 40, assuming that these students defined “close friend” differently than the others. Our model estimates a mean of 4.5 break contacts for a student with zero friends and an increase in expected number of break contacts by a factor of 1.03 for each additional friend (95% C.I.: [1.01, 1.04]). Using the same model, we found no association between lunch contacts and number of close friends; the model estimated an increase in expected number of lunch contacts by a factor of 1.00 for each additional friend (95% C.I.: [1.00, 1.00]; ). Therefore, we estimated the lunch contact distribution with a negative binomial distribution with no predictor. To reduce the influence of outliers, we used a fitting procedure which assumes that reports above a specified cutoff contain no other information apart from being above the cutoff. We chose a cutoff of 30 for average lunch contacts, so reported lunch contacts over 30 were treated as if these students had reported “30” lunch contacts. We assumed that lunch contacts could be 10, 20, 30, 40 or 50 minutes with equal probability, so we multiplied each simulated contact by a randomly chosen number between one and five. The fitting procedure is implemented with the anbmle() function available in the degreenet package in R [R Development Core Team (2008), Handcock (2003)].
Classroom contacts were not reported, so we create a model for the within-classroom contact degree distribution as follows. We assumed students take classes only with others in the same grade. Each student is randomly assigned to have 2, 3 or 4 class neighbors with probabilities , and in each class. We assumed that students make 40 minutes of continuous contact with each of their neighbors during each class period, that they have the same class neighbors each day, and that they only contact class neighbors during class time.
The distribution of total contacts is obtained by summing the classroom, lunch and break contacts together for each student. This distribution has a mean of 148, or 25 person-hours of contact per student per day. We validated our fitted degree distribution by comparing it to contact reports from an alternate data source, the POLYMOD study [Mossong et al. (2008)]. This validation is described in the supplementary material [Potter et al. (2011b)].
3.3 Modeling the contact network conditional on the degrees
We depict the degrees as a set of nodes representing students, each of whom has a number of stubs representing their contacts. In this section we describe how these stubs will be linked, forming the entire network of contacts between students. We denote the degrees as a vector of length , where is the number of contacts student makes in one day.
Let be the sociomatrix of contacts occurring during any of the class breaks or during lunch and denote the within-class contact sociomatrix, so . We model conditional on the break and lunch contact degrees, and we model conditional on the class contact degrees. Let denote the vector of break/lunch degrees. Then the probability distribution for can be expressed:
Because respondents in the epidemic survey report an average of 68% of contacts occurring to friends, our model distributes 68% of contacts to friends and 32% to nonfriends, with a maximum of 10 contacts per dyad allowed (since there are 100 minutes in the 5 breaks plus lunch period combined). Apart from these constraints, contacts occur randomly conditional on the degree distribution, which means that all networks satisfying these constraints have equal probability:
where is a normalizing constant.
We develop a method to simulate networks from a specified degree vector, with random mixing conditional on degree and permitting multiple edges (up to a specified maximum) between two nodes. Our method is an extension of the reedmolloy() function in the degreenet package in R [R Development Core Team (2008), Handcock (2003)]. Denote the maximum number of edges and the target percentage of edges to friends , and let denote the degree of node . We first compute the target number of contacts between friends, denoted by :
We randomly sample a stub, and let denote the node possessing this stub. We consider the set of friends of which have fewer than edges to . We randomly sample one friend from this set, with probability proportional to the remaining (unassigned) degree of each friend. Then the two stubs are connected. This procedure is repeated until we have contacts between friends. Next, we repeat the process for nonfriend contacts. The procedure requires the sum of the degrees to be even and enough friendships so that times the number of friendships is greater than or equal to . Since self-self edges are not permitted, the procedure also requires .
To simulate break/lunch contact networks, we first sample lunch and break contacts from the fitted degree distributions for each student. Then we distribute 68% of contacts to friends, with a maximum of 10 contacts occurring between any pair of friends.
Next we describe the probability distribution for our class contact network. We assume that students take classes only with others in the same grade. We model the matrix of class neighbors, , where is the number of classes in which and are neighbors. We then assume that each pair of class neighbors makes 40 minutes of continuous contact during each shared class, so the contact matrix is .
To model , let denote the by matrix showing classroom neighbors within grade . That is, if and are in grade , then the th element of is the number of classes in which and are class neighbors, and if or is not in grade , then . Then . We model degrees of class neighbors within grade as described previously. Because 74% of respondents in the epidemic survey reported sitting next to “A mix of friends and nonfriends” in class, we assume that 50% of class neighbors are friends. Using the procedure described above, we distribute 50% of class neighbors to be friends and allow students to be neighbors in more than one class, with a maximum of 7 shared classes. Thus,
where is a normalizing constant.
To simulate a class contact network for one day, we first sample class neighbor degrees for each grade from the fitted degree distributions. Then we use our modified reedmolloy() function to distribute 50% of neighbors to friends, allowing two students to be neighbors in a maximum of 7 classes, for each of the grades. We multiply these class neighbor matrices by four to obtain class contact matrices for each grade, and sum the seven grade-specific class contact matrices to obtain the class contact matrix for the entire day.
3.4 Contact network simulation procedure
In this section we describe our algorithm to simulate contact networks from our model. The uncertainty in estimation of the input parameters to our model will propagate to create uncertainty in epidemic predictions. We use a nonparametric bootstrap to estimate this uncertainty [Efron and Tibshirani (1993)].
We simulate a contact network as follows:
[(2)]
Resample with replacement from the epidemic survey.
Using the resampled data, estimate degree distribution parameters (as described in Section 3.2), and compute the average percentage of contacts to friends. Denote this percentage by , where %.
Simulate break and lunch contact degrees from the fitted distributions.
Link stubs (as described in Section 3.3) so that % of break and lunch contacts are between friends.
Simulate class neighbor degrees from the assumed degree distribution, described in Section 3.2.
Link stubs (as described in Section 3.3) so that 50% of class neighbors are friends.
Multiply by 4, assuming that class neighbors make 40 minutes of continuous contact in each shared class.
Sum the break/lunch contact network and class contact network matrices to obtain the contact network matrix for one day.
To produce a dynamic contact network model, we sample a new break/lunch contact network each day of the influenza season, but keep the same class contact network throughout the influenza season. In the supplementary material, we present descriptive analyses of contact networks simulated from our model and find their properties to be consistent with our observed data [Potter et al. (2011b)].
3.5 Influenza simulation procedure
We simulated influenza outbreaks in schools using the natural history of influenza as was done by Chao, Halloran and Longini (2010). We assume that each student has an incubation period (time between exposure and appearance of symptoms) of 1, 2 or 3 days with probabilities 0.30, 0.50 and 0.20, respectively. Each infected person stays infected for exactly 6 days, after which he/she is moved to the immune category. Transmission can occur only when contact is made between an infected person and a susceptible person. For each infected person, we sample a curve of viral load over time from those of six patients in the human challenge study described in Murphy et al. (1980) and Baccam et al. (2006), and we assume that the infectiousness of each person on a given day is proportional to their viral load. We assume that 67% of students become symptomatic during their infectious period, and symptomatic people are twice as infectious as asymptomatic people, so their infectiousness is proportional to twice their viral load. Let denote the per-10-minute transmission probability of person on day . The events that transmits to during two different 10-minute contacts are dependent, since transmission during the earlier contact precludes transmission during the latter. Thus, if is susceptible,
so
We assume 75% of sick students withdraw to the home: 20.3% on the first day they have symptoms, 39.7% on the second, and 15% on the third [Chao, Halloran and Longini (2010), Elveback et al. (1976)].
We used mean per-10-minute transmission probabilities ranging from 0.001 to 0.007. We track the epidemic until no infected people remain. We estimated the probability of epidemic (defined as more than 200 students becoming infected), the peak date of the disease season and the final epidemic size. In performing simulations for model comparison (described in the following section), we simulated 500 outbreaks for each model; this number was sufficient to distinguish between them. In performing simulations validating the friendship network model fit, we simulated 2,000 outbreaks, which was sufficient to validate model fit. For simulations using our final model and random mixing, with and without interventions, we simulated 10,000 outbreaks for each scenario to minimize uncertainty in epidemic outcome estimates.
3.6 Model comparison
We compared three different versions of the contact network model. In the dynamic contact network model, students keep the same class contacts for the duration of the influenza season, but we sample a new break/lunch contact network each day. There is, to our knowledge, no previous work on modeling dynamic within-school contact networks, and we consider this to be our most realistic model. To assess whether these dynamics influenced epidemic predictions, we compared this to a static contact network model, in which students contact the same people each day for the duration of the influenza season. The static network approach is commonly used to model influenza epidemics [Miller (2009)]. Finally, we investigated whether the transmission process is driven purely by the friendship structure by implementing a friendship-only model, in which students only contact their friends. We calibrated the friendship-only model so that the expected total number of contacts in all models is the same. Comparison to this model will reveal whether the additional network structure we added, including a proportion of contacts to nonfriends, variation in contact degree and classroom structure, has an impact on epidemic predictions.
We simulated 500 epidemics over each of these three models using the natural history of influenza described above. Epidemic outcomes, displayed in Figure 3, are essentially identical in the static and dynamic contact network models. A similar result was found in a different setting by Stehlé et al. (2011b).
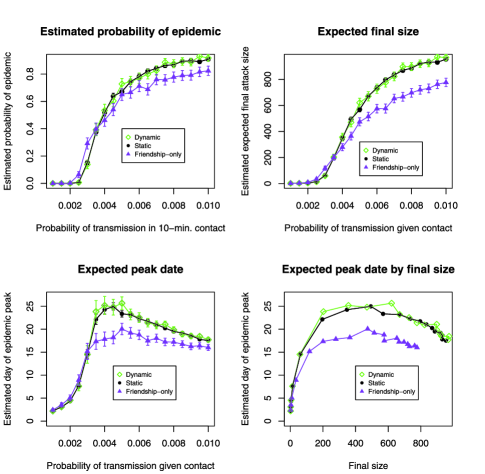
This is because our dynamic model creates a sequence of highly correlated contact networks. Although break/lunch contact networks are sampled independently from one day to the next, these networks are dependent because they rely on the same underlying friendship network, which stays the same for the whole influenza season. We found that most contacts which change status from on to off or vice versa are only 10 minutes in duration. These dynamics do little, if anything, to shift the course of the epidemic. The friendship-only model behaves quite differently. The friendship-only model is oversimplified, and the additional network structure of classroom contacts and distribution of nonfriend contacts creates a more realistic model. Therefore, we selected the static network model for our final model.
3.7 Modeling the friendship network
Our contact network model described above is conditional on the empirical friendship network. To generalize our model, we need to model the friendship network itself; we do so using an exponential family random graph model (ERGM). We represent the friendship network by a sociomatrix . An ERGM models the sociomatrix for a network of fixed size as follows:
Here, denotes the space of all possible networks of this size, and is a normalizing constant which ensures that the probability distribution sums to 1. is a vector of parameters, and is a vector of network statistics, such as the number of edges between actors of the same race, the number of triangles or others. These statistics capture social principles such as the tendency to befriend others with like attributes or transitivity. A dyad-independent ERGM is a model in which the probability of observing an edge on one dyad is independent of the probability of observing an edge on other dyads (although it may depend on individual-level and dyadic attributes). The parameter estimates are obtained by their maximum likelihood estimates (MLE). In many cases there is no analytic form for the normalizing constant , which is difficult to approximate because of the large number of possible networks for an undirected network. Instead the MLE is approximated through a Markov chain Monte Carlo procedure described by Geyer and Thompson (1992). However, a dyad-independent ERGM may be estimated with logistic regression rather than the MCMC procedure.
3.7.1 Model selection
Our model is based on the work of Goodreau, Kitts and Morris (2009), who use exponential random graph models to describe friendship patterns in all 80 schools in the Add Health data set. The authors model the network of mutual friendship nominations for each school. Their model includes sociality terms for each grade, race and gender, selective mixing by race, grade and gender, and a transitivity term which captures the tendency of friends of friends to also be friends, conditional on other terms in the model. Our ERGM includes these effects minus the transitivity term, so is slightly simpler, although we also included a school mixing effect.
Table 1 shows coefficient estimates for our model. The sociality terms capture whether 8th graders form larger numbers of friendships, on average, than seventh graders (the reference category for grade), etc. These terms are interpreted as follows: a friendship is times more likely to occur from a randomly chosen person to an eighth grader than to a seventh grader, assuming that the eighth grader and seventh grader are identical on other attributes included in the model. Other sociality terms are interpreted similarly. We see, for example, that eighth graders are significantly more social than seventh graders, but twelfth graders are not. Mixing coefficients represent the tendency to form friendships with others who have the same attributes as oneself; these are interpreted as follows: a friendship between two seventh graders is times more likely to occur than a friendship between two students in different grades, all other attributes being equal. The coefficient is for the race missing category because there are no friendships among this very small () group of students.
| Significance | ||||
|---|---|---|---|---|
| Variable | Coef. (SE) | Significance | Factor | of factor |
| Edges sociality | 10.91 (0.78) | *** | ||
| Grade 8 | 0.54 (0.13) | *** | Grade | *** |
| Grade 9 | 0.24 (0.09) | ** | ||
| Grade 10 | 0.57 (0.09) | *** | ||
| Grade 11 | 0.45 (0.09) | *** | ||
| Grade 12 | 0.01 (0.09) | |||
| Black | 0.12 (0.10) | Race | *** | |
| Hispanic | 0.81 (0.09) | *** | ||
| Asian | 0.19 (0.12) | . | ||
| Mixed race | 0.71 (0.09) | *** | ||
| Race missing | 0.58 (0.14) | *** | ||
| Male | 0.3 (0.03) | *** | Sex | *** |
| Selective mixing | ||||
| School | 1.73 (0.07) | *** | School | *** |
| Male | 1.05 (0.38) | ** | Sex | ** |
| Female | 1.18 (0.38) | ** | ||
| Grade 7 | 2.3 (0.15) | *** | Grade | *** |
| Grade 8 | 1.51 (0.15) | *** | ||
| Grade 9 | 1.88 (0.11) | *** | ||
| Grade 10 | 1.17 (0.11) | *** | ||
| Grade 11 | 1.61 (0.12) | *** | ||
| Grade 12 | 2.71 (0.13) | *** | ||
| White | 1.03 (0.10) | *** | Race | *** |
| Black | 3.19 (0.16) | *** | ||
| Hispanic | 0.5 (0.33) | |||
| Asian | 2.94 (0.26) | *** | ||
| Mixed race | 0.58 (0.20) | ** | ||
| Race missing | Inf (NA) |
We assessed whether our model captures the relevant network structures by simulating friendship networks from our estimated model parameters, simulating contact networks based on the simulated friendship data (as described in Sections 3.1–3.3), and then simulating 2,000 influenza epidemics over these contact networks (as described in Section 3.5). If our friendship model is adequate, epidemic outcomes from these simulations should resemble those estimated in simulations based on the empirical friendship network. We performed this procedure for three different simulated networks from our ERGM.
3.8 Methodology to compare contact network model to random mixing
We simulated influenza epidemics over the static contact network model and compared them to simulations over a random mixing scenario. We calibrated the random mixing model so that the expected number of people contacted per student per day is the same as in the friendship-based model (36), and the duration of contact is equal to the average duration of contacts in the friendship-based model (41 minutes).
We first simulated epidemics with no intervention. Then we simulated a reactive grade closure intervention, in which the entire grade of a student manifesting influenza symptoms is closed one day after detection of symptoms. Next, we investigated the impact of network structure on the estimated effect of a targeted antiviral prophylaxis (TAP) strategy. Under this strategy, all symptomatic people are given five days of antiviral treatment, and their contacts are given ten days of antiviral prophylaxis, starting the day after symptoms appear. Based on estimates by Halloran et al. (2007), we assume an antiviral efficacy against susceptibility () of 63%, antiviral efficacy against infectiousness () of 15%, and antiviral efficacy against pathogenicity () of 56%. Thus, the probability of getting infected during one contact is reduced by a factor of if the susceptible person is receiving prophylaxis, and further reduced by a factor of if the infectious person is receiving antiviral treatment. Treated people are times less likely to become symptomatic than untreated people.
4 Results
Figure 4 compares epidemic outcomes for simulations based on the empirical friendship network to those based on the simulated friendship network. The results are nearly identical, indicating that our estimated friendship network model captures the network structures relevant for disease transmission. We display epidemic outcomes for transmission probabilities in range displaying a broad spectrum of epidemic possibilities: 0.001 to 0.007. Transmission probabilities smaller than 0.002 were too small to produce epidemics, so the probability of epidemic is zero for that range, while estimated final size and peak date are negligible compared to estimates for larger transmission probabilities. The error bars in all plots in this section depict uncertainty arising both from estimation of parameter inputs to our model, as well as from the simulations. In most cases, the width of the error bar is smaller than the plotting symbol.
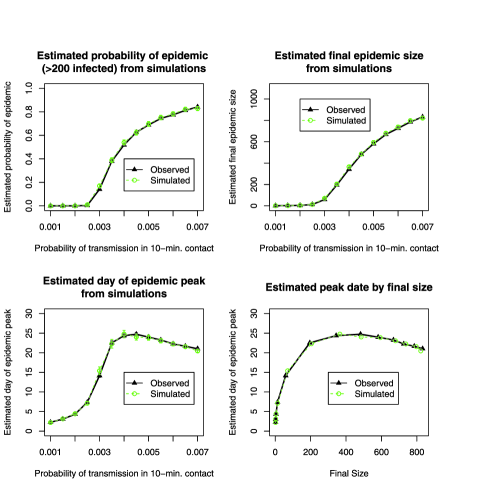
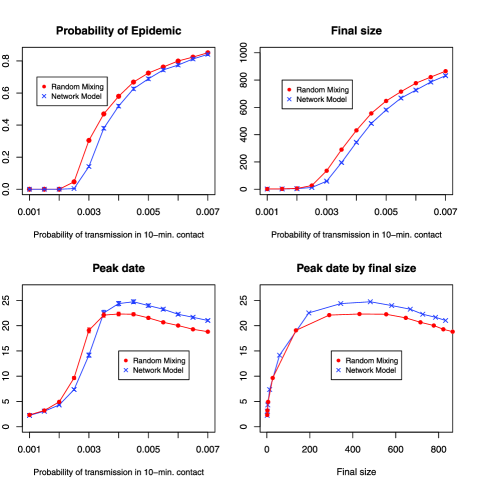
Figure 5 compares epidemic outcomes for simulations over the static contact network model to those from simulations performed over a random mixing scenario. The estimated probability of epidemic and final size are smaller in the contact network model than in a random mixing model. The repetition in contacts in our network model reduces the pool of susceptibles accessible to an infected person, who continues to contact people he/she has already infected. The transitivity present in friendship patterns further limits the potential for disease spread. Friends are likely to have mutual friends, so the set of susceptible friends of an infected person is reduced by transmission from other mutual friends. Figure 5 also shows the estimated peak date of the disease season: the day with the largest number of infected students. For probabilities of transmission under 0.0035, the epidemic peaks sooner under the network model; for higher probabilities of transmission, the epidemic peaks later. The threshold value occurs because the relationship between peak date and transmission probability is confounded by final size. The plot of peak date by final size shows that the network model peaks later for all final sizes than a random mixing model. The spread of the virus is slowed by the clustering and repetition in contacts in the network model.
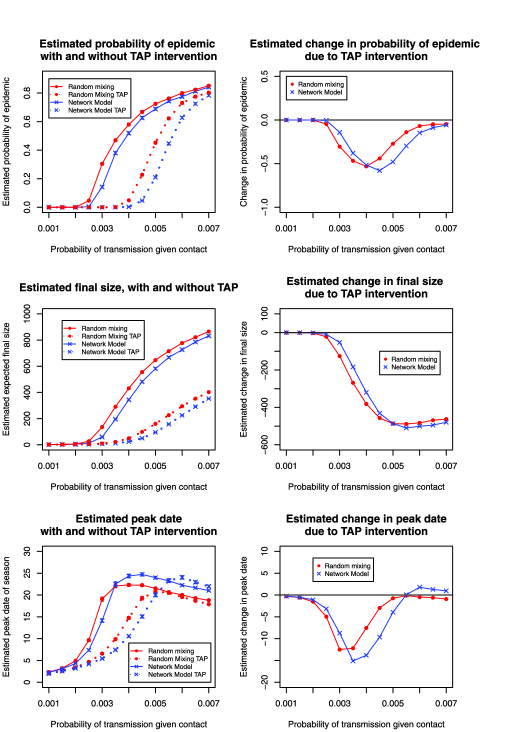
The top row of Figure 6 shows the estimated probability of an epidemic with targeted antiviral prophylaxis intervention under the network model and the random mixing model and the change in estimated probability of epidemic under both scenarios.These plots describe the estimated effectiveness of this intervention for containing the epidemic. Under both scenarios, the probability of epidemic is reduced to zero for transmission probabilities under 0.0035. If we were using either model for prediction, the right-hand plot would be the relevant one, and for this range of transmission probabilities, random mixing estimates a larger improvement than the network model. For example, when the transmission probability is 0.003, random mixing estimates a reduction of 0.30 in probability of epidemic, while the network model estimates this reduction to be 0.13. At transmission probabilities above 0.0035, the estimated probability of epidemic is higher under the random mixing model than the network model. This strategy is more effective under the network model because the people prioritized for prophylaxis are those who are repeatedly exposed through daily contact to infectious individuals. In the random mixing model, the contacts of an infectious person on one day are unrelated to his contacts on the following day, so the prioritization of antiviral to contacts has no effect.
The second row of Figure 6 shows a similar pattern with final size, but with a threshold value of 0.005 instead of 0.004. The third row shows substantial differences in peak date predictions between the two models. A delay in peak date helps the public health department develop a response to the epidemic. However, the epidemic peaks earlier with the intervention under both scenarios. This is because the relationship between peak date and transmission probability is confounded by final size; both interventions reduce the final size drastically, so the (much smaller) peak occurs sooner.
In simulating the TAP intervention, we distributed antiviral prophylaxis to all (100%) contacts of symptomatic students, thus assuming that symptomatic students would accurately recall and report 100% of the students they contacted on their first day of symptom onset. In reality, students may recall only a subset of the people they contacted on their first symptomatic day. To assess the impact of this assumption, we repeated the analyses assuming that students reported only 90% of contacts, and again assuming that they reported only 75% of contacts. These results are included in the supplementary material [Potter et al. (2011c)]. These different scenarios only slightly shifted the results, maintaining our qualitative and quantitative findings.
The first row of Figure 7 shows that under both models the grade closure strategy reduces the probability of epidemic to zero for all transmission probabilities. Since grade closure is expensive on a societal level, our model could be used to perform cost-effectiveness strategies, where the cost of grade closure is weighed against the severity of the influenza strain and its societal impact. The right-hand plot in the second row of Figure 7 shows that if we were willing to use grade closure once the reduction in probability of
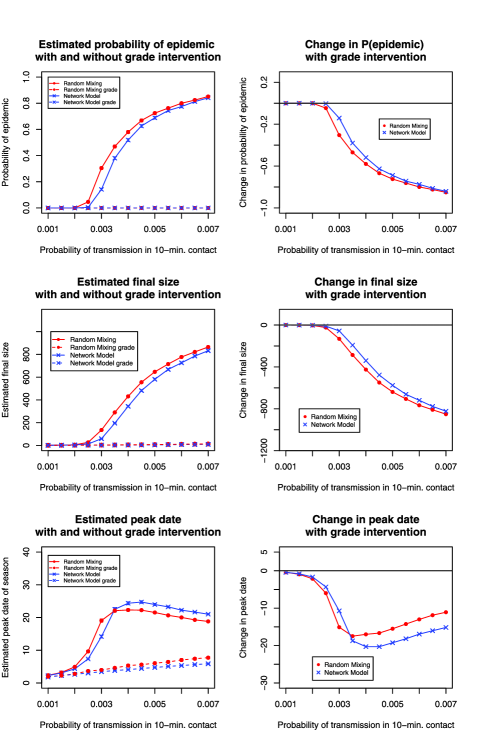
epidemic exceeded a threshold value (e.g., 0.20), the cutoff transmission probability would be different under the two models. The third row shows differences in peak date predictions under the grade closure strategy.
5 Discussion
Our work in this paper yields three broad findings. First, our realistic, data-driven contact network model produces substantially different estimates of epidemic outcomes and intervention effectiveness than a random mixing scenario, and the differences vary by transmission probability. Second, we found evidence that in a high school setting, a static contact model is sufficient to characterize epidemic progress. However, our dynamics in contact behavior occurred only during class breaks, so relied on the assumptions that within-classroom seating configurations are constant over time and that interaction occurs only with one’s immediate class neighbors within each class. We recommend collecting dynamic contact data and further investigating the hypothesis that dynamic networks and static networks produce similar epidemic predictions. Once dynamic, within-class contact reports are obtained, we can integrate this information into our model and test our hypothesis that a static contact network adequately represents the contact behavior relevant for epidemic predictions. Third, a dyad-independent ERGM adequately captures the friendship network structure relevant to the disease transmission process. The dyad-independent model is advantageous, as its parameters can be estimated with logistic regression instead of relying on MCMC. Another advantage of this model is that the probability of friendship depends only on individual-level attributes, so survey data on attributes of respondents and their friends is sufficient to characterize the network.
Our model stands out from other epidemic simulation models for three reasons. First, we infer the contact network using contact survey reports, while others are not informed by contact surveys. Second, we quantify uncertainty in predictions arising from uncertainty in estimates of inputs to our model; this is not standard in the field. Third, we validated our model by comparing the fitted degree distribution to reports in an alternate data source and by comparing joint and marginal distributions of variables of contact networks simulated from our model to those in one of our data sources, the epidemic survey.
Our work has several limitations. First, we have modeled contact and transmission patterns in a single high school. The friendship patterns in this high school may be different from those in other high schools, especially schools of different sizes and racial compositions. We hypothesize that in schools with different friendship structure, our key findings that a dyad-independent ERGM is sufficient and that a static contact model is adequate will still hold.
Another limitation of our work is that we have treated the Add Health friendship data as complete rather than attempting to model the unobserved friendship ties. Demographic information is unavailable for nonrespondent students, and differences in demographics between respondents and nonrespondents have not been studied. Gile and Handcock (2006) compared network characteristics of respondents to nonrespondents in a different Add Health school, and found slight differences, for example, that respondents received more friendship nominations than nonrespondents. We found this pattern to hold in our school as well: respondents received an average of 4.9 nominations while the mean for nonrespondents was 3.5. However, if nonrespondents are more likely to nominate other nonrespondents than respondents as best friends, then the true means are closer together. Our work could be extended by imputing demographics for nonrespondent students and maximizing the likelihood obtained by summing over all possible values for the missing edges [Handcock and Gile (2010)]. We consider our partially observed friendship network to be a realistic representation of a possible friendship network and believe that correcting for missing edges and attributes would only slightly impact our friendship network estimates and would not substantively impact our epidemic outcome estimates. Our main finding that a friendship-based contact model gives rise to different estimates of epidemic outcomes than a random mixing scenario is likely to hold with the complete friendship network.
Because Add Health respondents were limited to nomination of 5 friends of each sex, there is truncation bias in the numbers of friends in the friendship network. In this school, 86% of respondents reported fewer than 5 best male friends, 79% reported fewer than 5 best female friends and 95% reported fewer than 10 best friends, so truncation bias is relatively small. Students were instructed to list their friends in order of closeness, so friendships that were truncated are less close than the included ones. Moreover, by including nominators of each respondent as friends even if they were not themselves nominated by the respondent, we may have reduced the truncation bias. Because this definition of friendship creates a degree distribution similar to that collected in the epidemic survey, which had no truncation mechanism (see Figure 1), we expect any bias arising from the truncation in Add Health friendship reports to have minimal, if any, impact on our results.
Reports in the epidemic survey are subject to a potentially high degree of measurement error because students were asked to estimate their average contact behavior. We contrast this survey design to the POLYMOD study, in which respondents were mailed paper diaries and instructed to carry them throughout a 24-hour period and record characteristics of each contact they made [Mossong et al. (2008)]. We recommend a within-school POLYMOD type survey in which the students identify their contacts from a school roster. We could directly model the contact network from such a data set without inclusion of the friendship network information. We believe that our model is the most realistic possible with the available data, and the extent of measurement error is impossible to determine without further studies. Proximity sensor data would also be less prone to measurement error and can be used to characterize networks as in Stehlé et al. (2011a).
Another limitation of our model is that we did not incorporate data on classroom contacts but rather created a model based on assumptions about within-classroom contact behavior. A better understanding of classroom contacts could be obtained by the POLYMOD-type within-school survey described above, in which respondents include the time of day and whether the contact occurs within a class. Further limitations include our assumptions of perfect observation of symptoms and perfect reporting of contact behavior during the targeted antiviral prophylaxis strategy, but sensitivity analysis demonstrated the latter assumption to have little effect.
We have modeled within-school contacts only. In reality, friends and classmates also contact each other outside the school. We intend to expand our school model to include all contacts between students in the school occurring in all locations. The model we presented here is a natural first step in building the expanded model.
We have developed a detailed, data-driven model of within-school social contact behavior. We demonstrated that our network model predicts different epidemic progress and intervention effectiveness than random mixing, and we identified key network structures influencing the transmission process. We recommend further exploration into how network structures influence the disease transmission process with the aim of integrating network structure into epidemic models and simulators.
Acknowledgments
We thank the Editor and Associate Editor of this paper for their constructive comments and suggestions. We are very grateful to Martina Morris for sharing the restricted-use Add Health data set, as well as her feedback on this work. We are also grateful to Stephen Eubank, Henning Mortveit and Madhav Marathe for sharing the epidemic survey with us. We thank Steven Goodreau for sharing his code for the Add Health analysis and for his comments on our work, and we thank the University of Washington Social Network Modeling Group (Co-PIs: Martina Morris and Steven Goodreau) for their feedback on this work. We thank Niel Hens and the POLYMOD project for sharing the Belgian POLYMOD data. This research uses data from Add Health, a program project directed by Kathleen Mullan Harris and designed by J. Richard Udry, Peter S. Bearman and Kathleen Mullan Harris at the University of North Carolina at Chapel Hill, and funded by grant P01-HD31921 from the Eunice Kennedy Shriver National Institute of Child Health and Human Development, with cooperative funding from 23 other federal agencies and foundations. Special acknowledgment is due Ronald R. Rindfuss and Barbara Entwisle for assistance in the original design. Information on how to obtain the Add Health data files is available on the Add Health website (http://www.cpc.unc.edu/addhealth). No direct support was received from grant P01-HD31921 for this analysis.
Supplement A \stitleModel validation and descriptive analyses of simulated contact networks \slink[doi]10.1214/11-AOAS505SUPPA \slink[url]http://lib.stat.cmu.edu/aoas/505/supplementA.pdf \sdatatype.pdf \sdescriptionWe compare our fitted degree distribution to that from an alternate data source, the POLYMOD study. We compare marginal and joint distributions of variables from contact networks simulated from our model to the empirical marginal and joint distributions in the epidemic survey, which was used to estimate model input parameters.
Supplement B \stitleSensitivity analysis for targeted antiviral prophylaxis intervention \slink[doi]10.1214/11-AOAS505SUPPB \slink[url]http://lib.stat.cmu.edu/aoas/505/supplementB.pdf \sdatatype.pdf \sdescriptionWe perform sensitivity analysis to assess the impact of the assumption of perfect reporting of contacts in the targeted antiviral prophylaxis intervention. Simulations are performed with 90% and 75% of contacts reported.
References
- Baccam et al. (2006) {barticle}[pbm] \bauthor\bsnmBaccam, \bfnmPrasith\binitsP., \bauthor\bsnmBeauchemin, \bfnmCatherine\binitsC., \bauthor\bsnmMacken, \bfnmCatherine A.\binitsC. A., \bauthor\bsnmHayden, \bfnmFrederick G.\binitsF. G. and \bauthor\bsnmPerelson, \bfnmAlan S.\binitsA. S. (\byear2006). \btitleKinetics of influenza A virus infection in humans. \bjournalJ. Virol. \bvolume80 \bpages7590–7599. \biddoi=10.1128/JVI.01623-05, issn=0022-538X, pii=80/15/7590, pmcid=1563736, pmid=16840338 \bptokimsref \endbibitem
- Basta et al. (2009) {barticle}[pbm] \bauthor\bsnmBasta, \bfnmNicole E.\binitsN. E., \bauthor\bsnmChao, \bfnmDennis L.\binitsD. L., \bauthor\bsnmHalloran, \bfnmM. Elizabeth\binitsM. E., \bauthor\bsnmMatrajt, \bfnmLaura\binitsL. and \bauthor\bsnmLongini, \bfnmIra M.\binitsI. M., Jr. (\byear2009). \btitleStrategies for pandemic and seasonal influenza vaccination of schoolchildren in the United States. \bjournalAm. J. Epidemiol. \bvolume170 \bpages679–686. \biddoi=10.1093/aje/kwp237, issn=1476-6256, pii=kwp237, pmcid=2737588, pmid=19679750 \bptokimsref \endbibitem
- Cauchemez et al. (2009) {barticle}[pbm] \bauthor\bsnmCauchemez, \bfnmSimon\binitsS., \bauthor\bsnmDonnelly, \bfnmChristl A.\binitsC. A., \bauthor\bsnmReed, \bfnmCarrie\binitsC., \bauthor\bsnmGhani, \bfnmAzra C.\binitsA. C., \bauthor\bsnmFraser, \bfnmChristophe\binitsC., \bauthor\bsnmKent, \bfnmCharlotte K.\binitsC. K., \bauthor\bsnmFinelli, \bfnmLyn\binitsL. and \bauthor\bsnmFerguson, \bfnmNeil M.\binitsN. M. (\byear2009). \btitleHousehold transmission of 2009 pandemic influenza A (H1N1) virus in the United States. \bjournalN. Engl. J. Med. \bvolume361 \bpages2619–2627. \biddoi=10.1056/NEJMoa0905498, issn=1533-4406, pii=361/27/2619, pmid=20042753 \bptokimsref \endbibitem
- Chao, Halloran and Longini (2010) {barticle}[author] \bauthor\bsnmChao, \bfnmDennis L\binitsD. L., \bauthor\bsnmHalloran, \bfnmM. E.\binitsM. E. and \bauthor\bsnmLongini, \bfnmIra M.\binitsI. M., Jr. (\byear2010). \btitleSchool opening dates predict pandemic influenza A(H1N1) outbreaks in the United States. \bjournalJ. Infect. Diseases \bvolume202 \bpages877–880. \bptokimsref \endbibitem
- Conlan et al. (2011) {barticle}[author] \bauthor\bsnmConlan, \bfnmA. J. K.\binitsA. J. K., \bauthor\bsnmEames, \bfnmK. T. D.\binitsK. T. D., \bauthor\bsnmGage, \bfnmJ. A.\binitsJ. A., \bauthor\bparticlevon \bsnmKirchbach, \bfnmJ. C.\binitsJ. C., \bauthor\bsnmRoss, \bfnmJ. V.\binitsJ. V., \bauthor\bsnmSaenz, \bfnmR. A.\binitsR. A. and \bauthor\bsnmGog, \bfnmJ. R.\binitsJ. R. (\byear2011). \btitleMeasuring social networks in british primary schools through scientific engagement. \bjournalProceedings of the Royal Society B: Biological Sciences \bvolume278 \bpages1467–1475. \bptokimsref \endbibitem
- Duerr et al. (2007) {barticle}[author] \bauthor\bsnmDuerr, \bfnmH. P.\binitsH. P., \bauthor\bsnmSchwehm, \bfnmM.\binitsM., \bauthor\bsnmLeary, \bfnmC. C.\binitsC. C., \bauthor\bsnmDe Vlas, \bfnmS. J.\binitsS. J. and \bauthor\bsnmEichner, \bfnmM.\binitsM. (\byear2007). \btitleThe impact of contact structure on infectious disease control: Influenza and antiviral agents. \bjournalEpidemiology and Infection \bvolume135 \bpages1124–1132. \bptokimsref \endbibitem
- Eames (2008) {barticle}[author] \bauthor\bsnmEames, \bfnmK. T. D.\binitsK. T. D. (\byear2008). \btitleModelling disease spread through random and regular contacts in clustered populations. \bjournalTheoretical Population Biology \bvolume73 \bpages104–111. \bptokimsref \endbibitem
- Efron and Tibshirani (1993) {bbook}[mr] \bauthor\bsnmEfron, \bfnmBradley\binitsB. and \bauthor\bsnmTibshirani, \bfnmRobert J.\binitsR. J. (\byear1993). \btitleAn Introduction to the Bootstrap. \bseriesMonographs on Statistics and Applied Probability \bvolume57. \bpublisherChapman and Hall, \baddressNew York. \bidmr=1270903 \bptokimsref \endbibitem
- Elveback et al. (1976) {barticle}[author] \bauthor\bsnmElveback, \bfnmLila R\binitsL. R., \bauthor\bsnmFox, \bfnmJohn P.\binitsJ. P., \bauthor\bsnmAckerman, \bfnmEugene\binitsE., \bauthor\bsnmLangworthy, \bfnmAlice\binitsA., \bauthor\bsnmBoyd, \bfnmMary\binitsM. and \bauthor\bsnmGatewood, \bfnmLael\binitsL. (\byear1976). \btitleAn influenza simulation model for immunization studies. \bjournalAm. J. Epidemiol. \bvolume103 \bpages152–165. \bptokimsref \endbibitem
- Eubank et al. (2004) {barticle}[pbm] \bauthor\bsnmEubank, \bfnmStephen\binitsS., \bauthor\bsnmGuclu, \bfnmHasan\binitsH., \bauthor\bsnmKumar, \bfnmV S Anil\binitsV. S. A., \bauthor\bsnmMarathe, \bfnmMadhav V.\binitsM. V., \bauthor\bsnmSrinivasan, \bfnmAravind\binitsA., \bauthor\bsnmToroczkai, \bfnmZoltán\binitsZ. and \bauthor\bsnmWang, \bfnmNan\binitsN. (\byear2004). \btitleModelling disease outbreaks in realistic urban social networks. \bjournalNature \bvolume429 \bpages180–184. \biddoi=10.1038/nature02541, issn=1476-4687, pii=nature02541, pmid=15141212 \bptokimsref \endbibitem
- Ferguson et al. (2006) {barticle}[pbm] \bauthor\bsnmFerguson, \bfnmNeil M.\binitsN. M., \bauthor\bsnmCummings, \bfnmDerek A T\binitsD. A. T., \bauthor\bsnmFraser, \bfnmChristophe\binitsC., \bauthor\bsnmCajka, \bfnmJames C.\binitsJ. C., \bauthor\bsnmCooley, \bfnmPhilip C.\binitsP. C. and \bauthor\bsnmBurke, \bfnmDonald S.\binitsD. S. (\byear2006). \btitleStrategies for mitigating an influenza pandemic. \bjournalNature \bvolume442 \bpages448–452. \biddoi=10.1038/nature04795, issn=1476-4687, pii=nature04795, pmid=16642006 \bptokimsref \endbibitem
- Fruchterman and Reingold (1991) {barticle}[author] \bauthor\bsnmFruchterman, \bfnmT. M.\binitsT. M. and \bauthor\bsnmReingold, \bfnmE. M.\binitsE. M. (\byear1991). \btitleGraph drawing by force-directed placement. \bjournalSoftware, Practice and Experience \bvolume21 \bpages1129–1164. \bptokimsref \endbibitem
- Germann et al. (2006) {barticle}[author] \bauthor\bsnmGermann, \bfnmTimothy C.\binitsT. C., \bauthor\bsnmKadau, \bfnmKai\binitsK., \bauthor\bsnmLongini, \bfnmIra M.\binitsI. M., Jr. and \bauthor\bsnmMacken, \bfnmCatherine A.\binitsC. A. (\byear2006). \btitleMitigation strategies for pandemic influenza in the United States. \bjournalProc. Natl. Acad. Sci. USA \bvolume103 \bpages5935–5940. \bptokimsref \endbibitem
- Geyer and Thompson (1992) {barticle}[mr] \bauthor\bsnmGeyer, \bfnmCharles J.\binitsC. J. and \bauthor\bsnmThompson, \bfnmElizabeth A.\binitsE. A. (\byear1992). \btitleConstrained Monte Carlo maximum likelihood for dependent data. \bjournalJ. Roy. Statist. Soc. Ser. B \bvolume54 \bpages657–699. \bidissn=0035-9246, mr=1185217 \bptnotecheck related\bptokimsref \endbibitem
- Gile and Handcock (2006) {bmisc}[author] \bauthor\bsnmGile, \bfnmKrista J.\binitsK. J. and \bauthor\bsnmHandcock, \bfnmMark S.\binitsM. S. (\byear2006). \bhowpublishedModel-based assessment of the impact of missing data on inference for social networks. Center for Statistics in the Social Sciences, Univ. Washington. \bptokimsref \endbibitem
- Glass and Glass (2008) {barticle}[author] \bauthor\bsnmGlass, \bfnmLaura\binitsL. and \bauthor\bsnmGlass, \bfnmRobert\binitsR. (\byear2008). \btitleSocial contact networks for the spread of pandemic influenza in children and teenagers. \bjournalBMC Public Health \bvolume8 \bpages61. \bptokimsref \endbibitem
- Goodreau, Kitts and Morris (2009) {barticle}[author] \bauthor\bsnmGoodreau, \bfnmSteve M.\binitsS. M., \bauthor\bsnmKitts, \bfnmJames A.\binitsJ. A. and \bauthor\bsnmMorris, \bfnmMartina\binitsM. (\byear2009). \btitleBirds of a feather, or friend of a friend? Using exponential random graph models to investigate adolescent social networks. \bjournalDemography \bvolume46 \bpages103–125. \bptokimsref \endbibitem
- Halloran et al. (2007) {barticle}[pbm] \bauthor\bsnmHalloran, \bfnmM. Elizabeth\binitsM. E., \bauthor\bsnmHayden, \bfnmFrederick G.\binitsF. G., \bauthor\bsnmYang, \bfnmYang\binitsY., \bauthor\bsnmLongini, \bfnmI. M.\binitsI. M., Jr. and \bauthor\bsnmMonto, \bfnmArnold S.\binitsA. S. (\byear2007). \btitleAntiviral effects on influenza viral transmission and pathogenicity: Observations from household-based trials. \bjournalAm. J. Epidemiol. \bvolume165 \bpages212–221. \biddoi=10.1093/aje/kwj362, issn=0002-9262, pii=kwj362, pmid=17088311 \bptokimsref \endbibitem
- Halloran et al. (2008) {barticle}[author] \bauthor\bsnmHalloran, \bfnmM. Elizabeth\binitsM. E., \bauthor\bsnmFerguson, \bfnmNeil M.\binitsN. M., \bauthor\bsnmEubank, \bfnmStephen\binitsS., \bauthor\bsnmLongini, \bfnmIra M.\binitsI. M., Jr., \bauthor\bsnmCummings, \bfnmDerek A. T.\binitsD. A. T., \bauthor\bsnmLewis, \bfnmBryan\binitsB., \bauthor\bsnmXu, \bfnmShufu\binitsS., \bauthor\bsnmFraser, \bfnmChristopher\binitsC., \bauthor\bsnmVullikanti, \bfnmAnil\binitsA., \bauthor\bsnmGermann, \bfnmTimothy C.\binitsT. C., \bauthor\bsnmWagener, \bfnmDiane\binitsD., \bauthor\bsnmBeckman, \bfnmRichard\binitsR., \bauthor\bsnmKadau, \bfnmKai\binitsK., \bauthor\bsnmBarrett, \bfnmChris\binitsC., \bauthor\bsnmMacken, \bfnmCatherine A.\binitsC. A., \bauthor\bsnmBurke, \bfnmDonald S.\binitsD. S. and \bauthor\bsnmCooley, \bfnmPhilip\binitsP. (\byear2008). \btitleModeling targeted layered containment of an influenza pandemic in the United States. \bjournalProc. Natl. Acad. Sci. USA \bvolume105 \bpages4639–4644. \bptokimsref \endbibitem
- Handcock (2003) {bmisc}[author] \bauthor\bsnmHandcock, \bfnmMark S.\binitsM. S. (\byear2003). \bhowpublishedDegreenet: Models for skewed count distributions relevant to networks. Version 1.0-3. Seattle, WA. Available at http://statnetproject.org. \bptokimsref \endbibitem
- Handcock and Gile (2010) {barticle}[mr] \bauthor\bsnmHandcock, \bfnmMark S.\binitsM. S. and \bauthor\bsnmGile, \bfnmKrista J.\binitsK. J. (\byear2010). \btitleModeling social networks from sampled data. \bjournalAnn. Appl. Stat. \bvolume4 \bpages5–25. \biddoi=10.1214/08-AOAS221, issn=1932-6157, mr=2758082 \bptokimsref \endbibitem
- Harris (2009) {bmisc}[author] \bauthor\bsnmHarris, \bfnmKathleen Mullan\binitsK. M. (\byear2009). \bhowpublishedThe national longitudinal study of adolescent health (add health), waves I and II, 1994–1996; wave III, 2001–2002; wave IV, 2007–2009. [Machine-readable data file and documentation]. Carolina Population Center, Univ. North Carolina at Chapel Hill. \bptokimsref \endbibitem
- Harris et al. (2009) {bmisc}[author] \bauthor\bsnmHarris, \bfnmK. M.\binitsK. M., \bauthor\bsnmHalpern, \bfnmC. T.\binitsC. T., \bauthor\bsnmWhitsel, \bfnmE.\binitsE., \bauthor\bsnmHussey, \bfnmJ.\binitsJ., \bauthor\bsnmTabor, \bfnmJ.\binitsJ., \bauthor\bsnmEntzel, \bfnmP.\binitsP. and \bauthor\bsnmUdry., \bfnmJ. R.\binitsJ. R. (\byear2009). \bhowpublishedThe national longitudinal study of adolescent health: Research design. Available at http://www.cpc.unc.edu/projects/addhealth/design. \bptokimsref \endbibitem
- Hens et al. (2009a) {barticle}[pbm] \bauthor\bsnmHens, \bfnmNiel\binitsN., \bauthor\bsnmAyele, \bfnmGirma Minalu\binitsG. M., \bauthor\bsnmGoeyvaerts, \bfnmNele\binitsN., \bauthor\bsnmAerts, \bfnmMarc\binitsM., \bauthor\bsnmMossong, \bfnmJoel\binitsJ., \bauthor\bsnmEdmunds, \bfnmJohn W.\binitsJ. W. and \bauthor\bsnmBeutels, \bfnmPhilippe\binitsP. (\byear2009a). \btitleEstimating the impact of school closure on social mixing behaviour and the transmission of close contact infections in eight European countries. \bjournalBMC Infect. Dis. \bvolume9 \bpages187. \biddoi=10.1186/1471-2334-9-187, issn=1471-2334, pii=1471-2334-9-187, pmcid=2799408, pmid=19943919 \bptokimsref \endbibitem
- Hens et al. (2009b) {barticle}[pbm] \bauthor\bsnmHens, \bfnmNiel\binitsN., \bauthor\bsnmGoeyvaerts, \bfnmNele\binitsN., \bauthor\bsnmAerts, \bfnmMarc\binitsM., \bauthor\bsnmShkedy, \bfnmZiv\binitsZ., \bauthor\bsnmDamme, \bfnmPierre Van\binitsP. V. and \bauthor\bsnmBeutels, \bfnmPhilippe\binitsP. (\byear2009b). \btitleMining social mixing patterns for infectious disease models based on a two-day population survey in Belgium. \bjournalBMC Infect. Dis. \bvolume9 \bpages5. \biddoi=10.1186/1471-2334-9-5, issn=1471-2334, pii=1471-2334-9-5, pmcid=2656518, pmid=19154612 \bptokimsref \endbibitem
- Keeling and Eames (2005) {barticle}[pbm] \bauthor\bsnmKeeling, \bfnmMatt J.\binitsM. J. and \bauthor\bsnmEames, \bfnmKen T D\binitsK. T. D. (\byear2005). \btitleNetworks and epidemic models. \bjournalJ. R. Soc. Interface \bvolume2 \bpages295–307. \biddoi=10.1098/rsif.2005.0051, issn=1742-5689, pii=L2L04UAFY5F3HYFF, pmcid=1578276, pmid=16849187 \bptokimsref \endbibitem
- Loeb et al. (2010) {barticle}[author] \bauthor\bsnmLoeb, \bfnmMark\binitsM., \bauthor\bsnmRussell, \bfnmMargaret L.\binitsM. L., \bauthor\bsnmMoss, \bfnmLorraine\binitsL., \bauthor\bsnmFonseca, \bfnmKevin\binitsK., \bauthor\bsnmFox, \bfnmJulie\binitsJ., \bauthor\bsnmEarn, \bfnmDavid J. D.\binitsD. J. D., \bauthor\bsnmAoki, \bfnmFred\binitsF., \bauthor\bsnmHorsman, \bfnmGregory\binitsG., \bauthor\bsnmVan Caeseele, \bfnmPaul\binitsP., \bauthor\bsnmChokani, \bfnmKhami\binitsK., \bauthor\bsnmVooght, \bfnmMark\binitsM., \bauthor\bsnmBabiuk, \bfnmLorne\binitsL., \bauthor\bsnmWebby, \bfnmRichard\binitsR. and \bauthor\bsnmWalter, \bfnmStephen D.\binitsS. D. (\byear2010). \btitleEffect of influenza vaccination of children on infection rates in hutterite communities. \bjournalJ. Amer. Med. Assoc. \bvolume303 \bpages943–950. \bptokimsref \endbibitem
- Miller (2009) {barticle}[author] \bauthor\bsnmMiller, \bfnmJoel C.\binitsJ. C. (\byear2009). \btitleSpread of infectious disease through clustered populations. \bjournalJournal of the Royal Society Interface \bvolume6 \bpages1121–1134. \bptokimsref \endbibitem
- Mossong et al. (2008) {barticle}[author] \bauthor\bsnmMossong, \bfnmJöel\binitsJ., \bauthor\bsnmHens, \bfnmNiel\binitsN., \bauthor\bsnmJit, \bfnmMark\binitsM., \bauthor\bsnmBeutels, \bfnmPhilippe\binitsP., \bauthor\bsnmAuranen, \bfnmKari\binitsK., \bauthor\bsnmMikolajczyk, \bfnmRafael\binitsR., \bauthor\bsnmMassari, \bfnmMarco\binitsM., \bauthor\bsnmSalmaso, \bfnmStefania\binitsS., \bauthor\bsnmTomba, \bfnmGianpaolo Scalia\binitsG. S., \bauthor\bsnmWallinga, \bfnmJacco\binitsJ., \bauthor\bsnmHeijne, \bfnmJanneke\binitsJ., \bauthor\bsnmSadkowska-Todys, \bfnmMalgorzata\binitsM., \bauthor\bsnmRosinska, \bfnmMagdalena\binitsM. and \bauthor\bsnmEdmunds, \bfnmW. John\binitsW. J. (\byear2008). \btitleSocial contacts and mixing patterns relevant to the spread of infectious diseases. \bjournalPLoS Medicine \bvolume5 \bpages0381–0391. \bptokimsref \endbibitem
- Murphy et al. (1980) {barticle}[author] \bauthor\bsnmMurphy, \bfnmBrian R.\binitsB. R., \bauthor\bsnmRennels, \bfnmMargret B.\binitsM. B., \bauthor\bsnmDouglas, \bfnmR. Gordon\binitsR. G. Jr., \bauthor\bsnmBetts, \bfnmRobert F.\binitsR. F., \bauthor\bsnmCouch, \bfnmRobert B.\binitsR. B., \bauthor\bsnmCate, \bfnmThomas R.\binitsT. R. Jr., \bauthor\bsnmChanock, \bfnmRobert M.\binitsR. M., \bauthor\bsnmKendal, \bfnmAlan P.\binitsA. P., \bauthor\bsnmMaassab, \bfnmHunien F.\binitsH. F., \bauthor\bsnmSuwanagool, \bfnmSurapol\binitsS., \bauthor\bsnmSotman, \bfnmSteven B.\binitsS. B., \bauthor\bsnmCisneros, \bfnmLuis A.\binitsL. A., \bauthor\bsnmAnthony, \bfnmWilliam C.\binitsW. C., \bauthor\bsnmNalin, \bfnmDavid R.\binitsD. R. and \bauthor\bsnmLevine, \bfnmMyron M.\binitsM. M. (\byear1980). \btitleEvaluation of influenza A/Hong Kong/123/77 (H1N1) ts-1A2 and cold-adapted recombinant viruses in seronegative adult volunteers. \bjournalInfect. Immun. \bvolume29 \bpages348–355. \bptokimsref \endbibitem
- Potter et al. (2011a) {barticle}[author] \bauthor\bsnmPotter, \bfnmGail E.\binitsG. E., \bauthor\bsnmHandcock, \bfnmMark S.\binitsM. S., \bauthor\bsnmLongini, \bfnmIra M.\binitsI. M., Jr. and \bauthor\bsnmHalloran, \bfnmM. Elizabeth\binitsM. E. (\byear2011a). \btitleModeling within-household contact networks from egocentric data. \bjournalAnn. Appl. Statist. \bvolume5 \bpages1816–1838. \bptokimsref \endbibitem
- Potter et al. (2011b) {bmisc}[author] \bauthor\bsnmPotter, \bfnmG. E.\binitsG. E., \bauthor\bsnmHandcock, \bfnmM. H.\binitsM. H., \bauthor\bsnmLongini, \bfnmI. M.\binitsI. M., Jr. and \bauthor\bsnmHalloran, \bfnmM. E.\binitsM. E. (\byear2011b). \bhowpublishedSupplement A to “Estimating within-school contact networks to understand influenza transmission. DOI:10.1214/11-AOAS505SUPPA. \bptokimsref \endbibitem
- Potter et al. (2011c) {bmisc}[author] \bauthor\bsnmPotter, \bfnmG. E.\binitsG. E., \bauthor\bsnmHandcock, \bfnmM. H.\binitsM. H., \bauthor\bsnmLongini, \bfnmI. M.\binitsI. M., Jr. and \bauthor\bsnmHalloran, \bfnmM. E.\binitsM. E. (\byear2011c). \bhowpublishedSupplement B to “Estimating within-school contact networks to understand influenza transmission. DOI:10.1214/11-AOAS505SUPPB. \bptokimsref \endbibitem
- R Development Core Team (2008) {bmisc}[author] \borganizationR Development Core Team (\byear2008). \bhowpublishedR: A language and environment for statistical computing. \bptokimsref \endbibitem
- Read, Eames and Edmunds (2008) {barticle}[author] \bauthor\bsnmRead, \bfnmJonathan M\binitsJ. M., \bauthor\bsnmEames, \bfnmKen T. D\binitsK. T. D. and \bauthor\bsnmEdmunds, \bfnmW. John\binitsW. J. (\byear2008). \btitleDynamic social networks and the implications for the spread of infectious disease. \bjournalJournal of The Royal Society Interface \bvolume5 \bpages1001–1007. \bptokimsref \endbibitem
- Rodriguez et al. (2009) {barticle}[pbm] \bauthor\bsnmRodriguez, \bfnmCarla V.\binitsC. V., \bauthor\bsnmRietberg, \bfnmKrista\binitsK., \bauthor\bsnmBaer, \bfnmAtar\binitsA., \bauthor\bsnmKwan-Gett, \bfnmTao\binitsT. and \bauthor\bsnmDuchin, \bfnmJeffrey\binitsJ. (\byear2009). \btitleAssociation between school closure and subsequent absenteeism during a seasonal influenza epidemic. \bjournalEpidemiology \bvolume20 \bpages787–792. \biddoi=10.1097/EDE.0b013e3181b5f3ec, issn=1531-5487, pmid=19770773 \bptokimsref \endbibitem
- Salathé et al. (2010) {barticle}[auto:STB—2012/02/03—11:55:16] \bauthor\bsnmSalathé, \bfnmM.\binitsM., \bauthor\bsnmKazandjieva, \bfnmM.\binitsM., \bauthor\bsnmLee, \bfnmJ. W.\binitsJ. W., \bauthor\bsnmLevis, \bfnmP.\binitsP., \bauthor\bsnmFeldman, \bfnmM. W.\binitsM. W. and \bauthor\bsnmJones, \bfnmJ. H.\binitsJ. H. (\byear2010). \btitleA high-resolution human contact network for infectious disease transmission. \bjournalProc. Natl. Acad. Sci. USA \bvolume107 \bpages2202022025. \bptokimsref \endbibitem
- Smieszek, Fiebig and Scholz (2009) {barticle}[pbm] \bauthor\bsnmSmieszek, \bfnmTimo\binitsT., \bauthor\bsnmFiebig, \bfnmLena\binitsL. and \bauthor\bsnmScholz, \bfnmRoland W.\binitsR. W. (\byear2009). \btitleModels of epidemics: When contact repetition and clustering should be included. \bjournalTheor. Biol. Med. Model \bvolume6 \bpages11. \biddoi=10.1186/1742-4682-6-11, issn=1742-4682, pii=1742-4682-6-11, pmcid=2709892, pmid=19563624 \bptokimsref \endbibitem
- Stehlé et al. (2011a) {bmisc}[auto:STB—2012/02/03—11:55:16] \bauthor\bsnmStehlé, \bfnmJ.\binitsJ., \bauthor\bsnmVoirin, \bfnmN.\binitsN., \bauthor\bsnmBarrat, \bfnmA.\binitsA., \bauthor\bsnmCattuto, \bfnmC.\binitsC., \bauthor\bsnmIsella, \bfnmL.\binitsL., \bauthor\bsnmPinton, \bfnmJ. F.\binitsJ. F., \bauthor\bsnmQuaggiotto, \bfnmM.\binitsM., \bauthor\bparticleVan den \bsnmBroeck, \bfnmW.\binitsW., \bauthor\bsnmRgis, \bfnmC.\binitsC., \bauthor\bsnmLina, \bfnmB.\binitsB. and \bauthor\bsnmVanhems, \bfnmP.\binitsP. (\byear2011a). \bhowpublishedHigh-resolution measurements of face-to-face contact patterns in a primary school. PLoS ONE 6. \bptokimsref \endbibitem
- Stehlé et al. (2011b) {barticle}[auto:STB—2012/02/03—11:55:16] \bauthor\bsnmStehlé, \bfnmJ.\binitsJ., \bauthor\bsnmVoirin, \bfnmN.\binitsN., \bauthor\bsnmBarrat, \bfnmA.\binitsA., \bauthor\bsnmCattuto, \bfnmC.\binitsC., \bauthor\bsnmColizza, \bfnmV.\binitsV., \bauthor\bsnmIsella, \bfnmL.\binitsL., \bauthor\bsnmRegis, \bfnmC.\binitsC., \bauthor\bsnmPinton, \bfnmJ. F.\binitsJ. F., \bauthor\bsnmKhanafer, \bfnmN.\binitsN., \bauthor\bparticleVan den \bsnmBroeck, \bfnmW.\binitsW. and \bauthor\bsnmVanhems, \bfnmP.\binitsP. (\byear2011b). \btitleSimulation of an SEIR infectious disease model on the dynamic contact network of conference attendees. \bjournalBMC Medicine \bvolume9 \bpages87. \bptokimsref \endbibitem
- Venables and Ripley (2002) {bbook}[author] \bauthor\bsnmVenables, \bfnmW. N.\binitsW. N. and \bauthor\bsnmRipley, \bfnmB. D.\binitsB. D. (\byear2002). \btitleModern Applied Statistics with S, \bedition4th ed. \bpublisherSpringer, \baddressNew York. \bptokimsref \endbibitem
- Xia et al. (2010) {bmisc}[author] \bauthor\bsnmXia, \bfnmHuadong\binitsH., \bauthor\bsnmChen, \bfnmJiangzhuo\binitsJ., \bauthor\bsnmMarathe, \bfnmMadhav V.\binitsM. V. and \bauthor\bsnmMortveit, \bfnmHenning S.\binitsH. S. (\byear2010). \bhowpublishedSynthesis and embedding of subnetworks for individual-based epidemic models. NDSSL Technical Report 10-139, Univ. North Carolina at Chapel Hill. \bptokimsref \endbibitem