Electronic structure and transport anisotropy of Bi2Te3 and Sb2Te3
Abstract
On the basis of detailed ab initio studies the influence of strain on the anisotropy of the transport distribution of the thermoelectrics Bi2Te3 and Sb2Te3 was investigated. Both tellurides were studied in their own, as well as in their co-partners lattice structure to gain insight to the electrical transport in epitaxial heterostructures composed of both materials. It is shown, that the anisotropy of the transport distribution overestimates the experimental findings for Bi2Te3, implying anisotropic scattering effects. An increase of the in-plane lattice constant leads to an enhancement of the transport anisotropy for -doping, whereas the opposite occurs for -doping. The recent findings and special features of the transport distribution are discussed in detail in relation to the topology of the band structures.
pacs:
71.15.Mb, 71.15.Rf, 71.20.Nr, 72.20.PaI Introduction
Thermoelectric (TE) materials have huge potential for power generation, heat pumping, and refrigeration. However, their practical application is restricted because of the low performance of the TE devices compared to traditional fossil fuel power generators and compressor-based refrigerators DiSalvo . A high performance TE material has to be a good electrical conductor as well as a poor thermal conductor and, at the same time, possess a large Seebeck coefficientBell . Quantitatively the efficiency of TE devices is expressed by the dimensionless figure of merit ,
| (1) |
where , , are the Seebeck coefficient, electrical conductivity and absolute temperature, and , are phonon and electron contributions to the total thermal conductivity, respectively.
Bismuth and antimony tellurides, Bi2Te3, Sb2Te3, and the alloys based on these materials play a significant role for thermoelectric technology. Already early studies of the (Bix,Sb2-x)Te3 compounds in the late 1950s reported at room temperature exp_early , confirmed by further experiments exp_further . This value remains, even to date, the maximal one available at room temperature for bulk materials. Current progress in nanostructure fabrication, in particular, epitaxial growth of high-quality superlattices Rama1 , encourages the possibility of significant performance improvement of TE devices. Venkatasubramanian et al. reported and at 300K for -type and -type Bi2Te3/Sb2Te3 superlattices, respectivelyRama2 .
These experimental advances motivated extensive theoretical studies of the electronic structure of the bulk bismuth and antimony telluride aimed to understand the possible origin of the increased thermoelectic performance in the multilayered structures. While in the previous years only few ab initio band-structure calculations of the bulk bismuth telluride Thomas ; Mishra could be mentioned, in the last decade various aspects of the electronic structure of both pure and doped bulk Bi2Te3 and Sb2Te3 as well as their transport properties were discussed in Ref.[Larson1, ; Youn, ; Scheidemantel, ; Thonhauser1, ; Larson2, ; Thonhauser2, ; Kim, ; Larson3, ; Lee, ; Wang, ; Huang, ; Park, ; Eremeev, ]. Ab initio studies of the electronic structure and the transport properties of Bi2Te3/Sb2Te3 superlattices were also reportedLi .
An explanation of directional anisotropy of the transport properties in Bi2Te3/Sb2Te3 superlattices could play a crucial role for the understanding of their increased figure of merit. Venkatasubramanian et al.Rama2 found a strong dependence of the anisotropy of the carrier mobility on both the superlattice period and the relative thickness of the constituents. The enhancement of the electrical conductivity parallel to the epitaxial growth direction, i.e. the trigonal axis of the rhombohedral lattice of bismuth and antimony tellurides, together with the possibility to suppress the lattice thermal conductivity along this direction could provide the desirable ZT enhancement.
In this study we concentrate on the anisotropy of the transport properties in the bulk Bi2Te3 and Sb2Te3 as a first step on a way of understanding the corresponding properties of the Bi2Te3/Sb2Te3 superlattices. Since epitaxial growth always implies lattice distortions we included, as discussed below, the effect of the lattice relaxation in our study.
II Crystal structure
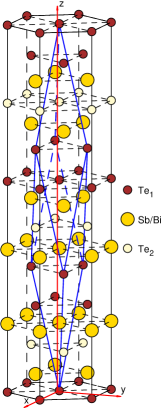
Both bismuth and antimony telluride possess the rhombohedral crystal structure with five atoms, i.e. one formula unit, per unit cell belonging to the space group (). Experimental lattice parametersSpringerData are Å, , and Å, , were is the angle between the rhombohedral basis vectors of the length . In order to emphasize the layered character of this structure it is convenient to rearrange it into the hexagonal unit cell built up by three formula units, as shown in Fig.1. The hexagonal cell contains 15 atoms grouped in the 3 ’quintuple’ layers, Te1-Bi(Sb)-Te2-Bi(Sb)-Te1, where Te1 and Te2 are two different crystal kinds of tellurium atoms. The ’hexagonal’ lattice parameters are Å, Å, and Å, Å, for Bi2Te3 and Sb2Te3, respectively. In bismuth telluride the nearest interatomic distances between the individual monolayers inside the ’quintuple’ blocks are 3.07Å for Te1-Bi and 3.25Å for Bi-Te2. Two adjacent ’quintuple’ layers in Bi2Te3 are separated by somewhat longer distance, 3.63Å for Te1-Te1. In the antimony telluride these distances are 2.98Å for Te1-Sb, 3.17Å for Sb-Te2 inside the ’quintuple’ blocks, and 3.74Å for Te1-Te1 between the blocks.
In the Bi2Te3/Sb2Te3 multilayers atoms change their bulk positions due to the mismatch of the lattice parameters. The description of the realistic crystal structure of the multilayers is out of the scope of this study. Nonetheless, we modeled Bi2Te3 with the experimental lattice parameters and interatomic distances of Sb2Te3, and vice versa. Since both materials have very similar lattice parameter along -axis this variation is essentially compression and extension of the lattice in () plane for bismuth and antimony telluride, respectively. We assume that one could estimate the effect of the lattice relaxation on the electronic and transport properties in the Bi2Te3/Sb2Te3 heterostructures from these two limiting cases.
III Calculational details
Calculations of the electronic structures were performed by means of the screened Korringa-Kohn-Rostoker Green’s function method KKR in the atomic sphere approximation (ASA) within the local density approximation of the density functional theory in the parameterization of Vosko et al.Vosko . It is generally recognized that the effects of spin-orbit coupling are mandatory for the correct treatment of the band structure in these materials. Therefore we used a fully relativistic version of the method based on the Dirac equationKKRrel . The obtained self-consistent band structures were used for the calculations of the transport distribution within the Boltzmann formalism assuming a constant relaxation time Ziman ,
| (2) |
where is the j-th band energy at the k-point of the Brillouin zone (BZ), and denote cartesian coordinates. We assume the relaxation time to be isotropic. In this approximation the transport anisotropy ratio is independent on the relaxation time, and we do not have to specify it.
The k-space integration over the isoenergetic surfaces was performed with the tetrahedron method on the Blöchl meshBloechl of 969696 points in the whole BZ. In the energy intervals of the width about 0.1 eV in the vicinity of both band edges the integration was refined by means of an adaptive mesh up to 444 times as dense as the original one. As a convergence criterium we used the values of the transport anisotropy ratio calculated from the effective mass approximation at the band extrema Peter .
IV Electronic structures and transport properties
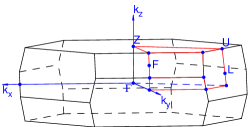
The electronic band structures for Bi2Te3 and Sb2Te3 for both experimental and strained lattices are shown in Fig.2. The positions of the high-symmetry points in the BZ of the rhombohedral structure are denoted in Fig.3. Our results at the experimental lattice parameters agree well with the previous ab initio studies of Mishra et al.Mishra , Larson et al.Larson1 for Bi2Te3, and of Eremeev et al. Eremeev both for Bi2Te3 and Sb2Te3. At the same time the calculations made with the full-potential linearized augmented plane wave method (FLAPW) result in slightly different band structures for the bismuth and antimony tellurides at both the experimentalYoun ; Scheidemantel ; Thonhauser1 ; Larson2 ; Huang and strained Park ; Wang lattices.
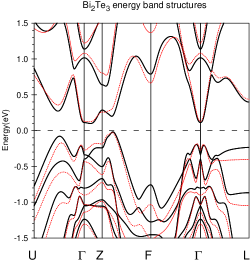
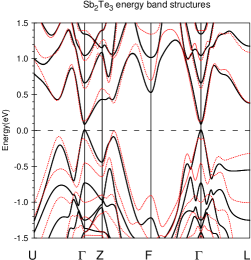
The key question of the band structure of Bi2Te3 and Sb2Te3 is the position of the valence band maximum (VBM) and conduction band minimum (CBM) in the BZ. The calculations of Ref.[Youn, ; Scheidemantel, ; Thonhauser1, ; Larson2, ; Huang, ] result in a six-valley both VBM and CBM located in the symmetry plane (ZU) in agreement with experiments for both the bismuthbite6v and antimonysbte6v tellurides. Unlike these results, in our case the CBM of Bi2Te3, at both lattice parameters, and , is a two-valley minimum located on the symmetry line Z, similarly to Ref.[Mishra, ]. For Sb2Te3 at the experimental lattice parameters we found a direct band gap located at the center of the BZ, while at the larger in-plane lattice constant both six-valley VBM and CBM lie in the symmetry plane (ZU). In contrast to our results ThonhauserThonhauser2 found that the increase of the lattice parameters in Sb2Te3 led to the formation of a direct band gap at the point. On the other hand, the negative hydrostatic pressure discussed in Ref.[Thonhauser2, ] implies an increase of both in-plane and out-of-plane lattice parameters in comparable degree, while in our study essentially the first one is included. Additionally, calculations in Ref.[Thonhauser2, ] were performed for optimized atomic positions with respect to the total energy, which can affect the band structure of antimony tellurideWang .
As already discussed Mishra ; Youn , these differences in the band structures are probably due to the non-spherical part of the potential, which is not included in the ASA. At the same time, as discussed below, these differences have no significant impact on the transport distribution . The details of the band structures for all four systems are compiled in Table I.
| Bi2Te3 | ||||
|---|---|---|---|---|
| Lattice parameters | ||||
| Gap(eV) | 0.105 | 0.129 | ||
| Extremum | VBM | CBM | VBM | CBM |
| Position | 0.517 0.366 0.366 | 0.173 0.173 0.173 | 0.405 0.405 0.335 | 0.151 0.151 0.151 |
| Effective masses | ||||
| -0.024 | 0.178 | -0.039 | 0.154 | |
| -0.134 | 0.178 | -0.077 | 0.154 | |
| -1.921 | 0.835 | -0.207 | 1.370 | |
| Principal axes | ||||
| e1 | 0.500 -0.867 0.000 | 1.000 0.000 0.000 | 0.866 0.499 -0.024 | 1.000 0.000 0.000 |
| e2 | 0.600 0.346 0.721 | 0.000 1.000 0.000 | 0.500 -0.867 0.000 | 0.000 1.000 0.000 |
| e3 | 0.625 0.361 -0.693 | 0.000 0.000 1.000 | 0.021 0.012 0.999 | 0.000 0.000 1.000 |
| 5.452 | 4.700 | 4.020 | 9.013 | |
| Sb2Te3 | ||||
| Latt. param. | ||||
| Gap(eV) | 0.090 | 0.140 | ||
| Extremum | VBM | CBM | VBM | CBM |
| Position | 0.000 0.000 0.000 | 0.000 0.000 0.000 | 0.547 0.392 0.392 | 0.004 0.020 0.020 |
| Effective masses | ||||
| -0.054 | 0.045 | -0.039 | 1.124 | |
| -0.054 | 0.045 | -0.083 | 1.774 | |
| -0.102 | 0.114 | -2.046 | 6.861 | |
| Principal axes | ||||
| e1 | 1.000 0.000 0.000 | 1.000 0.000 0.000 | 0.500 -0.867 0.000 | -0.316 -0.183 0.931 |
| e2 | 0.000 1.000 0.000 | 0.000 1.000 0.000 | 0.594 0.343 0.727 | 0.500 -0.867 0.000 |
| e3 | 0.000 0.000 1.000 | 0.000 0.000 1.000 | 0.630 0.363 -0.686 | 0.806 0.465 0.365 |
| 1.889 | 2.507 | 2.397 | 2.080 | |
The calculated transport distribution of Bi2Te3 at both the experimental, , and compressed, , lattice parameters are shown in Fig.4 together with the anisotropy ratio . In terms of the rigid band model the energies below and above the band gap simulate - and -doping respectively. While for -doping close the VBM varies smoothly approaching the limiting value, the ratio increases drastically and forms a prominent two-peak structure for -doping case.
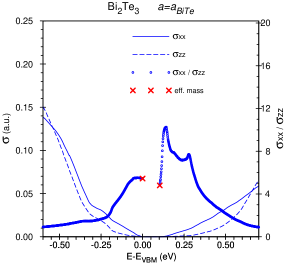
This structure originates from the two topological transformations of the constant energy surfaces in the conduction band. Fig.5(a) shows the contour plot of for Bi2Te3 at in the plane (ZU) for energies 0 to 0.19eV relative to the conduction band edge. The main features of the band structure are the global CBM on the line Z, the local conduction band minimum (LCBM) at (0.666,0.602,0.602), and two saddle points at (0.722 ,0.667, 0.667) and at (0.493,0.461,0.461), in crystallographic coordinates. The saddle point occurs at eV and causes the first peak of , while appears at 0.17eV and forms the second peak. At room temperature the chemical potential would be located in the saddle point or , for an electron carrier concentration of about or , respectively.
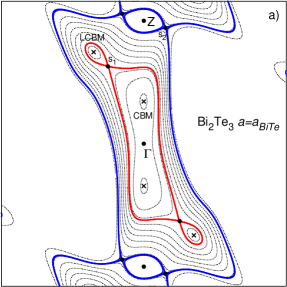
(a) Bi2Te3, 10 isolines for () at 0 to 0.19eV with a constant increment(dotted), additionally, 2 isolines at eV and eV with the saddle points and , respectively (bold), the positions of the CBM and the LCBM are marked with crosses.
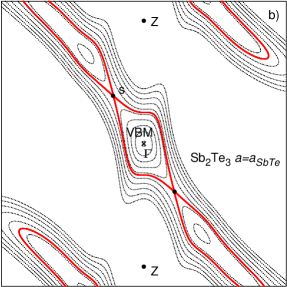
(b) Sb2Te3, 10 isolines for () at -0.24 eV to 0 with a constant increment (dotted), additionally, 1 isoline with the saddle point (bold), the position of the VBM is marked with a cross.
The location of the LCBM in our band structure calculation is close to the position of the six-valley CBM reported in Ref.[Youn, ; Scheidemantel, ; Thonhauser1, ; Larson2, ; Huang, ; Wang, ], and the energy difference between these two minima,=0.04eV, is quite small. At the same time the saddle point close to the local band maximum at Z was found as well in agreement with these calculations. A slight shift of the energies at the CBM and the LCBM would bring these two band structures in accordance. Since the saddle point lies close to the line connecting the CBM and the LCBM this modification would not affect remarkably the band structure topology. Moreover, the transport anisotropy at the LCBM from the effective mass approximation is 4.95, which is fairly close to 4.7 at the CBM. This indicates that the transport anisotropy of the bismuth telluride at the experimental lattice parameters is stable with respect to small modifications of the band structures with a two- and six-valley CBM, respectively.
In Bi2Te3 the in-plane compression of the lattice parameters from to increases the transport anisotropy ratio at the conduction band edge remarkably. Within the effective mass approximation this can be explained by the enhancement of the ratio due to the expansion of the BZ in plane. At the same time decreases at the valence band edge. In this case the compression of the lattice results in a re-orientation of the longest axis of the effective mass ellipsoid near the VBM closer to the axis, which lead to an increase of the transport anisotropy ratio, and at the same time decreases the anisotropy of the dominating effective masses and (see Table I). The last effect prevail over the enhancement of due to the rotation of the effective mass ellipsoid.
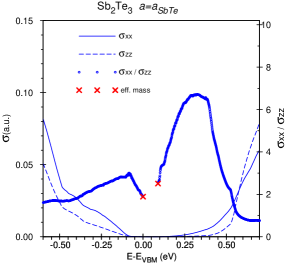
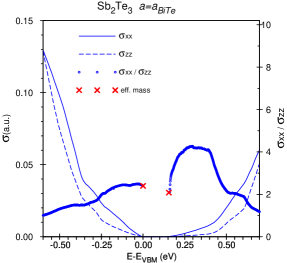
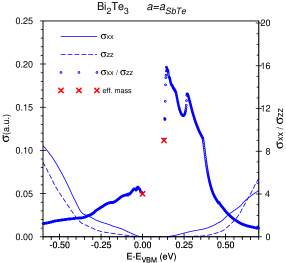
Fig.6 shows the transport distribution and the anisotropy ratio of Sb2Te3 at both and . The kink of the anisotropy ratio at the experimental lattice parameters is induced by the saddle point (0.831, 0.784, 0.784) at eV, which corresponds to a hole carrier concentration of at 300K. This topology is illustrated in Fig.5(b), which shows the contour plot of in the valence band of the antimony telluride for energies -0.24 eV to 0 relative to . The in-plane expansion of the lattice parameter increases the density of the occupied states near the valence band edge and suppresses the kink. The transport anisotropy ratio increases with the in-plane compression of the BZ at the valence band edge, and, at the same time, decreases at the conduction band edge due to the larger angle between the axis and the largest axis of the effective mass ellipsoid, similarly to the discussed changes in bismuth telluride.
V Conclusions
On the basis of ab initio electronic structures obtained with the fully relativistic KKR method we studied the anisotropy of the transport properties of the bismuth and antimony tellurides in the constant relaxation time approximation within the Boltzmann formalism. In addition to the systems with the experimental lattice parameters we modeled bismuth telluride within the lattice of Sb2Te3, and vice versa. We found that a decrease of the in-plane lattice parameters increases the transport anisotropy for the -doping and, at the same time, decreases the anisotropy for the -doped case. This effect can be understood within the effective mass approximation at the valence band maximum and conduction band minimum, respectively.
References
-
(1)
Corresponding author.
Email address: bogdan.yavorsky@physik.uni-halle.de - (2) F. J. DiSalvo, Science 285, 703 (1999)
- (3) L. E. Bell, Science 321, 1457 (2008)
-
(4)
C. B. Satterthwaite and R. W. Ure, Phys. Rev. 108, 1164 (1957),
F. D. Rosi, B. Abeles, and R. S. Jensen, J. Phys. Chem. Solids 10, 191 (1959) -
(5)
J. P. Fleurial, L. Gailliard, R. Triboulet, H. Scherrer, and S. Scherrer,
J. Phys. Chem. Solids 49, 1237 (1988),
T. Caillat, M. Carle, P. Pierrat, H. Scherrer, and S. Scherrer, J. Phys. Chem. Solids 53, 1121 (1992) - (6) R. Venkatasubramanian, T. Colpitts, B. O’Quinn, S. Liu, , N. El-Masry, and M. Lamvik, Appl.Phys.Lett. 75, 1104 (1999)
- (7) R. Venkatasubramanian, E. Siilova, T. Colpitts, and B. O’Quinn, Nature 413, 597 (2001)
- (8) G. A. Thomas, D. H. Rapkine, R. B. Van Dover, L. F. Mettheiss, W. A. Sunder, L. F. Schneemeyer, and J. V. Waszczak, Phys. Rev. B 46, 1553 (1992)
- (9) S. K. Mishra, S. Satpathy, and O. Jepsen, J.Phys.: Condens. Matter 9, 461 (1997)
- (10) P. Larson, S. D. Mahanti, and M. G. Kanatzidis, Phys. Rev. B 61, 8162 (2000)
- (11) S. J. Youn and A. J. Freeman, Phys. Rev. B 63, 085112 (2001)
- (12) T. J. Scheidemantel, C. Ambrosch-Draxl, T. Thonhauser, J. V. Badding, and J. O. Sofo, Phys. Rev. B 68,125210 (2003)
- (13) T. Thonhauser, T. J. Scheidemantel, J. O. Sofo, J. V. Badding, and G. D. Mahan, Phys. Rev. B 68,085201 (2003)
- (14) P. Larson, Phys. Rev. B 68, 155121 (2003)
- (15) T. Thonhauser, Solid State Commun. 129, 249 (2004)
- (16) M. Kim, A. J. Freeman, and C. B. Geller, Phys. Rev. B 72, 035205 (2005)
- (17) P. Larson, Phys. Rev. B 74, 205113 (2006)
- (18) S. Lee, and P. von Allmenn, Appl. Phys. Lett. 88, 022107 (2006)
- (19) G. Wang and T. Cagin, Phys. Rev. B 76, 075201 (2007)
- (20) B.-L. Huang, and M. Kaviany, Phys. Rev. B 77, 125209 (2008)
- (21) M. S. Park, J.-H. Song, J. E. Medvedeva, M. Kim, I. G. Kim, and A. J, Freeman, Phys. Rev. B 81, 155211 (2010)
- (22) S. V. Eremeev, Yu. M. Koroteev, and E. V. Chulkov, JETP Letters 91, 387 (2010)
- (23) H. Li, D. Bilc, and S. D. Mahanti, Mat. Res. Soc. Symp. Proc. 793, 8.37 (2004)
-
(24)
O. Madelung, M. Schulz, H. Weiss (Eds.) Landolt-Börnstein, New Series,
Group III, vol. 17f, (Springer, New York, 1983)
R. W. G. Wyckoff , Crystal Structures 2, J. (Wiley and Sons, New York, 1964)
Th. L. Anderson , H. Krause, H. Brigitte: Acta Crystallogr. B 30, 1307 (1974) -
(25)
R. Zeller, P. H. Dederichs, B. Újfalussy, L. Szunyogh, and. P. Weinberger,
Phys. Rev. B 52, 8807 (1995)
N. Papanikolau, R. Zeller, and P. H. Dederichs, J. Phys.: Condens. Matter 14, 2799 (2002) - (26) S. H. Vosko, L. Wilk, and M. Nusair, Can. J. Phys. 58, 1200 (1980)
- (27) M. Gradhand, M. Czerner, D. V. Fedorov, P. Zahn, B. Yu. Yavorsky, L. Szunyogh, and I. Mertig, Phys. Rev. B 80, 224413 (2009)
- (28) J. M. Ziman, Principles of the Theory of Solids (Cambridge University Press, Cambridge, 1972).
- (29) P. Zahn, N. F. Hinsche, B. Yu. Yavorsky, and I. Mertig, to be published (2011)
-
(30)
J. R. Drabble, R. D. Groves, and R. Wolfe, Proc. Phys. Soc. London 71, 430 (1958)
R. B. Mallinson, J. A. Rayne, and R. W. Ure, Jr., Phys. Lett 19, 545 (1965) -
(31)
H. Schwarz, G. Björck, and O. Beckman , Soli. State Commun. 5, 905 (1967)
V. A. Kulbachinskii, Z. M. Dashevskii, M. Inoue, M. Sasaki, H. Negishi, W. X. Gao, P. Lostak, J. Horak, and A. de Visser, Phys. Rev. B 52, 10915 (1995) - (32) P. E. Blöchl, O. Jepsen, and O. K. Andersen, Phys. Rev. B 49, 16223 (1994)