The Connection Between X-ray Binaries and Star Clusters in NGC 4449
Abstract
We present 23 candidate X-ray binaries with luminosities down to erg s-1, in the nearby starburst galaxy NGC 4449, from observations totaling 105 ksec taken with the ACIS-S instrument on the Chandra Space Telescope. We determine count rates, luminosities, and colors for each source, and perform spectral fits for sources with sufficient counts. We also compile a new catalog of 129 compact star clusters in NGC 4449 from high resolution, multi-band optical images taken with the Hubble Space Telescope, doubling the number of clusters known in this galaxy. The , luminosities of each cluster are compared with predictions from stellar evolution models to estimate their ages and masses. We find strong evidence for a population of very young massive, black-hole binaries, which comprise nearly 50% of the detected X-ray binaries in NGC 4449. Approximately a third of these remain within their parent star clusters, which formed Myr ago, while others have likely been ejected from their parent clusters. We also find evidence for a population of somewhat older X-ray binaries, including both supergiant and Be-binaries, which appear to be associated with somewhat older Myr star clusters, and one X-ray binary in an ancient ( Gyr) globular cluster. Our results suggest that detailed information on star clusters can significantly improve constraints on X-ray binary populations in star-forming galaxies.
Subject headings:
galaxies: individual (NGC 4449) — galaxies: star clusters — binaries: close — stars: evolution — X-rays1. Introduction
Images of nearby starburst galaxies taken in X-rays with the Chandra Space Telescope are spectacular, showing a multitude of bright point sources. It is now generally accepted that most of these sources are high mass X-ray binaries (HMXBs) produced during recent star formation. HMXBs are binaries where one member of the system is a compact object, either a black hole or neutron star, and the other is a young, massive star. X-ray emission is produced as material is accreted from the young “donor” star onto the compact object. HMXBs can be divided into two general categories based on the type of donor star: 1) a Be star (Be/X-ray binary), or 2) a supergiant star (SG/X-ray binary).
Previous studies have suggested an intriguing connection between HMXBs and young stellar clusters: many of the former are found close to, but not coincident with, young star clusters. These observations are broadly consistent with a scenario where X-ray binaries (XRBs) form in star clusters, but have sufficiently large velocities that they are expelled from their parent cluster (Zezas et al. (2002), Kaaret et al. (2004)). There are three mechanisms that might displace HMXBs from their birthsites. The binary could be given a “kick” during an asymmetric supernova explosion that forms the black hole or neutron star, or it could be ejected via dynamical interactions with other stars in a dense cluster core (McSwain et al., 2007). A third scenario that could explain the observed spatial displacement between HMXBs and young star clusters is that X-ray binaries formed in clusters that have since dispersed.
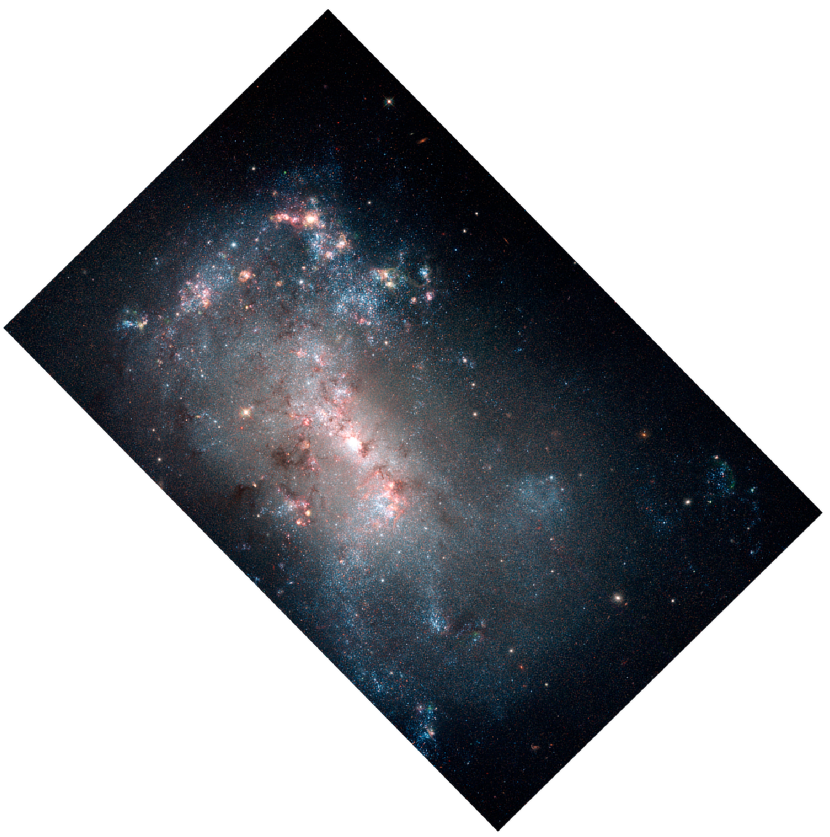
In this paper, we investigate the relationship between HMXBs and star clusters using the best X-ray and optical observations currently available for the starburst galaxy NGC 4449. We analyse observations taken with the Chandra Space Telescope to select X-ray binaries in NGC 4449, and optical images taken with the Hubble Space Telescope () to detect star clusters and to estimate their ages and masses. An optical color image of NGC 4449 based on the images is shown in Figure 1. Our primary goals are to constrain the nature of X-ray binaries and in particular HMXBs, and to explore the relationship between HMXBs and star clusters in NGC 4449.
The rest of this paper is organized as follows. In Section 2 we present the X-ray observations from Chandra, including data reduction, source detection and some basic models used for interpretation. In Section 3 we present the optical observations from the and a new catalog of compact star clusters, including their integrated colors and luminosities, and we derive their masses and ages. The mass and age distributions of the clusters and what they tell us about the formation and disruption of the clusters are the subject of Section 4, while Section 5 presents the spatial correlation between the clusters and the candidate HMXBs. Section 6 synthesizes these results to constrain the nature of the HMXBs in NGC 4449, and Section 7 summarizes the main results of this work.
2. X-ray Observations from Chandra
NGC 4449 is an irregular, star-forming galaxy located at a distance of Mpc (Annibali et al., 2008). With an integrated magnitude of it is somewhat more lumninous than the Large Magellanic Cloud (Hunter, 1997). NGC 4449 has a current star formation rate of yr-1 (Thronson et al., 1987) and a near-solar present-day gas abundance (; Grevesse & Sauval (1998)).
2.1. Data and Reduction
We use three sets of archival observations of NGC 4449, with integration times of 30 ksec (ObsID: 2031, PI: Heckman), 15 ksec (ObsID: 10125. PI: Long), and 60 ksec (ObsID: 10875, PI: Long), to detect X-ray point sources in NGC 4449. Basic information for the three sets of observations is given in Table 1. The data were taken with the Advanced CCD Imaging Spectrometer (ACIS) instrument on the Chandra telescope on February 4, 2001 in “faint” mode (ObsID: 2031), and March 4 and 7, 2010 in “vfaint” mode (ObsIDs: 10125 and 10875). The galaxy was positioned on the back-illuminated S3 CCD chip. We processed the data using the Chandra Interactive Analysis of Observations (CIAO) software (version 4.2) and Chandra Calibration Data Base (CALDB) version 4.3.0111http://cxc.harvard.edu/ciao/, and restricted the data to the energy range between 0.3-8 keV. The observations were filtered in three energy bands – 0.3-1 keV (soft), 1-2 keV (medium) and 2-8 keV (hard).
2.2. Source Detection and X-ray Properties
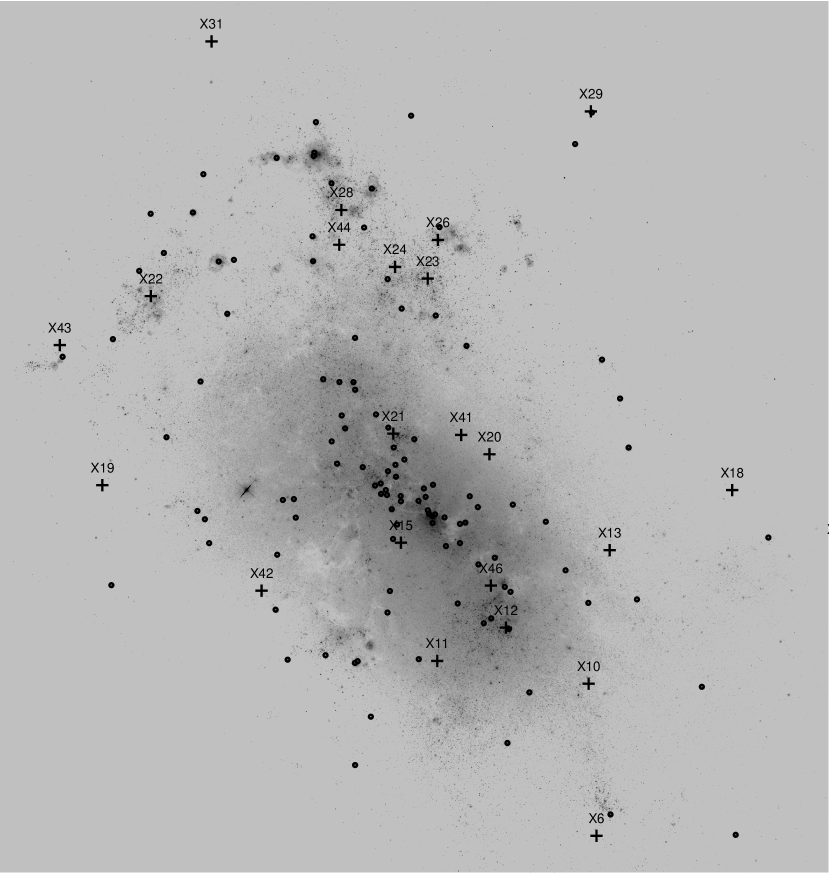
We use CIAO’s Mexican-hat wavelet source detection routine wavdetect (Freeman et al., 2002) to create source lists. Wavelet scales of 1.4, 2, 4, 8, and 16 pixels and a detection threshold of 10-6 were used, which typically results in 1 spurious detection per million pixels. The output sources were examined visually to verify each detection, and to correct the source catalog when multiple detections occurred. A catalog of X-ray point sources detected in the Chandra observations is presented in Table 2, and the locations of these sources are shown in Figure 2.
A number of measurements and estimates are made for each source total number of counts and the counts measured in the soft, medium, and hard energy bands. We calculate two X-ray colors, a “soft” color defined as , and a “hard” color defined as , where , and are the total counts measured in the soft, medium and hard bands (Prestwich et al., 2003), and is the total number of counts in all three bands. The luminosity of each source is estimated by fitting its spectrum with a power law model with a photon index 1.5. These values are compiled in Table 2.
| ObsId | Date | PI | Exposure |
|---|---|---|---|
| (ks) | |||
| 2031 | 2001-02-04 | Heckman | 30 |
| 10125 | 2009-03-04 | Long | 15 |
| 10875 | 2009-03-07 | Long | 60 |
There are eleven sources which have sufficient counts ( 50) for a crude spectral fit. We were able to fit ten of these with simple X-ray spectral models, as summarized in Table 3. One source, X15, is in a region with high background from diffuse emission and we were unable to obtain a satisfactory fit. X-ray spectra and responses (including sensitivity of the instrument and CCD) were extracted using standard CIAO software. Spectra were grouped for a minimum of 15 counts per bin. The fits were performed using XSPEC V 12.0 over an energy range 0.28.0 keV. For each source, we tried three models: a simple power law (PL), a MEKAL model222An emission spectrum from hot diffuse gas, e.g. Liedahl et al. (1995), and a multi-color disk (MCD333A superposition of multi-temperature blackbody spectra expected from optically-thick accretion disk; the model only constrains the temperature of the inner disk , e.g. Mitsuda et al. (1984)) model. A fixed foreground Galactic column cm-2 was assumed in each fit. The fits allow for an additional variable column due to absorption intrinsic to the source. The best fit model and parameters for each source are given in Table 3. Observed X-ray fluxes and estimated luminosities were calculated for the 0.3 8 keV energy range (both uncorrected for absorption) using the best fit parameters in the table.
| ID | RA | DEC | Soft | Hard | LX11X-ray luminosities (0.3 8 keV range) are derived by fitting a power law ( = 1.5) to the data. An assumed Galactic cm-2 is applied. |
|---|---|---|---|---|---|
| Color | Color | (erg s-1) | |||
| X8 | 187.00308 | 44.07569 | 0.20 | 0.00 | 4.55E+36 |
| X14 | 187.00572 | 44.09145 | 0.15 | -0.50 | 9.41E+36 |
| X18 | 187.01634 | 44.09551 | 0.01 | -0.09 | 7.68E+37 |
| X13 | 187.02855 | 44.09120 | 0.31 | -0.42 | 9.21E+36 |
| X6 | 187.02988 | 44.07074 | 0.34 | 0.14 | 1.47E+37 |
| X29 | 187.03043 | 44.12264 | 0.04 | -0.07 | 3.34E+37 |
| X10 | 187.03065 | 44.08164 | -0.33 | -0.16 | 5.67E+37 |
| X12 | 187.03891 | 44.08566 | -0.06 | -0.32 | 3.01E+38 |
| X20 | 187.04055 | 44.09808 | 0.23 | -0.13 | 1.01E+38 |
| X11 | 187.04576 | 44.08327 | 0.34 | -0.26 | 3.05E+36 |
| X23 | 187.04671 | 44.11066 | -0.24 | -0.26 | 2.25E+37 |
| X15 | 187.04985 | 44.09188 | -0.44 | -0.04 | 7.66E+37 |
| X24 | 187.04997 | 44.11149 | 0.02 | -0.29 | 5.81E+37 |
| X21 | 187.05013 | 44.09955 | -0.28 | -0.25 | 1.19E+37 |
| X28 | 187.05533 | 44.11557 | -0.01 | -0.32 | 6.93E+37 |
| X31 | 187.06829 | 44.12765 | -0.08 | 0.41 | 9.53E+36 |
| X22 | 187.07433 | 44.10939 | 0.41 | -0.13 | 8.59E+38 |
| X19 | 187.07917 | 44.09585 | -0.90 | -0.02 | 2.01E+37 |
| X41 | 187.04336 | 44.09946 | -1.00 | 0.00 | 1.43E+37 |
| X42 | 187.06327 | 44.08829 | -0.41 | -0.57 | 1.78E+36 |
| X43 | 187.08341 | 44.10589 | 0.41 | 0.09 | 3.36E+36 |
| X44 | 187.05553 | 44.11308 | 0.13 | 0.09 | 1.13E+36 |
| X46 | 187.04041 | 44.08867 | -0.20 | -0.23 | 7.59E+36 |
| X2622Supernova remnant. | 187.04569 | 44.11343 | 0.11 | -0.35 | 2.57E+38 |
| ID | Net | Best Fit | Photon | Tin11The inner temperature of the multi-color disk model. | T22MEKAL model temperature. | / d.o.f. | Flux33Observed X-ray fluxes and estimated luminosities for the 0.3 8 keV energy range, uncorrected for absorption. | LX33Observed X-ray fluxes and estimated luminosities for the 0.3 8 keV energy range, uncorrected for absorption. | |
|---|---|---|---|---|---|---|---|---|---|
| Counts | Model | ( cm-2) | index | (keV) | (keV) | (erg s-1 cm-2) | (erg s-1) | ||
| X18 | 141.3 | ABS*PL | (4.5) | 1.5 | 2.4 / 7 | 3.65E-14 | 6.30E+37 | ||
| X29 | 84.8 | ABS*PL | (2.2) | 1.26 | 0.43 / 3 | 2.48E-14 | 4.30E+37 | ||
| X10aaPossible line emission. | 172.7 | ABS*(PL+MEKAL) | (9.5) | 2.1 | 0.46 | 7.0 / 7 | 2.72E-14 | 4.70E+37 | |
| X12 | 1197.7 | ABS*MCD | (4.0) | 0.60 | 85.9 / 71 | 1.58E-13 | 2.76E+38 | ||
| X20 | 201.4 | ABS*PL | 0.19 | 1.7 | 13.72 / 11 | 4.80E-14 | 8.35E+37 | ||
| X23bbExcess flux just over 1 keV. | 106.0 | ABS*MCD | 0.037 | 0.37 | 5.28 / 4 | 1.13E-14 | 1.95E+37 | ||
| X24 | 186.8 | ABS*PL | 0.19 | 2.4 | 7.54 / 10 | 3.20E-14 | 5.66E+37 | ||
| X21 | 58.9 | ABS*MCD | 0.21 | 0.23 | 2.89 / 2 | 6.00E-15 | 1.68E+37 | ||
| X28aaPossible line emission. | 309.8 | ABS*MCD | 0.04 | 0.64 | 24.7 / 17 | 3.98E-15 | 6.98E+37 | ||
| X22 | 1411.6 | ABS*PL | 0.6 | 1.9 | 86.73 / 85 | 4.34E-13 | 7.62E+38 |
2.3. X-ray Colors and Models
After examining the resulting X-ray source catalog, we eliminate some sources from further consideration in this work for the following reasons. First, we remove all sources located beyond the optically luminous portion of NGC 4449 (R 3-4 kpc), since these are almost certainly background galaxies and not associated with NGC 4449 itself. We also eliminate one source that is a confirmed supernova remnant in NGC 4449 (Patnaude & Fesen, 2003), and another which appears to be a spurious detection of diffuse emission near the center of the galaxy. Two additional X-ray sources are coincident with foreground stars and were also eliminated. Our final catalog contains 23 sources that we believe are X-ray binaries. These are listed in Table 2.
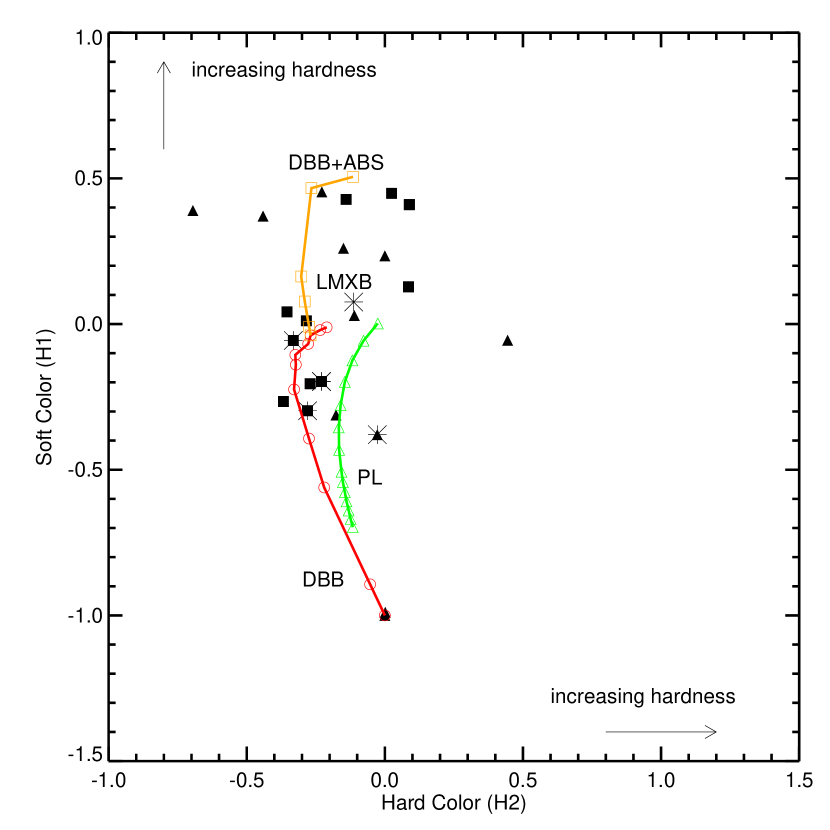
The observed H1 vs. H2 colors of the X-ray binaries are shown in Figure 3. Two models are shown for reference. The red line shows predictions from disk blackbody models with temperatures ranging from keV. Black hole binaries typically have disk blackbody temperatures of kT keV. The orange line shows the effect of adding absorption to the disk blackbody models. The green line represents a power law with increasing photon index from . Accreting low mass neutron star binaries typically have absorbed power law spectra with photon index . Figure 3 suggests that NGC 4449 has a mix of X-ray binary populations typical of a galaxy that has had on-going star formation, with some sources better following disk black-body models and others in the absorbed portion of the diagram. The nature of the X-ray binaries will be discussed in more detail in Section 6.
3. Optical Observations from HST
It has been suggested that the dense environments found in compact star clusters may be very efficient in producing XRBs (e.g., McSwain et al. (2007)). Regardless of whether or not XRBs form within compact clusters, the clusters are good tracers of star formation in galaxies, and hence can provide important constraints on the XRB population. The goals of this section are two-fold: (1) select a new catalog of compact star clusters in NGC 4449, to correlate with the locations of the XRBs, and (2) measure luminosities and colors for any point source coincident with an XRB and hence likely to be the donor star (discussed in Sections 5.2 and 6.4). While a catalog of clusters in NGC 4449 already exists (Gelatt, Hunter & Gallagher, 2001), it is based on partial imaging taken with the WFPC2 instrument on board , and there are now deeper, higher resolution data with full coverage of NGC 4449 available from the Wide Field Channel (WFC) camera of the Advanced Camera for Surveys (ACS) instrument.
3.1. Data and Photometry
ACS/WFC imaging of two positions within NGC 4449 was taken in the F435W (), F555W ( band), F814W ( band), and the F658N () filters, on November 10-11, 2005 (Proposal ID GO: 10585, PI: Aloisi). Four individual exposures were taken in each filter at each pointing. The ACS/WFC has a pixel scale of 0.049, or a projected scale of 18.4 pc per arcsecond at the assumed distance of Mpc (Annibali et al., 2008) to NGC 4449. We downloaded the ACS data from the Hubble Legacy Archive444http://hla.stsci.edu/ (HLA). The HLA combines the individual flatfielded exposures for a specific filter together using the PYRAF task , and outputs geometrically corrected images. For the NGC 4449 observations, the HLA used stars from the U.S. Naval Observatory catalogue to astrometrically correct the images.
We also use available F336W () band imaging of two pointings within NGC 4449, taken with the WFPC2 camera (Proposal ID GO: 6716, PI: Stecher). Each position has two exposures. The WFPC2 has four CCDs the Planetary Camera (PC) has a scale of 0.0456 pix-1, and the three Wide Field (WF) CCDs have a scale of 0.0996 pix-1. Note that there are two sets of images for each WFPC2 observation available in the HLA: a combined WFPC2 image including all four CCDs with the PC resampled to the same resolution as the three WF CCDs, and an image of only the PC, at its original pixel scale. We have used the combined WFPC2 image when our cluster candidates were in one of the three WFs and WFPC2-PC for objects located in the PC. Details on pointings and exposure times for the data used here are given in Table 4.
| Instrument | Proposal ID | Filter | Exposure time (s) |
|---|---|---|---|
| WFPC2 | 6716 | F336W | 2520 |
| ACS/WFC | 10585 | F435W | 43660 (PosA) |
| 43478.91 (PosB) | |||
| F555W | 42460 | ||
| F658N | 4360 | ||
| F814W | 42060 |
We identified 200,000 sources in each ACS pointing (in the band), using the IRAF555IRAF is distributed by the National Optical Astronomy Observatories, which are operated by the Association of Universities for Research in Astronomy, Inc., under cooperative agreement with the National Science Foundation. DAOFIND task. These include star clusters and bright, individual stars in NGC 4449, as well as some foreground stars and background galaxies. We perform circular aperture photometry of all detected sources using radii of 1 and 3 pixels and background annuli of 8 and 13 pixels, using the PHOT task in IRAF. We use zeropoints on the VEGAMAG system taken from Table 9 in Holtzman et al. (1995a) for the WFPC2/F336W filter, and from Table 10 in Sirianni et al. (2005) for the ACS observations. Corrections for inefficiency in the charge transfer were determined for the WFPC2/F336W photometry based on the formulae given by Dolphin (2000; we have used the most recent characterization available from A. Dolphin’s website http://purcell.as.arizona.edu/wfpc2_calib/). We also applied aperture corrections to extrapolate from our fixed aperture radius to the total magnitude in each filter, based on the concentration index (, the magnitude difference measured between a radius of 1 and 3 pixels) measured for each source. We obtained a linear fit between the measured and aperture corrections for 20 hand-selected, relatively isolated sources, and used this fit to estimate the aperture corrections for the rest of the sources.
3.2. Color Magnitude Diagram of Donor Stars
The colors and luminosities of individual stars give an estimate of their masses and hence a constraint on their ages. In several cases, the optical images reveal a single point source within the positional uncertainty of an XRB, which is likely the donor star. Although a full analysis of the spectral energy distributions for these stars is beyond the scope of this paper and will be presented in a future work, we can use our photometry to broadly assess their ages. In Figure 4, we compare the measured luminosities and colors for these matched optical sources with solar metallicity stellar isochrones with ages of Myr, 100 Myr, and 1 Gyr from the Padova group (Girardi et al. (2008); Marigo et al. (2008)). These provide a rough guide to the ages/types of the candidate donor stars, and suggest that the bright stellar sources associated with X10 and X24 are supergiant stars, while those associated with X6, X31, and X14 are significantly fainter and hence may be somewhat older.

3.3. Cluster Selection
We measure the sizes of all detected objects using the Ishape software (Larsen, 1999). This gives a better measure than CI of the sizes of relatively bright, isolated star clusters. Ishape convolves analytic profiles with the PSF, and determines the best fit to each source. We assume a KING30 profile, a single mass King (1966) model with a fixed ratio of tidal to core radius of 30 and fit the data within a radius of 5 pixels. For more details on Ishape and estimating the sizes of clusters, see Larsen (1999).
Most star clusters are slightly broader than the PSF at the distance of NGC 4449. The biggest challenge in selecting compact star clusters from the entire source list is to separate them from chance blends and superpositions in the crowded star forming regions. We use the following critieria to select star cluster candidates: (1) (M at the assumed distance of 3.82 Mpc for NGC 4449); (2) ; (3) FWHM 0.2 pixels, i.e. at least 0.2 pixels broader than the PSF, as measured by Ishape; and (4) no “neighbors”, i.e. other object detected within a 5 pixel radius. A final by-eye inspection was made to throw out some remaining blends (at the level). The final catalog contains 129 candidate star clusters, double the number published previously by Gelatt, Hunter & Gallagher (2001). Basic information for the selected clusters, including their locations and measured photometry, is given in Table 5. The cluster locations are shown in Figure 2.
| Number | RA | DEC | U-B | V-I | Age11Typical uncertainties are approximately in log . |
|---|---|---|---|---|---|
| log(/yr) | |||||
| 1 | 187.05396 | 44.083114 | -2.106 | -0.295 | 6.40 |
| 2 | 187.05370 | 44.083248 | -2.195 | -0.395 | 6.02 |
| 3 | 187.06067 | 44.083354 | -0.303 | 1.080 | 9.30 |
Note. — This table is published in its entirety in the electronic edition of the Astrophysical Journal. A portion is shown here for guidance regarding its form and content.
3.4. Cluster Age, Mass and Size Estimates
Figure 5 compares predictions from solar metallicity stellar population models of Charlot & Bruzual (2007; hereafter CB07, private communication; see also Bruzual & Charlot (2003)), with colors measured for our final cluster sample. Crosses mark the predicted colors for , , , , and yr clusters, starting from the upper left. The arrow shows the direction of reddening for a Galactic-type extinction law (Fitzpatrick, 1999).

The model predictions match our cluster photometry relatively well. The majority of the clusters have blue integrated colors, indicating that they are fairly young, with ages yr. At the top of the diagram there are a few young clusters in crowded regions that fall above the models, likely due to some contamination from neighbors in the lower resolution band images (we see a similar effect for the colors of clusters in M51; Chandar et al. (2010a)). The few sources with U-B colors significantly redder than the model predictions are somewhat faint in the band, leading to large uncertainties in this color. The bottom panel of Figure 5 shows the vs. two-color diagram, and includes some objects for which no band photometry was measured, either because they are outside the field of view or because they are too faint in this band. The sources which fall significantly below (redward of) the model predictions in have strong nebular line emission (which is observed in the narrow-band F658N (H) filter), moving them off the model track. While two-color diagrams like those shown in Figure 5 are useful for visualizing the evolution of clusters, we actually use a minimization technique to estimate the ages of the clusters. This means that points outside the models (e.g., the “high” points in Figure 5) can be reasonably well fit.
We estimate the age and extinction for each cluster as we have done in previous works (see e.g., Fall et al. (2005) for details), by performing a least fit comparing observed magnitudes with the predictions from the CB07 stellar population models with solar metallicity (), which appear to match the measured colors of clusters in NGC 4449 reasonably well. The best fit combination of and for each cluster returns the minimum : , where the sum runs over all available broad-band () filters and the F658N narrow-band filter, but requires a minimum of three measurements (including the band) to estimate age and extinction. The weights are related to the photometric uncertainty as . The F658N filter includes both stellar continuum and nebular line emission, and is dominated by line emission from ionized gas for the youngest ( Myr) objects, and by continuum emission from stars for clusters with ages of yr. This enables us to use the narrow-band filter as a fifth data point in many cases, regardless of the age of the cluster.
We tested our method by estimating ages and masses from our analysis for different assumptions regarding extinction and by comparing our photometry with the predictions from a model with lower metallicity (). In general, we find that the age estimates are quite robust for very young clusters yr) that have nebular emission, and for clusters with ages between yr yr. Clusters older than yr suffer from the well-known age-metallicity degeneracy, and we cannot tell if they are approximately a Gyr or older than Gyr from the data presented here. Eleven clusters in our catalog have integrated colors similar to those of metal-poor globular clusters in our Galaxy (and in many other galaxies) with and . The dating of clusters with no nebular emission and with ages between yr and yr is degenerate in some cases, with two nearly equally good combinations of age and extinction. We estimate that typical uncertainties are in log for clusters with yr, typical for this method (e.g., Fall et al. (2009)).
The mass of each cluster is estimated from the total band luminosity, corrected for extinction, and the age-dependent mass-to-light ratios () predicted by the CB07 models.
4. Formation and Disruption of the Clusters
The mass and age distributions of a population of star clusters provides important clues to the formation and disruption of the clusters. In Figure 6 we show the mass and age estimates for star clusters in NGC 4449. The solid line represents , the approximate completeness limit of our sample, and shows that our sample does not contain clusters over the same mass range at all ages, because clusters fade over time. The mass-age diagram shows some small scale features, such as a sparsely populated region in the range yr. This particular feature occurs where the predicted colors loop back on themselves, covering a small region in color space over a relatively long time, and effectively resulting in a gap. This artificial, empty stripe and similar features do not affect our conclusions.

Qualitative trends in the distribution of cluster ages and masses are apparent from the mass-age diagram. We see that NGC 4449 has formed relatively massive clusters () more or less continuously over the last yr. A number of clusters (approximately half of our sample), formed very recently, in the last yr, and a number of clusters clearly formed yr ago. As mentioned in Section 3.3, our sample includes candidate ancient globular clusters, implying that NGC 4449 began forming stars approximately a Hubble time ago. This is broadly consistent with the results of Annibali et al. (2008), who found that stars in NGC 4449 have formed over at least the last yr, with tentative evidence for earlier star formation as well, based on the colors and luminosities of individual stars. Qualitatively, the overall distribution of cluster ages and masses in NGC 4449 appears to be similar to that in other galaxies with very different environments and star formation histories, such as the merging Antennae galaxies (e.g., Fall et al. (2005), and the more quiescent Magellanic Clouds (Chandar et al., 2010a), although the gap between yr is somewhat more prominent. We present a more quantitative analysis below.


Figure 7a shows the age distribution for clusters in NGC 4449 in two different intervals of mass. Note that the data points for each distribution are restricted to a mass-age range that is not affected by incompleteness (i.e. above the solid line), so the observed shapes are caused by the formation and disruption of the clusters and not by their fading out of our sample. Although there are few data points, these distributions appear to decline steeply, and can be approximated by a simple power law, , with best fits of for clusters more massive than , and for clusters with masses between . These values of are the same within the uncertainties. We find that can change by up to if different bin sizes and centers are used, but the overall decline starting at very young ages does not change. Based on these experiments, we take .
Figure 7b shows the mass function for clusters in NGC 4449 in two different intervals of age. These mass functions can be approximated by a power law, , with best fit values of for yr, and for yr, which are the same within the uncertainties. We take to be , the mean and range of the values above.
Because the mass and age distributions appear to be at least approximately independent of one another, the joint distribution of cluster ages and masses can be approximated as , with and , for yr and , similar to the form observed for clusters in the Magellanic Clouds (Chandar et al., 2010a), M83 (Chandar et al., 2010b), and in the Antennae (Whitmore et al., 2007; Fall et al., 2010).
Chandar et al. (2010c) compiled results for the age distribution of star clusters in over a dozen different galaxies, including dwarf irregular, spiral, and merging galaxies. All of these different galaxies appear to have similar shapes to their (mass-limited) age distributions, where they decline from the present to the past (over the past few yr). This shape for the age distribution has previously been interpreted as due primarily to the gradual, early disruption rather than to the formation of the clusters, since it is far more likely that the clusters in all of these galaxies have similar disruption histories than it is that they have similar formation histories.
After their formation in the dense cores of giant molecular clouds, different physical processes cause clusters to lose mass and to eventually disrupt. Fall et al. (2009) and Chandar et al. (2010a) have suggested the following approximate sequence and timescale for these processes: (1) removal of ISM by stellar feedback, yr; (2) continued stellar mass loss, ; and (3) tidal disturbances by passing molecular clouds, yr. It is likely that the cluster mass and age, which can be approximated by power-law distributions, result from a complex situation that involves several of these disruption processes. We refer the interested reader to Fall et al. (2009) and Chandar et al. (2010a) for more details. On longer timescales, mass-loss is driven by the escape of stars due to internal two-body relaxation, or evaporation.
5. Spatial Correlation Between X-ray and Optical Sources
5.1. Correlation Between the Positions of XRBs and Star Clusters
Kaaret et al. (2004) previously suggested that X-ray sources in three different starburst galaxies (M82, NGC 1569 and NGC 5253) may have formed in young star clusters, because they are preferentially located near star clusters, albeit with a significant displacement ( pc on average). This conclusion was based on a comparison between the cumulative distribution of displacements measured between actual X-ray sources and their closest clusters, and simulated displacements from a population of X-ray sources distributed randomly relative to the clusters. In order to explore whether or not X-ray binaries form in compact star clusters, here we compare the positions (of the entire sample) of 23 candidate X-ray binaries (presented in Section 2) with those of the star clusters (Section 3), to look for a statistically significant spatial correlation between the two.
We repeat the spatial correlation analysis performed by Kaaret et al. (2004) for our sources in NGC 4449. We identify the nearest star cluster to each X-ray binary, and measure the (projected) distance between the two. For XRBs that are not coincident with clusters, this gives a lower bound on the displacement of the source from its parent cluster, since the closest cluster is not necessarily the parent. The results for NGC 4449 are shown in Figure 8 as a cumulative distribution of the separations between the binaries and the closest cluster. The figure shows that there are 7 XRBs that are within 100 pc of a star cluster, and nearly all are within 400 pc of a star cluster. Interestingly, three HMXBs in NGC 4449 are spatially coincident with very young star clusters (within the positional uncertainty of for ), suggesting that these XRBs formed within the clusters.
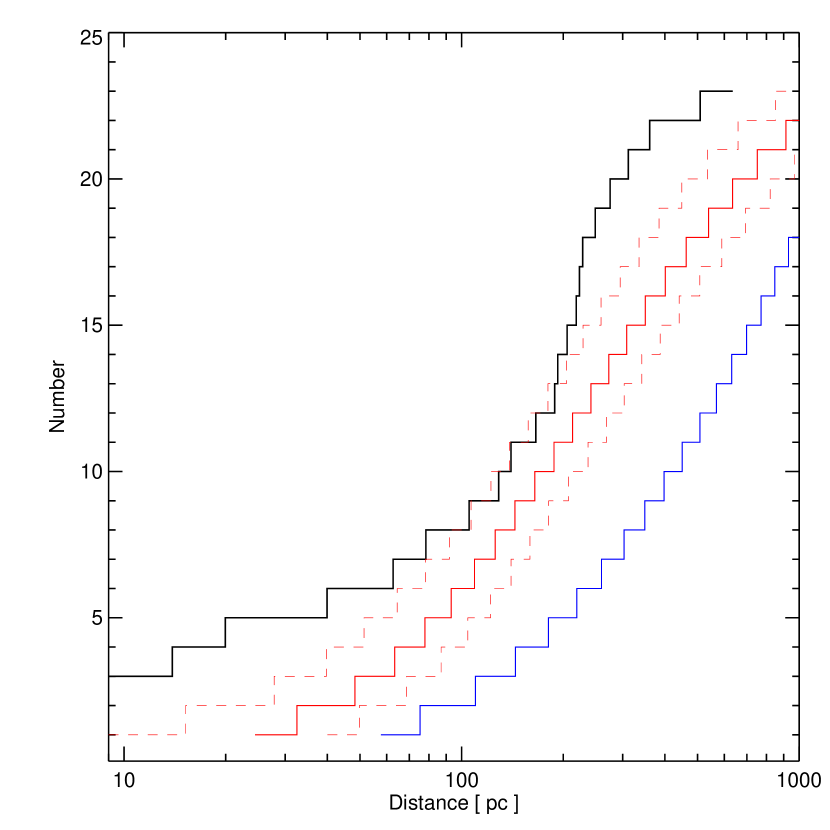
To determine whether the clustering of XRBs near star clusters is statistically significant, we compare the observations with simulated X-ray source populations. We consider two different randomly distributed cases, i.e. where the X-ray sources are not associated with the clusters. First, we generate random sets of (23) uniformly distributed sources, as done in Kaaret et al. (2004), and find spatial displacements from the star clusters using the procedure described above. The simulation was run 1000 times, with the cumulative distribution determined in exactly the same way as for the actual observations, and the median result shown as the blue line in Figure 8. The uniformly distributed random sources show a clear difference from the observed spatial displacements, similar to the results found by Kaaret et al. (2004) for three different starburst galaxies (not including NGC 4449).
Next, we select random sets of (23) sources distributed in a more realistic fashion, one where the XRBs fall off radially like the stellar light in NGC 4449 itself. This was accomplished by fitting the radial luminosity profile of NGC 4449 in a 2MASS band image, by a broken power-law, , with over the radial range 150 800 pc, and over the radial range 800 3000 pc. The band should give a reasonably good measure of the distribution of older stars that form the stellar backbone of NGC 4449, rather than the distribution of young star clusters. The median result from 1000 runs of the random simulations described above are shown as the solid red line in Figure 8. In this case, the results of the randomly drawn spatial displacements are more similar to the observations, except at the small displacement end, with the observations now overlapping partly with the uncertainty line from the simulation at separations pc. We find that a radial profile of NGC 4449 determined from far-ultraviolet images taken with GALEX gives very similar results to those based on the K-band profile. Our results indicate that the specific recipe used to populate synthetic X-ray sources in the image can affect the interpretation of the results, i.e. whether or not the X-ray sources are associated with star clusters. In general, a uniform distribution is much more likely to place synthetic X-ray sources in the outer portions of the galaxy when compared with the second method; because there are few X-ray sources located in the outskirts of NGC 4449, this procedure causes the simulation and observations to look substantially different.
We conclude that, in the case where the sources are distributed randomly but in a fashion similar to the underlying galaxy light, the random distribution does not differ significantly from the observed one, except at the smallest separations, where we find several XRBs closer to star clusters than predicted by the random distributions. These sources are discussed in more detail in Section 6.
5.2. Optical Sources That are Coincident With HMXBs
Three of the candidate HMXBs (X12, X21 and X46) have young ( yr) star clusters located within their positional uncertainties. There is also an XRB coincident with an old globular cluster (X29); this is almost certainly a low-mass X-ray binary (LMXB). Here, we check the probability that this spatial coincidence is due to chance superposition rather than to a physical association between the HMXBs and the clusters. We distribute 23 XRBs (the number in our sample) randomly throughout NGC 4449 in 100,000 runs, and find one chance superposition approximately every fifth run when all 129 clusters were included. This is 25 times less than the four real observed coincidences between star clusters and XRBs. The probability of a chance superposition is almost identical if we only consider the three coincident HMXBs and star clusters younger than 10 Myr, i.e. the most probable host clusters. Here, the random sources follow the luminosity profile of NGC 4449 (see Section 4.1). If the random sources are uniformly distributed instead, we find coincidences only 3% of the time, approximately 1 out of every 30 runs. Our results indicate that the positional coincidence between the XRBs and clusters in these three cases has a high statistical significance, and it is highly unlikely the result of chance superposition.
In addition to the XRBs that are coincident with star clusters, several others are coincident with an optical point source: X6, X10, X14, X20, and X24, as presented in Section 3.2. These point sources are well within the body of NGC 4449. They have the colors and magnitudes expected of supergiant stars, and are almost certainly the donor star in the X-ray emitting binary. Other candidate HMXBs are located in crowded regions, making it more difficult to identify a unique optical counterpart to the XRB, because there are several sources in the image within the positional uncertainties of the X-ray source. Some of the X-ray sources (e.g., X18, X13, X20, X11, and X19) do not have any obvious optical counterpart.
6. Discussion
6.1. Properties of Star Clusters Closest to HMXBs
The ages of star clusters in the vicinity of the X-ray binaries can help to constrain the ages and the nature of the HMXBs. Even when there is no unambiguous stellar or cluster counterpart to an X-ray source, it is plausible that the XRB is the same age as the stars and clusters around it. Here, we present the physical properties of the star cluster that is closest to each HMXB. In Table 6, for each HMXB we compile the distance to the closest star cluster in our catalog, and the age and mass of this cluster. We also include the X-ray luminosity of each source determined in Section 2.1, and a column that lists whether the X-ray colors are better described by a disk black body or a power law model, or are in the absorbed portion of the diagram.
| ID | X-ray | ID of Closest | Cluster Age11Uncertainties in the cluster age estimates are typically in log . | Distance | Notes |
|---|---|---|---|---|---|
| Model | Cluster | log(/yr) | (pc) | ||
| X8 | Absorption | 96 | 9.34 | 266 | |
| X14 | Absorption | 117 | 8.06 | 339 | |
| X18 | … | 117 | 8.06 | 285 | |
| X13 | Absorption | 112 | 8.06 | 232 | |
| X6 | Absorption | 93 | 6.64 | 122 | |
| X29 | … | 89 | 8.91 | 7 | LMXB |
| X10 | Power-law | 99 | 8.31 | 286 | |
| X12 | Disk blackbody | 104 | 6.96 | 10 | Coincident |
| X20 | Absorption | 33 | 8.86 | 222 | |
| X11 | Absorption | 102 | 8.36 | 89 | |
| X23 | Disk blackbody | 66 | 6.58 | 181 | |
| X15 | Power law | 13 | 8.31 | 9 | Coincident |
| X24 | Disk blackbody | 69 | 6.84 | 68 | |
| X21 | Disk blackbody | 53 | 6.72 | 13 | Coincident |
| X28 | Disk blackbody | 81 | 6.72 | 136 | |
| X31 | … | 87 | 6.70 | 630 | |
| X22 | Absorption | 70 | 6.38 | 133 | |
| X19 | Super soft source | 51 | 8.06 | 383 | |
| X41 | Super soft source | 50 | 6.90 | 225 | |
| X42 | Disk blackbody | 6 | 6.40 | 113 | |
| X43 | Absorption | 62 | 6.40 | 57 | |
| X44 | Absorbed | 75 | 6.16 | 134 | |
| X46 | Disk blackbodyPower law | 111 | 6.70 | 4 | Coincident |
The colors of HMXBs can vary, because these binaries go through different emission states, or because of their geometric orientation, since inclination effects through a disk can result in colors in the absorbed portion of the X-ray two-color diagram. This means that it is not possible to definitively identify the type of HMXB (e.g., black hole vs. neutron star) or to determine its age, just from the X-ray properties. However, different types of HMXBs do show some general trends in the color-color diagram. For example, black hole binaries often approximately follow the disk black-body models (Remillard & McClintock, 2006). At high accretion rates the X-ray emission from black hole binaries is dominated by thermal emission from a disk, leading to both high luminosities and soft X-ray colors. On the other hand, accreting low-mass neutron star binaries often have absorbed power-law spectra.
6.2. A Population of Very Young, Massive Black Hole Binaries in NGC 4449
We can select very young binaries, which are likely to be high-mass black hole binaries (BHB), in two different ways: (1) from their location in the X-ray color-color diagram, and (2) from their proximity to very young star clusters. We first select candidate BHBs from Table 6 based on their X-ray colors. There are seven X-ray sources that are best described by disk black-body models: X12, X21, X23, X24, X28, X42 and X46. All of these X-ray sources are either coincident with (X12, X21, and X46), or fairly close to (within 200 pc) a very young Myr star cluster.666Source X21 also happens to have an older, Myr cluster nearby. The coincidence with clusters is particularly important, because it establishes a direct connection between the BHBs and very young clusters (recall that in Section 5.1 we found that chance superpositions are highly unlikely). These seven sources have a median X-ray luminosity of erg s-1. The fact that they have the X-ray colors expected for BHBs and are also close to very young star clusters strongly supports that these sources are in fact, very young BHBs (discussed in more detail below).
Next, we select candidate black hole binaries based solely on their proximity (within 200 pc) of a very young ( Myr) star cluster. These criteria return all seven XRBs described by the disk black body models, plus four additional sources: X6, X22, X43, and X44. All four of these are found in the “absorbed” portion of the X-ray two-color diagram. However, they are located near star forming regions which contain very young Myr star clusters, and that are further out in NGC 4449 (with galactocentric distances kpc) on average than the seven sources discussed previously. The stellar density of the galaxy has dropped significantly at these galactocentric distances, which strongly suggests that X6, X22, X43, and X44 are associated with the nearby, recent star formation. In fact, random simulations return only a single XRB with kpc and within 200 pc of a young star cluster in 10,000 runs.
The physical association between BHBs and very young star clusters is also apparent as the small separations in the cumulative distribution of spatial displacements between XRBs and star clusters (Figure 8). This regime deviates strongly from random distributions, as we would expect if BHBs are physically associated with very young star clusters. We conclude that (at least some) BHBs form in, and not just near, compact star clusters, based on the fact that three candidate BHBs in our sample are spatially coincident with a very young star clusters and that a fourth is very close to a young cluster (within a projected distance of 13 pc).
The ages of Myr estimated for the coincident and proximate star clusters to the 11 XRBs discussed above strongly suggests that these are black hole (rather than neutron star) binaries. At these very young ages, only stars initially more massive than will have had time to become supernovae (based on the Padova models for solar metallicity). While there is still some uncertainty about the exact range of stellar masses that end their lives as black holes rather than as neutron stars, most models predict that the transition between these two types of compact remnants occurs for star with initial masses somewhere in the range of (e.g., Fryer (1999)), below the initial stellar masses that have completed their main sequence lifetime in Myr old star clusters. However, metallicity effects may complicate the relationship between initial stellar mass and remnant type (e.g., Heger et al. (2003)). Given these uncertainties we will refer to these as ’candidate’ BHBs.
One of the XRBs that is best described by a disk blackbody model, X24, is not coincident with a star cluster, but is coincident with a bright point source. The lack of any other bright stars within the astrometric uncertainty suggests that this is the high mass donor star in the XRB. The luminosity and color of this source are consistent with isochrones that are Myr, as shown in Figure 4, similar to the age of the nearest star cluster.
To summarize, the main results of this section are that we find strong evidence for a population of BHBs in NGC 4449, and that these massive binaries likely formed recently in compact star clusters. Three of the candidate BHBs appear to reside within their parent star clusters, while the others do not. These very young ( Myr) sources comprise a significant fraction of all X-ray emitting binaries brighter than erg s-1 in NGC 4449. BHBs therefore make up approximately 48% or 11 out of 23 XRBs.
6.3. Processes Responsible for the Spatial Displacement Between BHBs and Star Clusters
Black holes are the compact remnants of massive O stars. O stars typically form in (massive) clusters rather than in the field, although they can be dynamically ejected from clusters into the field. For example, studies of field O stars in the Milky Way (de Wit et al., 2005) show that the majority of field O stars appear to be runaways from nearby star clusters. Moreover, many and possibly most O stars are born in binaries (García & Mermilliod, 2001; Larson, 2001). Section 6.2 provided strong evidence that BHBs probably form in star clusters.
In the previous section, we found that while three of the candidate BHBs in NGC 4449 are coincident with a star cluster, the majority of them are not. What physical process(es) is responsible for this displacement between BHBs and their parent clusters? We consider three different mechanisms that could lead to the apparent displacement between BHBs and their parent star clusters:
-
•
The parent cluster has dissolved and is therefore no longer visible, leading to an apparent displacement between the BHB and neighboring clusters.
- •
- •
In Section 4, we suggested that the shape of the cluster mass and age distributions in NGC 4449 are primarily signatures of the disruption rather than the formation of the clusters. Regardless of whether individual clusters dissolve partially or fully, our results in NGC 4449 (and those in other galaxies), suggest that star clusters lose a significant amount of mass very quickly, on timescales of only Myr.777This early mass loss is not driven by relaxation of the cluster due to two-body interactions (e.g., Fall & Zhang (2001)). Relaxation-driven evaporation operates on significantly longer timescales than the ages of the BHBs, and ejects mostly low mass stars. UV spectra of starburst galaxies reveal that the dispersed field populations are dominated by B stars, whereas UV-bright star clusters are often dominated by O stars, consistent with a scenario of rapid cluster dispersal and/or mass-loss (e.g., Tremonti et al. (2001); Chandar et al. (2003)). Despite growing evidence that even massive star clusters, i.e., those most likely to host O stars, may disperse rapidly, we believe that this is unlikely to be the mechanism responsible for the observed spatial displacement between very young BHBs and star clusters. N-body simulations show that an unbound cluster retains the appearance of a bound cluster for crossing times (Baumgardt & Kroupa, 2007), on the order of 10-20 Myr for typical clusters in our NGC 4449 catalog. Since no cluster is observed at the locations of the majority of the BHBs, the early dispersal of clusters can be ruled out as the origin of the spatial displacement between very young, high mass BHBs and star clusters.
We conclude that many BHBs in NGC 4449 have been ejected from their parent clusters, either via dynamical kicks due to interactions with other stars in cluster cores, or due to an asymmetry in the supernova explosion of the compact object, which nonetheless does not unbind the binary. We cannot differentiate between these two mechanisms using the current observations. We can however, estimate lower and upper limits to the ejection velocities. We estimate a lower kick velocity by assuming that each BHB was ejected from its closest cluster very soon after it formed, and divide the distance to this cluster by its age, neglecting for the moment uncertainties in the cluster age estimates. These lead to lower limits of 45, 10, 27, and 23 km/s for X23, X24, X28, and X42, respectively. The other BHB binaries give limits of 28, 55, 23, and 84 km/s for X6, X22, X43, and X44. The cluster ages and hence the velocities are uncertain by a factor of two, resulting in lower limits to the velocities between km/s. Of course dynamical ejection need not have occurred right after the cluster formed, but could have occurred more recently. We estimate upper limits to the kick velocities by assuming that each BHB was ejected within the last 1 Myr, i.e. we divide the distance by 1 Myr. This procedure gives a range of velocities (for non-coincident sources) between km/s.
6.4. The Nature of Older X-ray Binaries in NGC 4449
In the previous subsections we found that of the 23 candidate XRBs in NGC 4449 are likely very young, massive BHBs. The goal of this section is to better understand the ages and types of the remaining X-ray binaries.
We first constrain the number of low mass X-ray binaries (LMXBs) in NGC 4449, systems consisting of a black hole or neutron star accreting from a low-mass companion. Source X29 is almost certainly a LMXB, because it is spatially coincident with a cluster that has integrated colors similar to those of ancient Galactic globular clusters. Its X-ray colors and luminosity however, are unremarkable when compared with the rest of the XRB sample, and therefore cannot be used to select ancient LMXBs in general. In their study of five early-type galaxies (ellipticals and lenticulars), which have formed LMXBs but not HMXBs, Kundu et al. (2007) find % of all LMXBs are coincident with globular clusters and the rest are found in the field. Assuming a similar fraction of cluster-to-field LMXBs in NGC 4449 implies that there are field and hence total LMXBs in NGC 4449, % of our total sample.
Our analysis implies that there are remaining X-ray binaries in NGC 4449 that are neither very young, high mass BHBs nor very old LMXBs. These are likely older than Myr and younger than several billion years (age of LMXBs). Interestingly, from Table 6 we find that the closest clusters to X14, X18, X13, X10, X20, X11, and X19 are all intermediate age, with Myr. The separations between these X-ray binaries and their closest clusters is larger than those found between BHBs and their closest clusters, with a median (mean) separation of 285 pc (250 pc).
These “intermediate” age HMXBs are likely neutron star X-ray binaries with either a Be or supergiant star for a companion. Accretion from the former occurs via a disk, while the latter are primarily wind fed. There are also differences in the optical luminosities of Be versus supergiant donor stars: Be-HMXBs in the Small Magellanic Cloud have ranging from to (McBride et al., 2008), which at the distance of NGC 4449 corresponds to , while supergiant HMXBs in the Galaxy are significantly brighter (Chevalier & Ilovaisky, 1998), with brighter than (). X10 and X14 are therefore candidate supergiant-HMXBs, because they have bright coincident point sources (see Section 3.2). X18, X13, X20, X11, and X19 however, do not show any bright coincident point sources in the optical images down to , and are therefore likely Be-HMXBs.
Be-X-ray binaries dominate the population of HMXBs in the Magellanic Clouds (McBride et al., 2008). They turn-on approximately 20-50 Myr after a star formation event, as the first neutron stars are formed. The low mass of the neutron star and lower accretion rates mean that Be-X-ray binaries typically have lower X-ray luminosities than massive BHBs. However, most Be star X-ray binaries go into outburst when the neutron star passes through the circumstellar disk of the Be star and the accretion rate increases. We note that the candidate Be-HMXBs in NGC 4449 have X-ray luminosities considerably higher than quiescent Be X-ray binaries. If they are indeed Be X-ray binaries, then they are in outburst, and we are detecting only the highest luminosity sources. This would suggest there is a much larger population of Be X-ray binaries in NGC 4449 below our detection threshold.
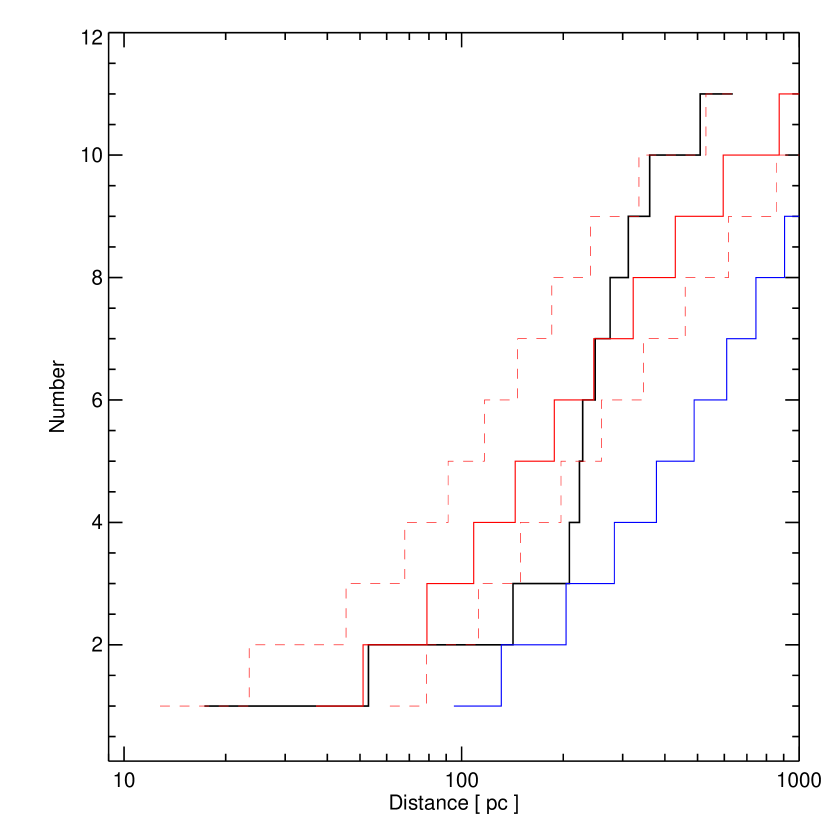
In Section 6.2 we used the spatial displacement diagram to support our conclusion that very young, massive BHBs form in compact star clusters. Here, we note that there is an inherent limitation in our ability to interpret this diagram for older binaries. While the association between very young clusters and XRBs shows up clearly, this is not true for intermediate age sources. Figure 9 shows the cumulative distribution of displacements between Myr X-ray binaries and star clusters, where we have removed the BHBs and the known LMXB. After Myr, XRBs that have been ejected at even low velocities of a few km/s are no longer obviously spatially associated with their parent clusters, since at separations larger than pc the distribution is consistent with the uncertainties from a random distribution.
7. Summary and Conclusions
In this paper, we presented the discovery of 23 candidate X-ray binaries in the nearby starburst galaxy NGC 4449, from Chandra/ACIS-S observations. We measured count rates, luminosities, and colors for these sources.
We also presented a new catalog of 129 compact star clusters brighter than in NGC 4449 from multi-band, high resolution, optical imaging taken with the ACS/WFC and WFPC2 cameras on-board the . This doubled the number of compact star clusters known in this galaxy. Mass and age estimates for these clusters show that NGC 4449 has formed relatively massive () clusters more or less continuously over the last yr. The joint distribution of cluster ages and masses appears to be similar to those found in other nearby galaxies such as the Magellanic Clouds, M83, and the merging Antennae galaxies, albeit with somewhat larger uncertainties due to the smaller number of clusters, and can be approximated as , with and .
Our main conclusion is that we have found clear evidence for a population of very young, high mass, black hole X-ray binaries in NGC 4449. We find 11 candidate high mass BHBs, nearly half of the sample of X-ray emitting binaries. Three of the BHB candidates are coincident, within the astrometric uncertainties of , with a very young, Myr star cluster, and a fourth is nearly coincident with a very young cluster. The others are all within 200 pc of very young clusters. Based on these results, we suggest that these massive BHBs form in star clusters, where most massive O stars (the progenitors of BHBs) are born. Many are subsequently ejected from their parent clusters either due to dynamical interactions within dense clusters or as the result of an asymmetric supernova explosion. The observed displacement between BHBs and very young star clusters is not caused by the dissolution of the parent clusters. The small separation between massive BHB candidates and their closest cluster clearly deviates from randomly populated distributions, further supporting our conclusion that these X-ray binaries have a direct relationship with young star clusters.
We found one X-ray binary in NGC 4449 that is coincident with an old star cluster, and hence is almost certainly a LMXB. Based on the fraction of LMXBs found in the field vs. in globular clusters in early-type galaxies, we estimate that there are field LMXBs and hence total LMXBs in NGC 4449, although they cannot be identified from their X-ray properties alone.
We suggest that the remaining XRBs are intermediate age supergiant and Be-HMXBs. Although none of these remaining binaries are coincident with a star cluster, the closest cluster to these sources has an estimated age between Myr. In two cases, we identify coincident point sources in the images that have luminosities consistent with those expected of supergiant donor stars. The other candidate intermediate-age X-ray binaries do not have an obvious optical counterpart, consistent with the expected luminosities for Be star donors.
Based on these results, we conclude that high mass X-ray binaries, particularly massive, black-hole binaries, dominate the X-ray luminosity from NGC 4449. We suggest that the ages and locations of star clusters provide important insight and constraints on the different types of X-ray binaries in nearby star-forming galaxies.
References
- Annibali et al. (2008) Annibali, F., Aloisi, A., Mack, J., Tosi, M., van der Marel, R. P., Angeretti, L., Leitherer, C., & Sirianni, M. 2008, AJ, 135, 1900
- Baumgardt & Kroupa (2007) Baumgardt, H., & Kroupa, P. 2007, MNRAS, 380, 1589
- Blaauw (1961) Blaauw, A. 1961, Bull. Astron. Inst. Netherlands, 15, 265
- Bruzual & Charlot (2003) Bruzual, G., & Charlot, S. 2003, MNRAS, 344, 1000
- Chandar et al. (2003) Chandar, R., Leitherer, C., Tremonti, C., & Calzetti, D. 2003, ApJ, 586, 939
- Chandar et al. (2010a) Chandar, R., Fall, S. M., & Whitmore, B. C. 2010, ApJ, 711, 1263
- Chandar et al. (2010b) Chandar, R., et al. 2010, ApJ, 719, 966
- Chandar et al. (2010c) Chandar, R., Whitmore, B. C., & Fall, S. M. 2010, ApJ, 713, 1343
- Chevalier & Ilovaisky (1998) Chevalier, C., & Ilovaisky, S. A. 1998, A&A, 330, 201
- de Wit et al. (2005) de Wit, W. J., Testi, L., Palla, F., & Zinnecker, H. 2005, A&A, 437, 247
- Dolphin (2000) Dolphin, A. 2000, PASP, 112, 1397
- Fall et al. (2005) Fall, S. M., Chandar, R., Whitmore, B. C. 2005, ApJ, 631, 133
- Fall et al. (2009) Fall, S. M., Chandar, R., Whitmore, B. C. 2009, ApJ, 705, 453
- Fall et al. (2010) Fall, S. M., Krumholz, M. R., & Matzner, C. D. 2010, ApJ, 710, L142
- Fall & Zhang (2001) Fall, S. M., & Zhang, Q. 2001, ApJ, 561, 751
- Fitzpatrick (1999) Fitzpatrick, E. L. 1999, PASP, 111, 63
- Freeman et al. (2002) Freeman, P. E., Kashyap, V., Rosner, R., & Lamb, D. Q. 2002, ApJS, 138, 185
- Fryer (1999) Fryer, C. L. 1999, ApJ, 522, 413
- García & Mermilliod (2001) García, B., & Mermilliod, J. C. 2001, A&A, 368, 122
- Gelatt, Hunter & Gallagher (2001) Gelatt, A. E., & Hunter, D. A., & Gallagher, J. S. 2001 PASP, 113, 142
- Gies & Bolton (1986) Gies, D. R., & Bolton, C. T. 1986, ApJS, 61, 419
- Girardi et al. (2008) Girardi, L., Dalcanton, J., Williams, B., et al. 2008, PASP120, 583
- Grevesse & Sauval (1998) Grevesse, N., & Sauval, A. J. 1998, Space Sci. Rev., 85, 161
- Heger et al. (2003) Heger, A., Fryer, C. L., Woosley, S. E., Langer, N., & Hartmann, D. H. 2003, ApJ, 591, 288
- Holtzman et al. (1995a) Holtzman, J., Burrows, C. J., Casertano, S., Hester, J., Trauger, J. T., Watson, A. M., & Worthey, G. 1995a, PASP, 107, 1065
- Hunter (1997) Hunter, D. 1997, PASP, 109, 937
- Kaaret et al. (2004) Kaaret, P., Alonso-Herrero, A., Gallagher, J. S., Fabbiano, G., Zezas, A., Rieke, M. J. 2004, MNRAS, 348, 28
- King (1966) King, I. R. 1966, AJ, 71, 64
- Kundu et al. (2007) Kundu, A., Maccarone, T. J., & Zepf, S. E. 2007, ApJ, 662, 525
- Larsen (1999) Larsen, S. 1999, A&AS, 139, 393
- Larson (2001) Larson, R. B. 2001, The Formation of Binary Stars, 200, 93
- Liedahl et al. (1995) Liedahl, D. A., Osterheld, A. L., & Goldstein, W. H. 1995, ApJ, 438, L115
- Marigo et al. (2008) Marigo, P., Girardi, L., Bressan, A., et al. 2008, A&A, 482, 883
- McBride et al. (2008) McBride, V. A., Coe, M. J., Negueruela, I., Schurch, M. P. E., & McGowan, K. E. 2008, MNRAS, 338, 1198
- McSwain et al. (2007) McSwain, M. V., Ransom, S. M., Boyajian, T. S., Grundstrom, E. D., Roberts, Mallory S. E. 2007, ApJ, 660, 740
- Mitsuda et al. (1984) Mitsuda, K., et al. 1984, PASJ, 36, 741
- Patnaude & Fesen (2003) Patnaude, D. J., Fesen, R. A. 2003, ApJ, 587, 221
- Poveda et al. (1967) Poveda, A., Ruiz, J., & Allen, C. 1967, Boletin de los Observatorios Tonantzintla y Tacubaya, 4, 86
- Prestwich et al. (2003) Prestwich, A. H., Irwin, J. A., Kilgard, R. E., Krauss, M. I., Zezas, A., Primani, F., & Kaaret, P., & Boroson, B. 2003, ApJ, 595, 719
- Remillard & McClintock (2006) Remillard, R. A. & McClintock, J. E. 2006, ARA&A, vol. 44, Issue 1, pp.49-92
- Sirianni et al. (2005) Sirianni, M., M.J. Jee, N. Ben tez, J.P. Blakeslee, A.R. Martel, G. Meurer, M. Clampin, G. De Marchi, H.C. Ford, R. Gilliland, G.F. Hartig, G.D. Illingworth, J. Mack, and W.J. McCann 2005, PASP, 117, 1049
- Thronson et al. (1987) Thronson, H. A., Jr., Hunter, D. A., Telesco, C. M., Decher, R., & Harper, D. A. 1987, ApJ, 317, 180
- Tremonti et al. (2001) Tremonti, C. A., Calzetti, D., Leitherer, C., & Heckman, T. M. 2001, ApJ, 555, 322
- Whitmore et al. (2007) Whitmore, B. C., Chandar, R., & Fall, S. M. 2007, AJ, 133, 1067
- Zezas et al. (2002) Zezas, A., Fabbiano, G., Rots, A. H., Murray, S. S. 2002, ApJ, 577, 710
- Zwicky (1957) Zwicky, F. 1957, Berlin: Springer, 1957