The environmental dependence of the structure of outer galactic discs in STAGES spiral galaxies
Abstract
We present an analysis of -band radial surface brightness profiles for spiral galaxies from the field and cluster environments using Hubble Space Telescope/Advanced Camera for Surveys imaging and data from the Space Telescope A901/2 Galaxy Evolution Survey (STAGES). We use a large sample of face-on to intermediately inclined spiral galaxies and assess the effect of the galaxy environment on the azimuthally averaged radial surface brightness profiles for each galaxy in the outer stellar disc (). For galaxies with a purely exponential outer disc ( per cent), we determine the significance of an environmental dependence on the outer disc scalelength . For galaxies with a broken exponential in their outer disc, either down-bending (truncation, per cent) or up-bending (anti-truncation, per cent), we measure the strength (outer-to-inner scalelength ratio, ) of the breaks and determine the significance of an environmental dependence on break strength . Surprisingly, we find no evidence to suggest any such environmental dependence on either outer disc scalelength or break strength , implying that the galaxy environment is not affecting the stellar distribution in the outer stellar disc. We also find that for galaxies with small effective radii () there is a lack of outer disc truncations in both the field and cluster environments. Our results suggest that the stellar distribution in the outer disc of spiral galaxies is not significantly affected by the galaxy environment.
keywords:
galaxies: clusters: general — galaxies: evolution — galaxies: spiral — galaxies: structure —1 Introduction
The structure of the outer regions of galactic discs is important to our understanding of the formation and evolution of spiral galaxies. These faint, outer regions are more easily affected by interactions with other galaxies, and therefore their structural characteristics must be closely related to their evolutionary history. Certain physical processes inherent to galaxy evolution and dependent on the galaxy environment, for example, ram pressure stripping of the interstellar medium, mergers, and harassment (e.g., Gunn & Gott, 1972; Okamoto & Nagashima, 2004; Moore et al., 1996) could have an effect on the galactic disc and therefore the light distribution (surface brightness profile) of a galaxy. Therefore, the environmental dependence of the shape of spiral galaxy radial surface brightness profiles in the outer galactic disc will provide evidence for the physical processes of galaxy evolution occurring in different environments.
Since the work of Patterson (1940), de Vaucouleurs (1959), and Freeman (1970) we have known that the light profiles of spiral galaxies are comprised of two main components: an inner component dominated by a bulge, and an outer disc that follows a simple exponential decline with minor deviations related to the spiral arms. However, this classical picture does not hold for most spiral galaxies in the Universe and has been shown to fail at the faint surface brightness of the outer stellar disc (van der Kruit, 1979; Pohlen et al., 2002). Since van der Kruit (1979) we have known that the exponential decline in the outer disc does not extend out to the last measured point but can be truncated (sharply cut off) after several scalelengths. More recently Pohlen et al. (2002) have shown that the exponential decline does not cut off completely at the truncation. They find that most profiles are actually best described by a two slope model (broken exponential), characterised by an inner and outer exponential scalelength separated by a relatively well defined break radius . Many studies have now reported (mainly using surface photometry) the existence of broken exponential stellar discs (truncations) in spiral galaxies in both the local (Pohlen et al., 2002; Pohlen & Trujillo, 2006; Pohlen et al., 2007; van der Kruit, 2007; Bakos et al., 2008) and distant Universe (Pérez, 2004; Trujillo & Pohlen, 2005; Azzollini et al., 2008).
As a result of these studies it has been shown that disc galaxies can be classified into three broad types (Type I, II, and III) according to break features in their radial stellar surface brightness profiles (see e.g. Pohlen & Trujillo, 2006). Type I (no break), the galaxy has a simple exponential profile extending out to several scalelengths (e.g. Bland-Hawthorn et al., 2005). Type II (down-bending break, truncation), the exponential is broken with a shallow inner and steeper outer exponential region separated by a relatively well defined break radius (van der Kruit, 1979; Pohlen et al., 2002). Type III (up-bending break, antitruncation), a class recently discovered by Erwin et al. (2005) which have a broken exponential with the opposite behaviour to a Type II profile. In each case the classification refers to the outer, disc component of the galaxy radial surface brightness profile and does not consider the inner varying bulge component. In some cases the inner bulge component may be near exponential in nature, however, this classification scheme only considers the disc component and is fairly insensitive to the nature of the inner (bulge) profile.
Measurements independent of surface photometry (from resolved star counts) are also available on nearby galaxies for each of the three profile types. Bland-Hawthorn et al. (2005) find that NGC300 has a simple exponential profile extending out to scalelengths (Type I), Ferguson et al. (2007) argue that M33 is best described as a broken exponential with a down-bending break (Type II), and Ibata et al. (2005) report that M31 could be described as having an antitruncated disc (Type III).
The physical processes that cause the different types of profile are not well understood. Some models suggest that Type II profiles (truncations) could be due to the effect of a star formation threshold in disc column density towards the edge of the disc (e.g. Kennicutt, 1989; Elmegreen & Parravano, 1994; Schaye, 2004). This theory may account for a sharp truncation (cut off), but does not explain observations of extended outer exponential components in some galaxies (e.g. Pohlen et al., 2002). Another theory has been proposed by Debattista et al. (2006) who find down-bending breaks in simulated disc profiles solely from collisionless N-body simulations. They suggest Type II galaxies are the consequence of a resonance phenomenon and a redistribution of angular momentum that leads to an increased central density and surface brightness. Many models now incorporate both these ideas and suggest that the inner disc forms as a consequence of the star formation threshold while the outer disc forms by the outward migration of stars from the inner disc to regions beyond the star formation threshold. This migration could be due to resonant scattering with spiral arms (Roškar et al. 2008a; Roškar et al. 2008b) or clump disruptions (Bournaud et al., 2007). Alternatively, another model is suggested by Foyle et al. (2008) who use simulations to show that by starting from a single exponential disc, the inner disc forms as the bulge draws mass from the inner regions. As a consequence the inner disc profile becomes shallower while the outer region stays almost unaffected. Less work has been carried out on the origin of Type III galaxies, but Younger et al. (2007) have shown that recent minor mergers could produce up-bending stellar profiles in the remnant galaxy.
However, all these models rely on the break in the surface brightness profile having an analogous break in the stellar surface mass density profile. Bakos et al. (2008) used colour profiles to calculate stellar mass surface density profiles for a sample of Type II and Type III galaxies identified by Pohlen & Trujillo (2006). Interestingly, for Type II galaxies they find the stellar mass surface density profiles are almost purely exponential. Therefore, the break in the surface brightness profile is not necessarily related to a break in the stellar mass surface density profile. Consequently, the surface brightness break may not be due to the distribution of stellar mass but could be due to a radial change in the stellar population. For Type III galaxies however, they do find an analogous break in the stellar surface mass density profile indicating these breaks could be due to the stellar mass distribution.
Investigating the frequency of profile types in different galaxy environments will provide evidence for their origin and the effect of the environment on the outer stellar disc. Presently, there have been few systematic searches for stellar disc truncations in spiral galaxies in either the local (Pohlen & Trujillo, 2006) or distant Universe (Trujillo & Pohlen, 2005; Azzollini et al., 2008). Pohlen & Trujillo (2006) use a sample of face-on to intermediate inclined nearby late-type (Sb-Sdm) spiral galaxies from the Sloan Digital Sky Survey (SDSS; York et al., 2000) and find that approximately per cent are Type I, per cent are Type II and per cent are Type III. They also report that the shape of the profiles correlate with Hubble type. In their sample down-bending breaks are more frequent in later Hubble types while the fraction of up-bending breaks rises towards earlier types. They also find no relation between the galaxy environment, as determined by the number of nearest neighbours, and the shape of the surface brightness profile. However, they do not reach very dense environments and low number statistics did not allow for major conclusions. Azzollini et al. (2008) recently conducted the largest systematic search for stellar disc truncations yet undertaken at intermediate redshift () using the Great Observatories Origins Deep Survey (GOODS; Giavalisco et al., 2004) south field. They use a sample of galaxies and obtain the frequency of profile types in different redshift ranges. They find that the frequency of profile types (Type I:II:III) is :: per cent for , and does not vary significantly with redshift out to .
The aim of this paper is to undertake a systematic search for broken exponentials in the field and cluster environment using the Space Telescope A901/2 Galaxy Evolution Survey (STAGES; Gray et al., 2009) and to investigate whether the galaxy environment has an effect on the stellar distribution in the outer stellar disc. We investigate whether the type and strength of radial profile breaks in the outer stellar discs of spiral galaxies is dependent on the galaxy environment. This work builds on previous studies by using larger and more statistically viable field and cluster samples and by reaching higher density environments. However, it is important to note that STAGES only covers an intermediate density environment (projected galaxy number density up to , Heiderman et al. 2009) and not a high density environment (e.g. the COMA cluster, , The & White 1986). We also wish to point out that in this work we use a slightly different profile classification scheme to that used by Pohlen & Trujillo (2006) and Azzollini et al. (2008), see Section 4.3. Therefore, direct comparisons of the results of this work to the previous works mentioned above cannot be made.
The structure of this paper is as follows: in Section 2 we give a brief description of the STAGES dataset relevant to this work and outline our sample selection in Section 2.1. In Section 3 we describe the method used to obtain our radial surface brightness profiles from the STAGES Hubble Space Telescope (HST)/Advanced Camera for Surveys (ACS) -band imaging and explain our profile classification scheme in Section 4. We present our results in Section 5 and finally draw our conclusions in Section 6. Throughout this paper, we adopt a cosmology of , , and , and use AB magnitudes unless stated otherwise.
2 Description of the data
This work is entirely based on the STAGES data published by Gray et al. (2009). STAGES is a multiwavelength survey that covers a wide range of galaxy environments. A complex multicluster system at has been the subject of -band (F606W) HST/ACS imaging covering the full () span of the multicluster system. The ACS imaging is complemented by photometric redshifts and observed-/rest-frame spectral energy distributions (SEDs) from the 17-band COMBO-17 photometric redshift survey (Wolf et al., 2003). Extensive multiwavelength observations using Spitzer, Galaxy Evolution Explorer (GALEX), 2 degree Field (2dF), XMM-Newton, and the Giant Metrewave Radio Telescope (GMRT) have also been carried out. Gray et al. (2009) have performed Sérsic profile fitting using the galfit code (Peng et al., 2002) on all HST/ACS images and conducted simulations to quantify the completeness of the survey, all of which are publicly available111http://www.nottingham.ac.uk/astronomy/stages.
The COMBO-17 observations used in the STAGES master catalogue were obtained with the Wide Field Imager (WFI) at the Max Planck Gesellschaft/European Southern Observatory (ESO) 2.2-m telescope on La Silla, Chile (see Wolf et al. 2003 for further details). COMBO-17 used five broad-band filters UBVRI and 12 medium-band filters covering wavelengths from – to define detailed optical SEDs for objects with , with being the total Vega -band magnitude. Generally, photometric redshifts from COMBO-17 are accurate to per cent in at which has been spectroscopically confirmed. Photo- quality degrades for progressively fainter galaxies reaching accuracies of per cent for galaxies with and per cent for galaxies with (Wolf et al., 2004, 2008). To date, all galaxy evolution studies on the COMBO-17 data that use photo- defined galaxy samples restrict themselves to galaxies with to ensure only reliable redshifts are used. Stellar mass estimates derived from SED fitting the 17-band photometry are also available for COMBO-17 galaxies (Borch et al., 2006; Gray et al., 2009).
The STAGES morphological catalogue (Gray et al. in prep.) contains 5090 galaxies in STAGES with reliable Hubble type morphologies. All galaxies with and were visually classified by seven members of the STAGES team into the Hubble types (E, S0, Sa, Sb, Sc, Sd, Irr) and their intermediate classes. S0s were defined to be disc galaxies with a visible bulge but no spiral arms (smooth disc). Spiral galaxies have visible spiral arms in the disc and the classification (Sa–Sd) represents a decreasing sequence in the bulge-to-disc () ratio. Weighted average estimates of the Hubble types, ignoring bars and degrees of asymmetry were generated. In this paper, we only consider visually classified spiral galaxies (Sa, Sb, Sc, Sd) and intermediate spiral classes are grouped to the earlier Hubble type (e.g. Sab are considered to be Sa).
2.1 Sample selection
Gray et al. (2009) suggest a cluster sample for STAGES defined solely from photometric redshifts. The photo- distribution of cluster galaxies was assumed to follow a Gaussian, while the field distribution was assumed to be consistent with the average galaxy counts outside the cluster and to vary smoothly with redshift and magnitude. The cluster sample is defined by a redshift interval , where the half-width was allowed to vary with -magnitude. A narrow redshift range is adopted for bright -magnitudes due to the high precision of COMBO-17 photometric redshifts, but the interval increases in width towards fainter -magnitudes to accommodate for the increase in photo- error. The completeness and contamination of the cluster sample at all magnitude points was calculated using the counts of the smooth models (see Fig. 14 from Gray et al., 2009) and the photo- half-width compromised so the completeness was per cent at any magnitude. Contamination ( per cent) is defined to be the fraction of field galaxies in the cluster sample at a given magnitude (and not below it). The half-width as a function of magnitude is
| (1) |
This equation defines a photo- half-width that is limited to 0.015 at bright -magnitudes but increases as a constant multiple of the estimated photo- error at the faint end. The completeness of this selection converges to nearly per cent for bright galaxies; see Gray et al. (2009) for further details. The catalogue published by Gray et al. (2009) contains a number of flags (combo_flag, phot_flag, stages_flag) that allows the selection of various galaxy samples. In this study, we use a similar sample selection to that used by Maltby et al. (2010).
For our cluster sample we use the above cluster definition (combo_flag ), we also only use galaxies with reliable photometry (i.e. those with phot_flag ), and those defined as extended HST sources in STAGES (stages_flag ). We also limit our sample by stellar mass, cutting at , and only select galaxies with visually classified Hubble-type morphologies in the range Sa-Sdm using the STAGES morphological catalogue (Gray et al. in preparation). This cluster spiral galaxy sample contains galaxies.
For our field sample we use COMBO-17 defined galaxies (combo_flag ) and apply a redshift selection that avoids the cluster. We include a lower redshift interval at and an upper redshift interval at , based on a similar sample selection used by Wolf et al. (2009). We also only use galaxies with reliable photometry (i.e. those with phot_flag ), and those defined as extended HST sources in STAGES (stages_flag ). We also limit our sample by stellar mass, cutting at , and only select galaxies with visually classified Hubble-type morphologies in the range Sa-Sdm using the STAGES morphological catalogue (Gray et al. in preparation). This field spiral galaxy sample contains galaxies.
The catalogue published by Gray et al. (2009) contains two sets of derived values for properties such as magnitude and stellar mass, one based on the photo- estimate and another assuming the galaxy is located at the cluster redshift of . This prevents the propagation of photo- errors into physical values. Here we use the fixed redshift set of values for the cluster sample, but the original estimates for our field comparison sample.
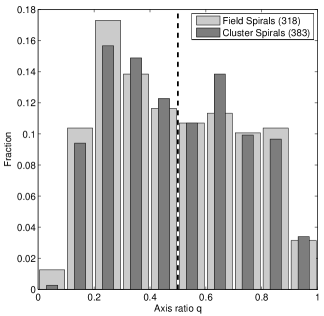
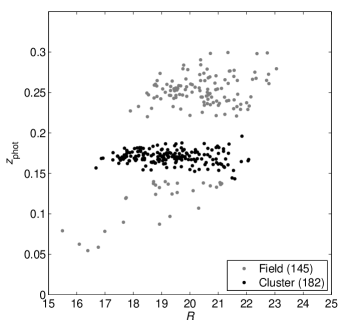
The field and cluster samples are also restricted by galaxy inclination to select face-on to intermediately inclined spiral galaxies by using the axis ratio of the galaxy as determined by the STAGES galfit models (Gray et al., 2009). The minor-to-major axis ratio (, where and are the semi-major and semi-minor axes respectively and is the ellipticity) is restricted to correspond to an inclination of less than 60 degrees ( or ). This cut is necessary to avoid the influence of dust on our surface brightness profiles and allows reliable information on features like bars, rings, and spiral structure. The distribution of axis ratio for our field and cluster spiral samples showing the axis ratio cut is shown in Fig. 1. This cut removes per cent of field spirals and per cent of cluster spirals from our samples. The final cluster sample contains spiral galaxies reaching down to and has a photo- range of . The final field sample contains spiral galaxies reaching down to (see Fig. 2). The morphological mix (Sa, Sb, Sc, Sd) of the final field and cluster spiral samples are shown in Fig. 3.

STAGES is per cent complete for (Gray et al., 2009) as is the case for our field and cluster galaxy samples (see Fig. 2). However, Wolf et al. (2009) estimate that at stellar masses below , the field sample could have an additional per cent incompleteness based on previous COMBO-17 experience. Therefore, our field sample is essentially per cent complete. We expect the completeness of the cluster sample to be per cent and the contamination of the cluster sample by the field to be per cent, based on the -magnitude the respective samples reach (see Fig. 14 from Gray et al., 2009). Selecting spiral galaxies from the STAGES morphological catalogue (Gray et al. in prep) introduces no further incompleteness to the galaxy samples (Maltby et al., 2010). The properties of the final field and cluster spiral samples are shown in Table. 1.
| Property | Field | Cluster |
|---|---|---|
| per cent | per cent | |
| per cent | ||
3 Profile fitting
We use the IRAF task ellipse (STSDAS package - version 2.12.2) in order to obtain azimuthally averaged radial surface brightness profiles from the STAGES HST/ACS -band imaging. Profile fitting is carried out for each spiral galaxy in our field and cluster samples. The ACS images used include the sky background and the necessary sky subtraction is performed after the profile fitting (see Section 3.2). For further details on the fitting method used by ellipse see Jedrzejewski (1987).
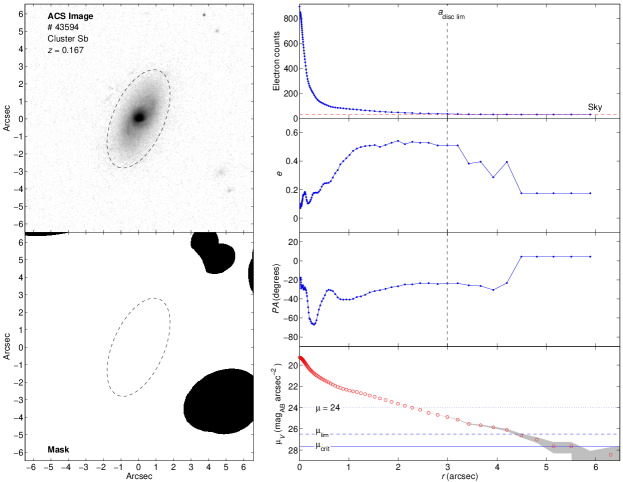
We run ellipse using bad pixel masks that remove flagged pixels from the isophotal fit. This is necessary in order to remove sources of contamination such as background/companion galaxies and foreground stars (everything not associated with the galaxy itself), see Fig. 4 for an example. Gray et al. (2009) generated these bad pixel masks for each STAGES galaxy using the data pipeline galapagos (Galaxy Analysis over Large Areas: Parameter Assessment by galfitting Objects from SExtractor; Barden et al., in prep). galapagos performs an extraction of source galaxies from the STAGES HST/ACS -band imaging and uses the galfit code (Peng et al., 2002) to fit Sérsic (1968) radial surface brightness models to each galaxy image. The bad pixel masks are generated for each STAGES galaxy in order to remove sources of contamination from these surface brightness models. However, occasionally in crowded regions galfit performs multiobject fitting and therefore the companion galaxies in these cases are not removed by the bad pixel mask as they are too close to the subject galaxy. In these cases ( field and cluster galaxies, per cent) the companion galaxies are removed from the ACS image by subtraction of their galfit surface brightness model. The residuals of the companion galaxies are not expected to have any significant affect on the azimuthally averaged radial surface brightness profile for the subject galaxy. Isophotal fitting is only attempted when the fraction of flagged (masked) data points in the isophote is less than and fitting is terminated if this condition is broken.
For all our ellipse isophotal fits the galaxy centre is fixed (all isophotes have a common centre) using the centre of the galaxy determined from the galfit Sérsic model (Gray et al., 2009). We also use logarithmic radial sampling with steps of dex ( geometric sampling in ellipse terminology) and start from an initial semi-major axis of pixels.
For each galaxy in our sample we fit two different sets of ellipses to the galaxy ACS image. The first is a free-parameter fit (fixed centre, free ellipticity and position angle ) and tends to follow morphological features like bars and spiral arms, and therefore is not ideal for the characterisation of the underlying outer stellar disc studied in this paper. Therefore, we use a fixed-parameter fit (fixed centre, , and ) in order to produce our final surface brightness profiles.
The initial free-parameter fit (fixed centre, free and ) is used to determine the ellipticity and position angle of the outer disc component. For each sample galaxy the ACS image was inspected with the contrast adjusted in order to get an estimate of the semi-major axis for the end of the stellar disc (where the galaxy surface brightness enters the background noise). This ‘stellar disc limit’ corresponds to the outer stellar disc region and is used to obtain the ellipticity and position angle of the outer stellar disc, and respectively, from the ellipse free-fit and radial profiles (see Fig. 4). Fig. 4 shows the fitting procedure for an example galaxy.
In some cases the fit failed at the stellar disc limit due to ellipse error limits in the radial intensity gradient. However, adjusting this threshold allowed these fits to be forced out to . In order to ensure that the ellipticity and position angle of the outer stellar disc are reliable, we compared the values obtained from the ellipse fit to a manual measurement of and measured directly off the ACS image during the visual inspection. The ellipse values agreed with the visually measured values in all cases.
However, in some cases the ellipse radial and profiles could be unstable at the stellar disc limit . In these cases, field ( per cent) and cluster galaxies ( per cent), we use the last reliable and obtained from the ellipse profiles as our estimate of and for the outer stellar disc.
In some other cases the free-fit failed completely at . Subsequent inspection of the ACS image sometimes revealed clear structure at . In these cases, field ( per cent) and cluster galaxies ( per cent), we use the estimate of and measured directly off the ACS image as our estimate of and for the outer stellar disc. Unfortunately, in a few cases the ACS image was too noisy for a reliable manual measurement of and . In these cases, field ( per cent) and cluster galaxies ( per cent), we use the value of the and determined by galfit in the STAGES Sérsic models (Gray et al., 2009) as our estimate of and for the outer stellar disc.
A fixed-parameter fit (fixed centre, , and ) using the and of the outer stellar disc obtained from the free-fit is then used to produce our final surface brightness profiles (see Fig. 4). The fixed fits are forced to extend out well into the sky background (semi-major axis of pixels). During the fixed-fitting process we also perform 4 iterations of a rejection applied to deviant points below and above the average to smooth some of the bumps in the surface brightness profiles that are due to non-axisymmetric features, i.e. not part of the disc (e.g. star-forming regions and supernovae). The final profile fits then undergo a sky subtraction and surface brightness calibration in order to produce the final surface brightness profiles which will be discussed in the following sections.
3.1 Photometric calibration
The STAGES HST/ACS -band images have pixel values in units of electrons . These can be converted to AB magnitudes per pixel using the following expression,
| (2) |
where the AB zeropoint
| (3) |
The following FITS header keywords are used (ACS Datahandbook v5.0222Pavlovsky, C., et al. 2004, ”ACS Data Handbook”, Version 3.0, (Baltimore: STScI)),
The effective exposure time (after ACS subpixel drizzling) varies for each sample galaxy and is between –. The AB magnitude for each pixel is then converted into a surface brightness using the ACS pixel scale (),
| (4) |
This gives a surface brightness per pixel in in the -band.
Several corrections are also required in order to correct the surface brightness for galactic extinction, individual galaxy inclination , and surface brightness dimming.
-
1.
Galactic extinction: The STAGES field is affected by reddening due to substantial foreground dust (galactic extinction, see Gray et al., 2009) and an extinction correction of magnitudes in the -band is required.
-
2.
Galaxy inclination: The surface brightness of a spiral galaxy increases with its inclination to the line of sight. We correct for galaxy inclination using the surface brightness correction , where is the ellipticity of the outer isophote (Freeman, 1970). We use the ellipticity determined for the fixed-fit (outer isophote) to correct for galaxy inclination . We do not attempt to correct the surface brightness for internal extinction (dust effects). However, since the galaxies studied here are all reasonably face-on (, ), and as we are dealing with the outer parts of the galactic disc, dust is expected to have very little effect on the surface brightness correction and no effect on the presence or strength of truncations/anti-truncations in the stellar disc.
-
3.
Surface brightness dimming: We correct the surface brightness profiles of our field galaxies so they are at the redshift of the cluster (). This allows a fair comparison between galaxies across the redshift range of our sample. All cluster member galaxies are assumed to be at the cluster spectroscopic redshift. Surface brightness for bolometric luminosity; however as we use the -band (F606W) filter (effective filter width dependent on ) we loose a term from this relation and . Therefore, correcting the of our field galaxies requires multiplying the galaxy flux (in electrons ) by , where is the photometric redshift of the field galaxy from COMBO-17. This leads to a surface brightness correction for our field galaxies where
(5) Therefore, the final surface brightness corrected for galactic extinction, galaxy inclination , and surface brightness dimming is given by
(6)
3.2 Sky subtraction
During the galfit Sérsic model fitting performed by the galapagos pipeline (Gray et al., 2009), the sky level is calculated individually for each source galaxy by evaluating a flux growth curve and using the full science frame. In this paper, for each sample galaxy we use the sky level determined by galapagos for our sky subtraction. Fig. 4 includes the free-fit radial intensity profile (in electron counts ) for an example galaxy showing the sky background determined by galapagos.
The error in the galapagos sky level was estimated using observed ‘dark’ patches of sky located in some of the STAGES ACS tiles (tiles , , , and , see Gray et al., 2009). Each patch (measuring pixels) was visually inspected to ensure it was clear of any -band sources. The distribution of electron counts (pixel values) in each dark patch is Gaussian in all cases. For each ACS tile we obtain the mean pixel value in each dark patch of sky and then the standard deviation in the mean pixel values , see Table 2. The distribution of mean pixel values is approximately Gaussian for each tile. The final sky error is the mean from the 4 selected ACS tiles and is electron counts, see Table 2.
| STAGES tile | (electron counts) | |
|---|---|---|
| sky error = Mean | ||
The sky subtraction error in the surface brightness profiles due to the error in the galapagos sky background dominates over the individual errors produced by ellipse in the fitting process. At the fit error dominates over the error in the sky subtraction but has a negligible effect on the surface brightness profile. However, at the sky subtraction error dominates the error in the surface brightness profile. The sky subtraction error can have a significant effect on the surface brightness profile of the spiral galaxies, especially in the outer regions where the surface brightness approaches that of the sky background. However, for any particular galaxy the global sky subtraction error is approximately constant across the length of the surface brightness profile. Therefore we can specify the error in our surface brightness profiles by generating profiles for when the sky background is over- and undersubtracted by (see Fig. 4).
The error in the sky background corresponds to a critical surface brightness limit below which the sky subtracted radial surface brightness profile of a galaxy becomes unreliable. This critical surface brightness is approximately . We also define a limiting surface brightness , corresponding to a sky error, below which identifying profile breaks becomes unreliable. The limiting surface brightness is approximately .
4 Profile classification
4.1 Profile inspection
The azimuthally averaged radial surface brightness profile for each spiral galaxy in our field and cluster samples was visually inspected by three independent assessors (DTM, AAS, MEG) in order to identify potential profile breaks (inflection points in the exponential region of the profile). Three possible cases were considered: no break or simple exponential profile, a single broken exponential, and cases with two profile breaks. In each case, break identification relates to the outer disc component of the galaxy radial surface brightness profile and does not consider the inner varying bulge component.
Our break identification is based solely on the surface brightness profiles and without direct inspection of the ACS images. We chose not to relate the profile breaks to visually identified structural features because we wanted a break classification method that treated all galaxies equally, in a self-consistent manner, and avoided the prejudice that image inspection could introduce. Additionally, the aims of this work are to explore the effect of the environment on the structure of the outer regions of the galactic disc, regardless of the origins of any identified structural features.
The radial limits of exponential regions either side of the break radius were also identified allowing for some bumps and wiggles due to spiral substructure (e.g. spiral arms and star forming regions). For the inner exponential disc, the inner boundary is chosen manually to avoid the region dominated by the bulge component. For the outer exponential disc, the outer boundary is generally taken to be where the surface brightness profile reaches the critical surface brightness ( above the sky background) but may be at higher depending on the nature of the profile. A small manually selected transition region (non-exponential) is allowed between exponential regions either side of the break. The break radius is defined as the mean radius for the radial limits of this transition region.
Due to the subjective nature of some galaxy profile classifications, the number of galaxies with either no, one, or two breaks varied subtly between the different assessors. To account for this, in what follows we perform parallel analysis on the breaks identified by each assessor and compare the final results.
4.2 Defining the Outer Stellar Disc
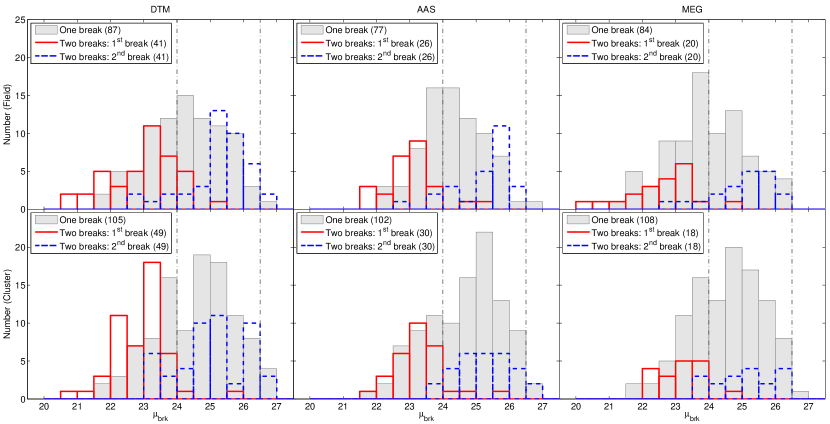
In this study, we wish to consider the effect of the galaxy environment on the outer regions of the stellar disc for spiral galaxies. Therefore, we only wish to consider broken exponentials in the outer disc region of the profile. Any effect of the environment should be stronger in these faint, fragile, outer regions. Fig. 5 shows the surface brightness at the break radius for galaxies with one, and two breaks. In the case of one break, for each assessor there appears to be a slight difference in the distribution of between the field and cluster samples with cluster breaks occurring at fainter surface brightnesses. Kolmogorov-Smirnov (K–S) tests between the respective field and cluster samples show that this environmental difference is driven by Type (up-bending break, antitruncated) profiles with a significance at the – level. We offer no interpretation of this result due to its uncertain nature. In the case of two inflection points, we consider the inner and outer breaks separately and the separation between the inner and outer break occurs at a surface brightness (see Fig. 5). The same conclusion is reached for the break samples generated by each assessor. Inner and outer breaks may have different physical origins. Therefore, in order to ensure we are comparing intrinsically similar breaks in the stellar disc, we limit the breaks analysed to those with (outer disc breaks) and to the outermost break if two inflection points are present in this range. There may be break features at surface brightnesses , and these may be related to the galaxy environment. However, we focus on breaks in the outer disc as these are more likely to be susceptible to environmental effects. We acknowledge that in doing this there is some potential for missed environmental effects in the inner disc, therefore we do include some additional tests using the inner/initial break, see Section 5.4.
In Section 3.2 we defined a limiting surface brightness ( sky error) of . In our analysis we do not trust breaks at fainter than the level as this is where identification of breaks becomes unreliable due to the deviation of the profiles generated by over- and undersubtracting the sky by (see Fig. 4). We therefore also restrict our analysis to profile breaks that have .
4.3 Profile Types
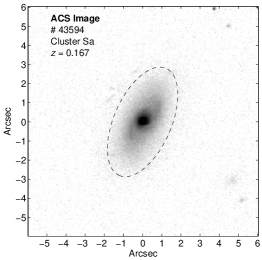
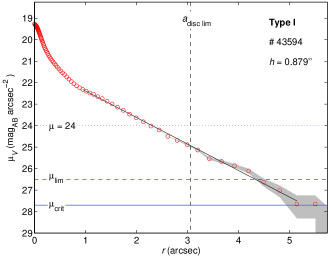
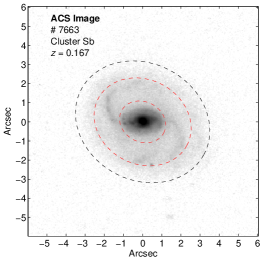
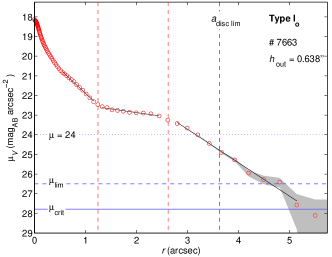
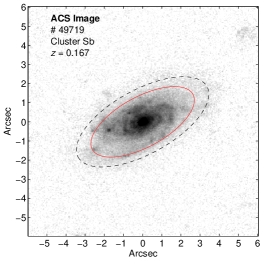
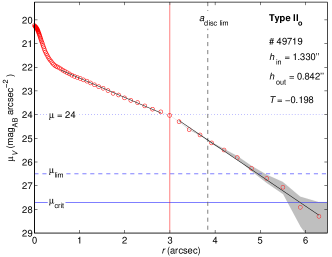
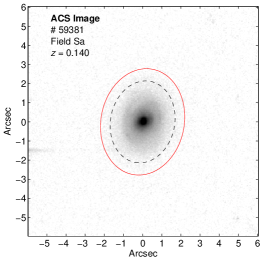
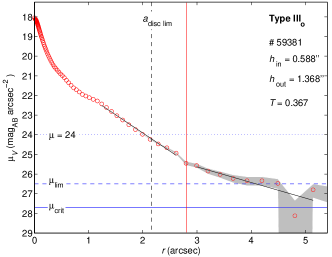
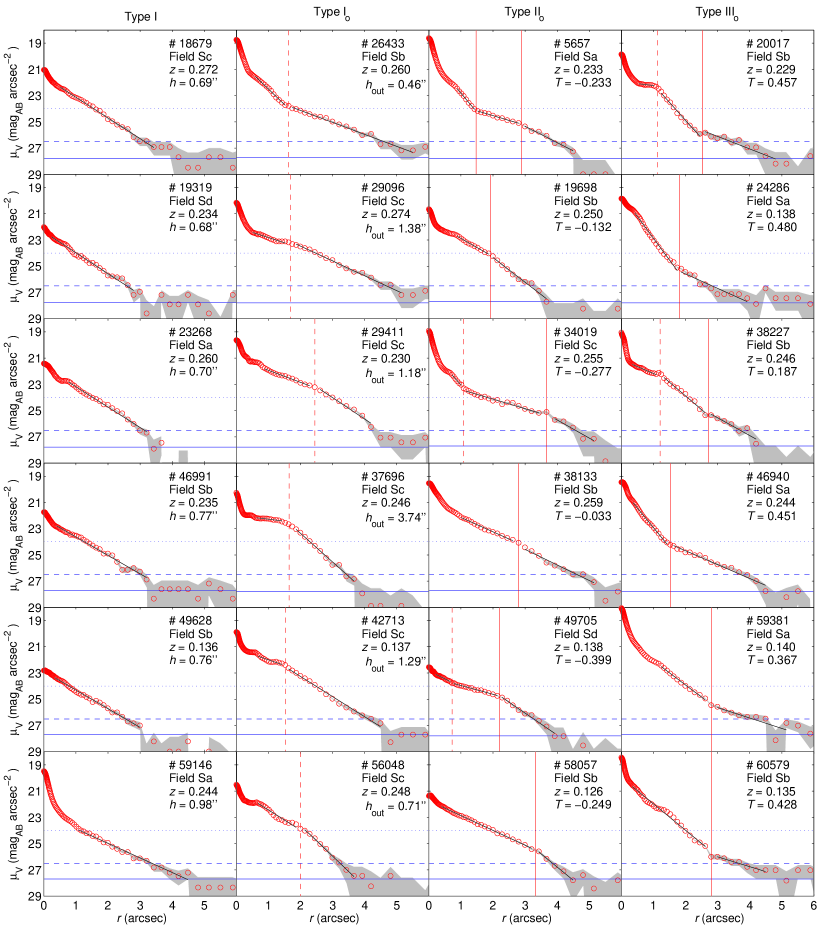
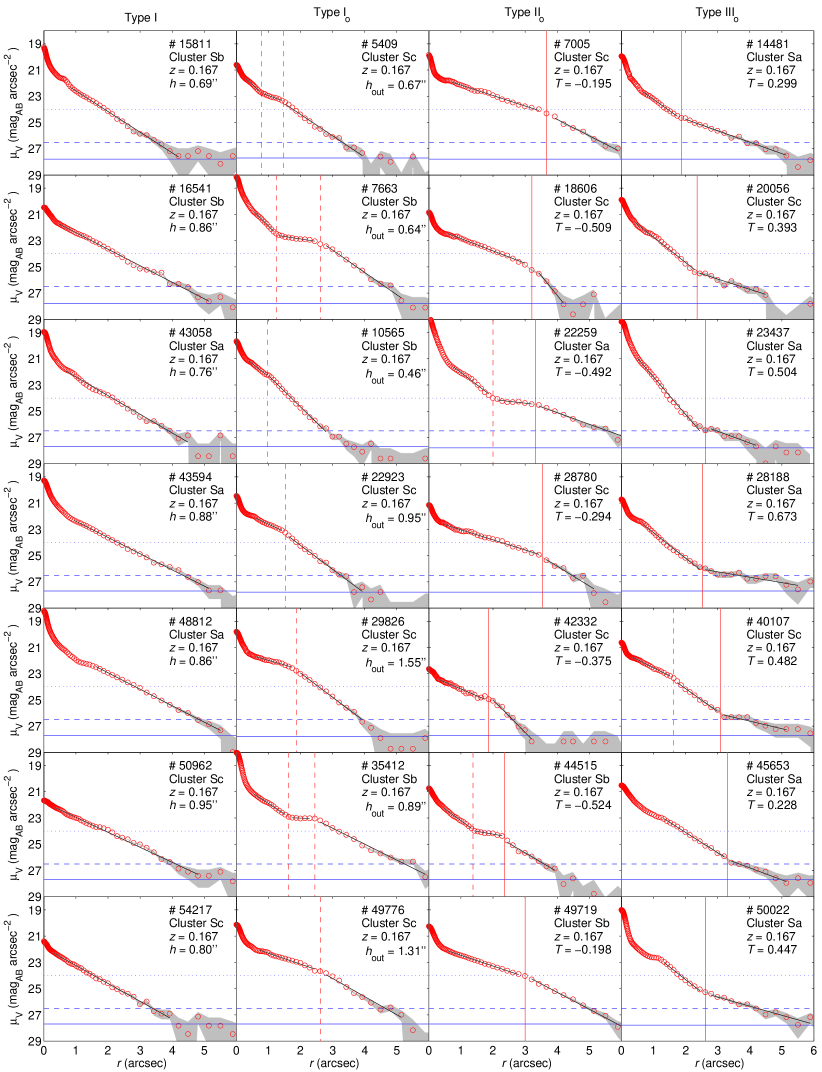
We classify our galaxies into three main types, those classified to be Type , Type , or Type depending on break features in their outer stellar disc (o - outer, ) only. The classification used assumes only one break in the outer disc. If two breaks are present the outer break is used for classification. This is only the case for ( per cent) field galaxies. If the profile has no break in the outer disc then the galaxy has a simple exponential outer disc and is classified as Type . Galaxies that are pure exponentials across the length of their surface brightness profile, aside from the varying bulge component (Type 1, a subset of Type ), are also identified. If the profile has a down-break in their outer profile then the galaxy has a truncation in the outer disc and is classified as Type . However, if the profile has an up-break then the galaxy has an antitruncation in the outer disc and is classified as Type . Examples of each profile type (Type I, , , and ) are shown in Fig. 6 along with their ACS images showing the break radius isophote. Please note that this classification scheme is different to that used by previous works (e.g. Pohlen & Trujillo, 2006).
4.4 Determining scalelengths and break strength
In the following, our exponential fits are obtained using a linear least-squares fit to the original profile between radii identified during the visual inspection (see Section 4.1).
For galaxies with no break in their outer disc (Type , pure exponentials) we obtain the scalelength using a simple exponential fit () across the length of the disc component. For bulgeless spiral galaxies with pure exponential discs (Type I Sd galaxies), the scalelength was confirmed to be compatible with the galfit effective radius (). The mean random error in scalelength due to the exponential fitting routine is per cent for these galaxies. The mean systematic error in the scalelength due to the error in the sky subtraction (see Section 3.2) is also per cent.
For galaxies where an outer disc profile break was identified (Type ), we obtain the scalelength h of exponential fits either side of the break radius , and therefore obtain an inner and outer exponential fit for the stellar disc. The inner exponential disc extends from a radius of to and has a scalelength given by
| (7) |
where is the surface brightness from the exponential fit. Similarly, the outer exponential disc extends from a radius of to and has a scalelength given by
| (8) |
For these galaxies, the mean random error in scalelength due to the exponential fitting routine is per cent for and per cent for . In order to measure the strength of the profile break we use the logarithm of the outer-to-inner scalelength ratio,
| (9) |
The mean random error in due to the exponential fitting routine is ( per cent). Fig. 7 shows the break strength plotted against the outer scalelength for Type galaxies (classified by DTM) with the errorbars in due to the sky subtraction error (see Section 3.2). The mean systematic error in due to the sky subtraction error is also .
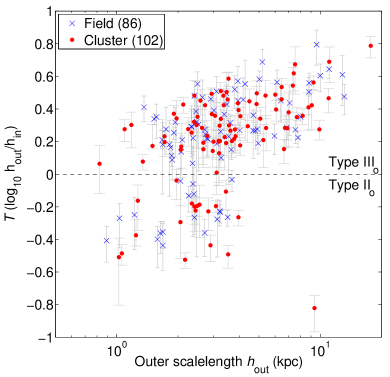
A Type /I galaxy (pure exponential) has no break, and therefore has a break strength of . A Type galaxy (down-bending break, truncation) has a smaller outer scalelength with respect to its inner scalelength , and therefore has a negative break strength (). Similarly, a Type galaxy (up-bending break, antitruncation) has a larger outer scalelength with respect to its inner scalelength , and therefore has a positive break strength (). We present a selection of our profiles with fitted exponential regions and overplotted break radii from both the field and cluster environments in Figs. 8 and 9 respectively. The ACS images and profiles for all galaxies in our samples are presented in Appendix A (online version only).
In the outer regions of the surface brightness profile, negative sky-subtracted flux can occur. Surface brightness cannot be defined for a negative flux. Therefore, these points are removed from our linear exponential fits to surface brightness. However, this could potentially lead to a slight measurement bias and a larger outer scalelength for some profiles. In order to address this issue we repeated all measurements of scalelength ( and ) and break strength using a non-linear least squares exponential fit to the flux radial profile (retaining negative fluxes). We then compared these results to those from the linear fits to surface brightness in order to assess if any measurement bias was present. The results from both fitting methods were in very good agreement and no bias was observed. Therefore, we use the linear fits to surface brightness in our analysis.
5 Results
The frequency of profile classifications by each assessor (DTM, AAS, MEG) for spiral galaxies in the field and cluster environments are shown in Table 3. In each case the profile classification is based on breaks in the outer stellar disc (). Uncertainty in the frequency/fraction of profile types () are calculated using
| (10) |
where and .
| Assessor | Type I | Outer disc profile types | Unclassified | ||
|---|---|---|---|---|---|
| Type | Type | Type | |||
| Field galaxies | |||||
| DTM | () | () | () | () | |
| AAS | () | () | () | () | |
| MEG | () | () | () | () | () |
| Cluster galaxies | |||||
| DTM | () | () | () | () | |
| AAS | () | () | () | () | () |
| MEG | () | () | () | () | () |
Due to the subjective nature of some profile classifications, the frequency obtained for each profile type varies subtly between the different assessors. The agreement between the three assessors is generally good for the outer disc profile types (Type , , and ). This agreement is very good in the cluster, but slightly weaker in the field due to most of the galaxies being at higher redshift and therefore having poorer quality profiles. There is less agreement between the three assessors for the frequency of Type I profiles (pure exponentials) due to the subjective nature of the classification of weak profile breaks across the length of the profile and inner profile breaks near the bulge component.
The frequency of profile types in the outer stellar disc (Type , , and ) are approximately the same in the field and cluster environment. For both field and cluster spirals, per cent have a simple exponential profile in the outer stellar disc (Type ), per cent exhibit a down-bending break (outer disc truncation, Type ), and per cent exhibit an up-bending break (outer disc antitruncation, Type ). The frequency of Type I profiles is also the same in the field and cluster for each assessor and is per cent. We stress that due to our profile classification being based on breaks with , our profile type fractions do not necessarily need to agree with those of previous works (e.g. Pohlen & Trujillo, 2006). For our cluster galaxies, we also investigated the frequency of outer disc profile types as a function of stellar surface mass density (range –, see Wolf et al. (2009) for details of how this was measured). However, no significant differences were observed. These results suggest that the profile type in the outer disc of spiral galaxies is not affected by the environment from the field out to the intermediate densities of the A901/2 clusters.
In this work, we define the outer disc to be , see Section 4.2. Our outer disc profile types are based on this somewhat arbitrary but justified definition. Independently and uniformly adjusting the upper and lower limits for the outer disc by affects our profile type fractions by per cent. In each case, there remains no significant differences between the fractions in the field and cluster environment.
The majority of our field sample have redshift while the cluster galaxies have . However, evolutionary effects are not expected to have an impact on the results of this work. The break strength of our field galaxies show no correlation with redshift and evolutionary effects on the scalelength between the mean redshifts of our field and cluster samples is only per cent (based on the fits of Buitrago et al. 2008 for the expected size evolution of massive disc galaxies).
5.1 Morphology
For each outer disc profile type (Type , , and ), we compare the morphological mix (Sa, Sb, Sc, Sd) in the field and cluster environment to that of the total spiral galaxy sample (see Fig. 10). We also considered whether or not the galaxies were barred.
The morphological mix of the total galaxy sample is approximately the same in the field and cluster, with perhaps a slight excess of Sa galaxies in the cluster environment (Sa galaxies are visually defined to have a high bulge-to-disc () ratio, see Section 2). This excess is dominated by barred Sa galaxies. For each outer disc profile type (Type , , and ), the morphological mix is also approximately the same in the field and cluster environment. However, there is a potential slight excess of Sa galaxies in the cluster for both Type and galaxies. In both cases the excess is dominated by barred Sa galaxies. Except for the slight excess of barred Sa galaxies in the cluster, the morphological mix for barred and unbarred galaxies are the same in the field and cluster for each profile type.
The morphological mix of Type galaxies is comparable to that of the total galaxy sample. This implies that Type galaxies are equally probable for all morphological types. For Type galaxies, the morphological mix fractions are affected by low number statistics. However, there is a clear trend with the Hubble type fraction (Sa–Sc) rising towards later Hubble types. For Type galaxies, the morphological mix is also comparable to that of the total galaxy sample. There is also a clear trend with the Hubble type fraction (Sa–Sd) decreasing towards later Hubble types.
We conclude that outer disc truncations (Type ) are more prevalent in later Hubble types while outer disc antitruncations (Type ) are more prevalent in early Hubble types. However, there is no evidence to suggest the morphological mix for the different outer disc profile types is affected by the galaxy environment.
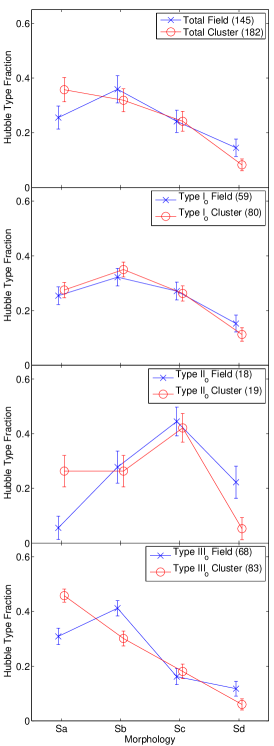
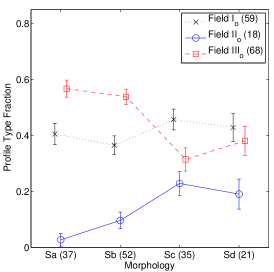
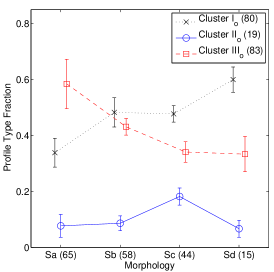
We also compare the frequency of outer disc profile types (Type , , and ) for different Hubble type morphologies (Sa, Sb, Sc, Sd) in both the field and cluster environment (see Fig. 11). For Type galaxies, we observe no clear correlation between the frequency of profile type and the Hubble type in both the field and cluster environment. The frequency of Type galaxies is approximately the same for each Hubble type morphology, perhaps raising slightly towards later Hubble types in the cluster environment. For Type and Type galaxies, a weak trend is observed between the frequency of profile type and the Hubble type in both the field and cluster environments. The frequency of Type galaxies increases slightly towards later Hubble types while the frequency of Type galaxies decreases. For Sd galaxies, low number statistics could be masking the continuation of these trends. These results are in qualitative agreement with the work of Pohlen & Trujillo (2006) who find a clear correlation between the frequency of profile type and Hubble type using a sample of nearby galaxies from SDSS (classification based on breaks across the entire stellar disc so direct comparisons cannot be made). We conclude that there is no significant difference between the frequency of outer disc profile types for different Hubble type morphologies in the field and cluster environments.
5.2 Pure exponential outer discs (Type )
For galaxies where no outer disc break was identified (Type galaxies, which include all Type I galaxies), we compare the outer scalelength distributions in the field and cluster environments to see if there is any evidence for an environmental dependence on outer scalelength (see Fig. 12). The outer scalelengths for these Type galaxies were transformed into intrinsic linear scales using a cosmology of , , and . We use the fixed cluster redshift () to determine the intrinsic outer scalelengths of our cluster Type galaxies and the original COMBO-17 redshift estimate for our field Type galaxies. Therefore, photo- errors only propagate into the intrinsic scalelengths of our field galaxies and not our cluster galaxies. The mean error in associated with the photo- error is per cent (Maltby et al., 2010).
In our surface brightness profiles, the error in the galapagos sky (see Section 3.2) can have a significant effect on the scalelength and break strength , especially in the outer regions where the surface brightness approaches the critical surface brightness (). However, for any particular galaxy the sky subtraction error can be taken to be approximately constant across the length of the surface brightness profile. Therefore, we can account for this error by performing parallel analysis for when the sky background is over- and undersubtracted by . The mean error in due to the sky subtraction error is ( per cent) for our Type galaxies. Random errors in due to exponential fitting are also typically per cent (see Section 4.4). We also perform parallel analysis on the Type samples generated by the three assessors (DTM, AAS, MEG) in order to account for the subjective nature of the profile classifications and compare the final results.
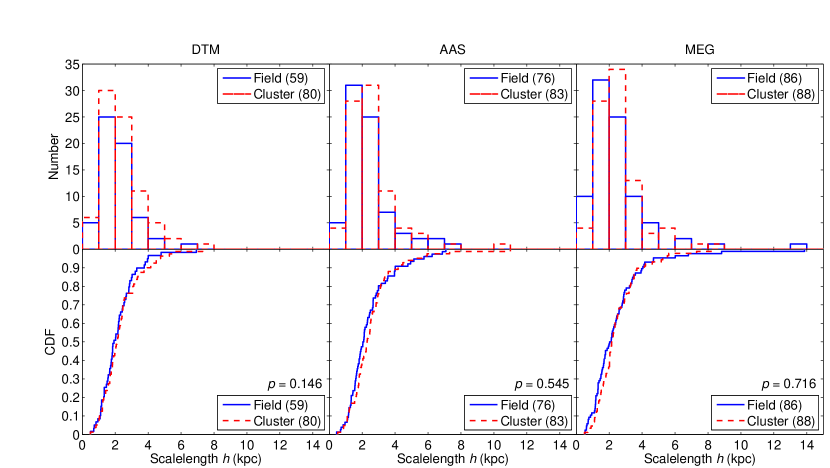
In all cases (all parallel analyses), we observe no clear difference between the distributions of outer disc scalelength for our Type spiral galaxies in the field and cluster environments (see Fig. 12).
In order to test the significance of these results we construct outer disc scalelength cumulative distribution functions (CDFs, see Fig 12) for the Type galaxy samples and perform Kolmogorov–Smirnov (K–S) tests between corresponding samples from the field and cluster environments. These K–S tests are used in order to obtain the probability that the field and cluster Type samples are not drawn from the same continuous distributions. The results of these K–S tests are shown in Table 4.
In this work, we only consider an environmental effect on the Type outer scalelength to be significant if K–S tests yield a level probability for the field and cluster Type galaxy samples not being drawn from the same continuous distributions. This probability is below the level for each assessor and for when the sky background is over- and undersubtracted by . Therefore, we find no evidence to suggest that the outer disc scalelength of Type galaxies is dependent on the galaxy environment.
We perform the same analysis for Type I galaxies, a sub-sample of Type galaxies. These galaxies have simple exponential profiles across the length of their disc component. The K–S test results for these galaxies are shown in Table 4. The probability is below the level in each case. Therefore, we also find no evidence to suggest that the scalelength of Type I galaxies is dependent on the galaxy environment.
5.3 Outer disc breaks (Type )
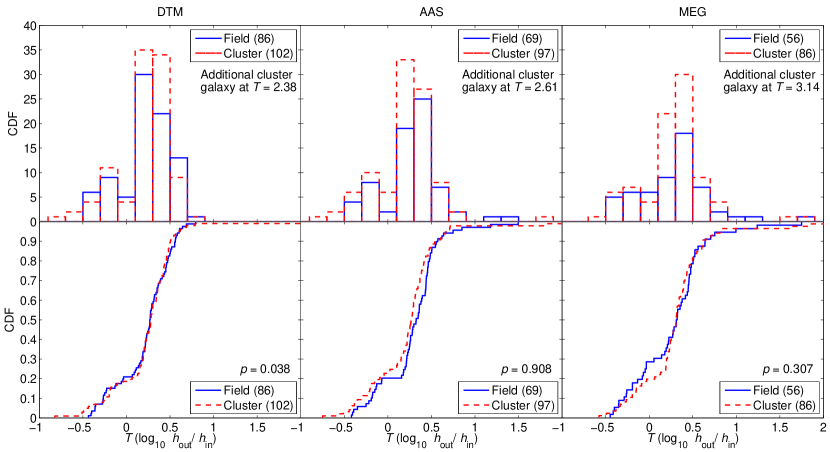
For our Type and galaxies, we compare the distribution of break strength in the field and cluster environments to see if there is any evidence for an environmental dependence on break strength in the outer disc (see Fig. 13). We perform similar parallel analyses and statistical tests as for our Type galaxies. The mean error in due to the sky subtraction error is . Random errors in due to exponential fitting are also typically (see Section 4.4). The results of the K–S tests are shown in Table 4.
In all cases (all assessor samples and sky versions), we observe no clear difference between the distributions in the field and cluster environments. The probability is below the level in each case. Therefore, we find no evidence to suggest that the break strength of our Type galaxies is dependent on the galaxy environment and this result is robust to the error in the sky background and the subjective nature of the profile classifications.
We explore this result by splitting the combined field and cluster Type galaxy sample into two sub-samples about the median value for stellar mass (). Similar statistical tests are then used to determine the significance of an environmental dependence independently for high- () and low-mass () Type galaxies. A similar test was also performed using colour instead of stellar mass where and were obtained from the STAGES master catalogue (Gray et al., 2009) and . In all cases (all assessor samples and sky versions), the significance of an environmental dependence on break strength remains below the level. Therefore, we conclude that there is no evidence to suggest an environmental dependence on break strength is dependent on either the stellar mass or the colour of Type galaxies.
Another test performed was a comparison of the break radius (in units of the galfit effective radius) in the field and cluster environments for both our Type () and Type () galaxies separately. In both cases, no significant difference () was observed between the break radius in the field and cluster environments. However, there is a slight indication that Type breaks occur at smaller break radii than Type breaks.
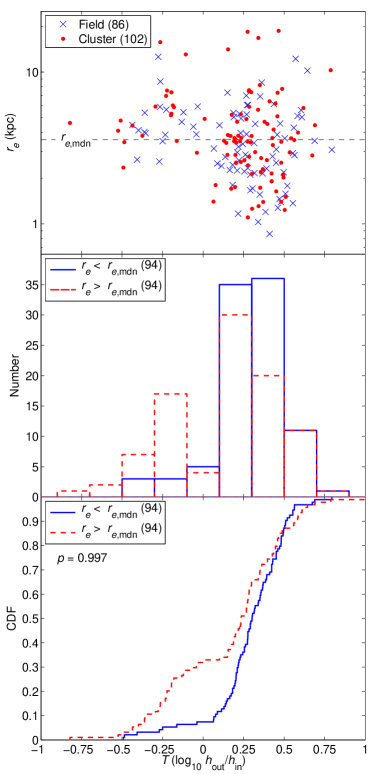
We also compare the break strength of our Type galaxies with the effective radius determined by the STAGES galfit Sérsic models (Gray et al., 2009) (see Fig. 14). The size–break-strength distribution is the same for both field and cluster galaxies. However, we note that at small effective radii () there is an absence of Type galaxies (outer disc truncations, ) in both the field and cluster environments. () is the median effective radius of the combined field and cluster Type galaxy sample. In contrast, there is an abundance of Type galaxies (outer disc antitruncations, ) reaching down to . A comparison of the break strength distributions for large- () and small- () galaxies shows a clear difference in the two distributions (see Fig. 14).
In order to test the significance of this result we construct break strength CDFs (see Fig. 14), for large- and small- Type galaxies and perform K–S tests between the large- and small- galaxy samples to obtain the probability the different samples are not drawn from the same continuous break strength distributions. Similar parallel analyses are also performed as in previous tests.
In all cases (all assessor samples and sky versions), the probability that the large- and small- galaxy samples (large-small-) are being drawn from different continuous break strength distributions is at the level. Therefore, we find some evidence to suggest that the break strength of Type galaxies is dependent on the galaxy effective radius . We offer no interpretation of this result.
5.4 Inner/initial disc breaks
The focus of this paper is on the effect of the environment on the structure of the outer regions of galactic discs. By examining only breaks in the outer disc (), we have tailored our analysis to allow for the assessment of an environmental effect on the outer regions of the galactic disc, where the environment is most likely to have an effect. However, we acknowledge that there is some potential for missed environmental effects in breaks at a higher surface brightness (). Therefore, in order to test whether we could have missed any environmental effect in the inner disc we repeated our analysis using the inner/initial break for profile classification. However, we find no correlations of the frequency of profile type with the galaxy environment. We also find no significant effect of the environment on either the scalelength of Type I galaxies (pure exponentials), or the break strength of inner/initial breaks.
| (Field/Cluster) | |||
|---|---|---|---|
| Sky subtraction | Under () | Nominal | Over () |
| Type I () | |||
| DTM | |||
| AAS | |||
| MEG | |||
| Type () | |||
| DTM | |||
| AAS | |||
| MEG | |||
| Type () | |||
| DTM | |||
| AAS | |||
| MEG | |||
6 Conclusions
We present an analysis of -band radial surface brightness profiles for spiral galaxies from the field and cluster environments using HST/ACS imaging and data from STAGES. Using a large, mass-limited (), visually classified sample of field and cluster spiral galaxies, we assess the effect of the galaxy environment on the radial surface brightness profile in the outer stellar disc ().
We classify our spiral galaxies according to break features in their outer disc. If the galaxy has no break in this range then the galaxy has a simple exponential profile in the outer disc and is classified as Type . Galaxies that have a simple exponential profile across the length of their disc component (Type I, a subset of Type ), are also identified. However, if the galaxy exhibits a broken exponential in the outer disc it is classified as either Type for a down-bending break (outer disc truncation) or Type for an up-bending break (outer disc antitruncation).
The frequency of outer disc profile types (Type , , and ) is approximately the same in both the field and cluster environment. For both field and cluster spirals, per cent have a simple exponential profile in the outer stellar disc (Type ), per cent exhibit a down-bending break (outer disc truncation, Type ), and per cent exhibit an up-bending break (outer disc antitruncation, Type ). These results imply that the shape of the outer disc surface brightness profile is not dependent on the galaxy environment. These results agree for break classifications performed by three independent assessors. We stress that due to our profile classification being based on breaks with , our profile type fractions do not necessarily need to agree with those of previous works (e.g. Pohlen & Trujillo, 2006).
We also find that the morphological mix (Sa, Sb, Sc, Sd) of the different outer disc profile types is the approximately same in the field and cluster environment. However, we do find a dependence of the shape of the profile in the outer stellar disc on the Hubble type. Outer disc truncations are slightly more frequent in later Hubble types while the outer disc antitruncations are slightly more frequent in earlier Hubble types. The same dependence is observed in both the field and the cluster environments. This result is in qualitative agreement with that of Pohlen & Trujillo (2006) who find a similar correlation using galaxies from SDSS (classification based on entire disc component so direct comparisons cannot be made).
For galaxies with a purely exponential outer stellar disc (Type , per cent), we find no evidence to suggest an environmental dependence on the outer disc scalelength . We also find no evidence for an environmental dependence on the scalelength for galaxies that have a pure exponential profile across the length of their disc component (Type I, a subset of Type ). For galaxies with a broken exponential in their outer stellar disc, either down-bending (Type , outer disc truncation, per cent) or up-bending (Type , outer disc antitruncation, per cent), we measure the break strength as the outer-to-inner scalelength ratio . We also find no evidence to suggest an environmental dependence on this break strength. We conclude that there is no evidence to suggest the stellar distribution in the outer stellar disc is affected by the galaxy environment for these galaxies. These results have been shown to be robust to the sky subtraction error and to agree for break classifications performed by three independent assessors. This work is in qualitative agreement with the work of Pohlen & Trujillo (2006) who come to a similar conclusion for a sample of spiral galaxies from SDSS (classification based on entire disc component).
We also find that for galaxies with small effective radii (), Type profiles (outer disc truncations) are rare in both the field and cluster environments. In contrast Type (outer disc antitruncations) are commonplace.
Our results suggest that the galaxy environment has no effect on the stellar distribution in the outer stellar disc of spiral galaxies from the field out to the intermediate densities of the A901/2 clusters. This implies that the origin of broken exponentials is related to an internal mechanism (e.g. star formation threshold, resonance phenomenon) or minor mergers. Our results are consistent with previous work carried out on the effect of the galaxy environment on disc features in the STAGES survey. Marinova et al. (2009) find that the optical fraction of bars among disc galaxies does not show evidence for any strong variation between the field and the A901/2 clusters, suggesting that the mass redistribution associated with bar formation within galactic discs is not a strong function of environment from the field out to intermediate densities. However, it is important to note that STAGES only covers an intermediate density environment (projected galaxy number density up to , Heiderman et al. 2009) and not a high density environment (e.g. the COMA cluster, , The & White 1986). Therefore, it is important to investigate the effect of the environment on the outer disc structure at higher densities (e.g. the COMA cluster).
The results presented here are for one survey field and one multicluster complex: therefore it is also important to investigate the environmental dependence of the outer disc structure of spiral galaxies in different surveys and across a wide redshift range. The results of such studies will enable the evolution of the outer disc to be investigated in different galaxy environments. Also the investigation into the origin of broken exponentials will depend on multiwavelength data being used to create colour profiles and stellar mass distributions. This will allow an assessment of whether the origin of broken exponentials is due to the distribution of stellar mass or a radial change in the age of the stellar population.
7 Acknowledgements
The support for STAGES was provided by NASA through GO-10395 from STScI operated by AURA under NAS5-26555. DTM and BH were supported by STFC. MEG was supported by an STFC Advanced Fellowship. SJ acknowledges support from the National Aeronautics and Space Administration (NASA) LTSA grant NAG5-13063, NSF grant AST-0607748, and HST grants GO-11082 from STScI, which is operated by AURA, Inc., for NASA, under NAS5-26555. We would also like to thank Ignacio Trujillo for useful discussions.
References
- Azzollini et al. (2008) Azzollini R., Trujillo I., Beckman J. E., 2008, ApJ, 684, 1026
- Bakos et al. (2008) Bakos J., Trujillo I., Pohlen M., 2008, ApJ, 683, L103
- Bland-Hawthorn et al. (2005) Bland-Hawthorn J., Vlajić M., Freeman K. C., Draine B. T., 2005, ApJ, 629, 239
- Borch et al. (2006) Borch A., Meisenheimer K., Bell E. F., Rix H.-W., Wolf C., Dye S., Kleinheinrich M., Kovacs Z., Wisotzki L., 2006, A&A, 453, 869
- Bournaud et al. (2007) Bournaud F., Elmegreen B. G., Elmegreen D. M., 2007, ApJ, 670, 237
- Buitrago et al. (2008) Buitrago F., Trujillo I., Conselice C. J., Bouwens R. J., Dickinson M., Yan H., 2008, ApJ, 687, L61
- de Vaucouleurs (1959) de Vaucouleurs G., 1959, Handbuch der Physik, 53, 311
- Debattista et al. (2006) Debattista V. P., Mayer L., Carollo C. M., Moore B., Wadsley J., Quinn T., 2006, ApJ, 645, 209
- Elmegreen & Parravano (1994) Elmegreen B. G., Parravano A., 1994, ApJ, 435, L121+
- Erwin et al. (2005) Erwin P., Beckman J. E., Pohlen M., 2005, ApJ, 626, L81
- Ferguson et al. (2007) Ferguson A., Irwin M., Chapman S., Ibata R., Lewis G., Tanvir N., 2007, Resolving the Stellar Outskirts of M31 and M33. pp 239–+
- Foyle et al. (2008) Foyle K., Courteau S., Thacker R. J., 2008, MNRAS, 386, 1821
- Freeman (1970) Freeman K. C., 1970, ApJ, 160, 811
- Giavalisco et al. (2004) Giavalisco M., Ferguson H. C., Koekemoer A. M., Dickinson M., et al. 2004, ApJ, 600, L93
- Gray et al. (2009) Gray M. E., Wolf C., Barden M., Peng C. Y., Häußler B., Bell E. F., McIntosh D. H., et al. 2009, MNRAS, 393, 1275
- Gunn & Gott (1972) Gunn J. E., Gott J. R. I., 1972, ApJ, 176, 1
- Heiderman et al. (2009) Heiderman A., Jogee S., Marinova I., van Kampen E., Barden M., Peng C. Y., Heymans C., Gray M. E., et al. 2009, ApJ, 705, 1433
- Ibata et al. (2005) Ibata R., Chapman S., Ferguson A. M. N., Lewis G., Irwin M., Tanvir N., 2005, ApJ, 634, 287
- Jedrzejewski (1987) Jedrzejewski R. I., 1987, MNRAS, 226, 747
- Kennicutt (1989) Kennicutt Jr. R. C., 1989, ApJ, 344, 685
- Maltby et al. (2010) Maltby D. T., Aragón-Salamanca A., Gray M. E., Barden M., Häußler B., Wolf C., Peng C. Y., Jahnke K., McIntosh D. H., Böhm A., van Kampen E., 2010, MNRAS, 402, 282
- Marinova et al. (2009) Marinova I., Jogee S., Heiderman A., Barazza F. D., Gray M. E., Barden M., Wolf C., Peng C. Y., et al. 2009, ApJ, 698, 1639
- Moore et al. (1996) Moore B., Katz N., Lake G., Dressler A., Oemler A., 1996, Nature, 379, 613
- Okamoto & Nagashima (2004) Okamoto T., Nagashima M., 2004, in Diaferio A., ed., IAU Colloq. 195: Outskirts of Galaxy Clusters: Intense Life in the Suburbs The roles of ram-pressure stripping and minor mergers in the evolution of galaxies. pp 534–538
- Patterson (1940) Patterson F. S., 1940, Harvard College Observatory Bulletin, 914, 9
- Peng et al. (2002) Peng C. Y., Ho L. C., Impey C. D., Rix H.-W., 2002, AJ, 124, 266
- Pérez (2004) Pérez I., 2004, A&A, 427, L17
- Pohlen et al. (2002) Pohlen M., Dettmar R., Lütticke R., Aronica G., 2002, A&A, 392, 807
- Pohlen & Trujillo (2006) Pohlen M., Trujillo I., 2006, A&A, 454, 759
- Pohlen et al. (2007) Pohlen M., Zaroubi S., Peletier R. F., Dettmar R., 2007, MNRAS, 378, 594
- Roškar et al. (2008) Roškar R., Debattista V. P., Quinn T. R., Stinson G. S., Wadsley J., 2008, ApJ, 684, L79
- Roškar et al. (2008) Roškar R., Debattista V. P., Stinson G. S., Quinn T. R., Kaufmann T., Wadsley J., 2008, ApJ, 675, L65
- Schaye (2004) Schaye J., 2004, ApJ, 609, 667
- Sérsic (1968) Sérsic J. L., 1968, Atlas de galaxias australes. Cordoba, Argentina: Observatorio Astronomico, 1968
- The & White (1986) The L. S., White S. D. M., 1986, AJ, 92, 1248
- Trujillo & Pohlen (2005) Trujillo I., Pohlen M., 2005, ApJ, 630, L17
- van der Kruit (1979) van der Kruit P. C., 1979, A&AS, 38, 15
- van der Kruit (2007) van der Kruit P. C., 2007, A&A, 466, 883
- Wolf et al. (2009) Wolf C., Aragón-Salamanca A., Balogh M., Barden M., Bell E. F., Gray M. E., Peng C. Y., et al. 2009, MNRAS, 393, 1302
- Wolf et al. (2008) Wolf C., Hildebrandt H., Taylor E. N., Meisenheimer K., 2008, A&A, 492, 933
- Wolf et al. (2004) Wolf C., Meisenheimer K., Kleinheinrich M., Borch A., Dye S., Gray M., Wisotzki L., Bell E. F., Rix H.-W., Cimatti A., Hasinger G., Szokoly G., 2004, A&A, 421, 913
- Wolf et al. (2003) Wolf C., Meisenheimer K., Rix H.-W., Borch A., Dye S., Kleinheinrich M., 2003, A&A, 401, 73
- York et al. (2000) York D. G., Adelman J., Anderson Jr. J. E., Anderson S. F., Annis J., Bahcall N. A., Bakken J. A., et al. 2000, AJ, 120, 1579
- Younger et al. (2007) Younger J. D., Cox T. J., Seth A. C., Hernquist L., 2007, ApJ, 670, 269