119–126
White Dwarf Model Atmospheres:
Synthetic Spectra for Super Soft Sources
Abstract
The Tübingen NLTE Model-Atmosphere Package (TMAP) calculates fully metal-line blanketed white dwarf model atmospheres and spectral energy distributions (SEDs) at a high level of sophistication. Such SEDs are easily accessible via the German Astrophysical Virtual Observatory (GAVO) service TheoSSA. We discuss applications of TMAP models to (pre) white dwarfs during the hottest stages of their stellar evolution, e.g. in the parameter range of novae and super soft sources.
keywords:
astronomical data bases: miscellaneous, stars: abundances, stars: AGB and post-AGB, stars: atmospheres, stars: binaries (including multiple): close, stars: early-type, stars: individual (V 4743 Sgr, V 1974 Cyg), stars: novae, cataclysmic variables, stars: winds, outflows, X-rays: bursts1 Introduction
Novae in outburst may become the brightest sources of soft X-ray emission in the sky. During this so-called super soft source (SSS) phase (some weeks or months after the outburst), it is possible to perform high-resolution and high-S/N spectroscopy with X-ray satellites like Chandra or XMM-Newton. These spectra require adequate NLTE model atmospheres for a reliable analysis.
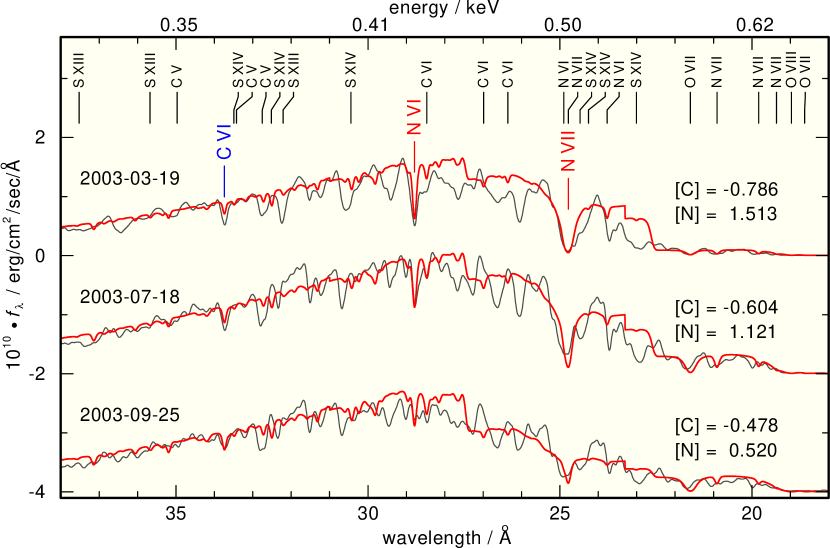
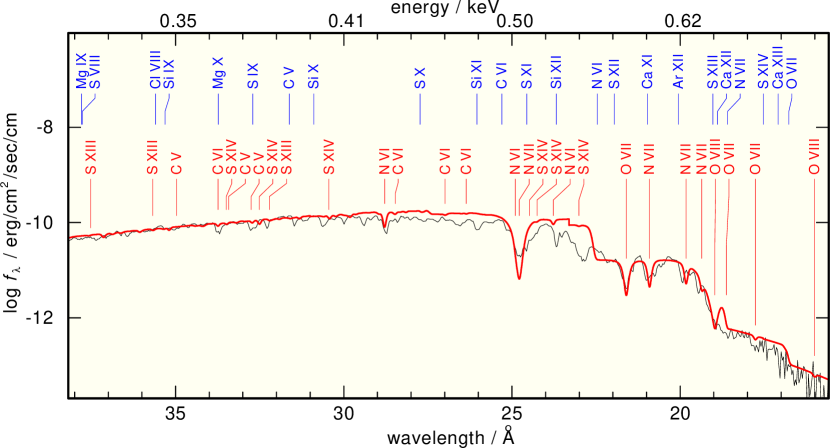
A detailed analysis of such a nova, V 4743 Sgr, was recently presented by [Rauch et al. (2010)]. They used plane-parallel, hydrostatic models calculated with the Tübingen NLTE Model-Atmosphere Package ([Werner et al. (2003), Rauch & Deetjen (2003), TMAP111http://astro.uni-tuebingen.de/∼TMAP/TMAP.html, Werner et al. 2003, Rauch & Deetjen 2003]). Although the velocity field and the expansion of the nova’s atmosphere was neglected, the overall slope of the continuum flux was well reproduced. Moreover, the strengths of prominent photospheric absorption lines (C v, C vi, N vi, N vii, O vii) as well as the strengths of absorption edges were in very good agreement with the observation (Fig. 1, 2). [Rauch et al. (2010)] could e.g. show that the C/N abundance ratio was increasing from March to September 2003 (Fig. 1).
2 Model Atmospheres for SSSs
TMAP model atmospheres were successfully employed for spectral analyses of hot, compact stars. See [Rauch & Werner (2010)] and [Rauch (2011)] for a brief summary of this application to a variety of objects from post-AGB stars () to neutron stars in low-mass X-ray binaries ().
What do we need to analyze X-ray spectra taken during the SSS phase following a nova outburst reliably? The evolution of both stars has to be modeled, including e.g. stellar rotation, mass-loss history, common-envelope phase, and a long series of outbursts. Thus, 3-dimensional magneto-hydrodynamical calculations that follow the stars for a long time are definitely the best choice. In addition, 3D NLTE radiation transfer, accounting for the expanding atmosphere and mass loss not only during the outburst, clumping in the ejected matter, etc. is necessary. This should be combined with 3D photoionization modeling to describe the surrounding gas and dust. Although all these state-of-the-art ingredients are already available, their combination and application to an individual nova system is still a dream.
In the case of V 4743 Sgr, [Ness et al. (2003)] measured a blueshift () in the Chandra spectrum. This strong evidence for expansion was found in the SSS spectra of other novae as well ([Ness (2010), Ness 2010]). A new version of the multi-purpose model-atmosphere code PHOENIX ([Hauschildt & Baron (1999), Hauschildt & Baron 1999]) accounts for this expansion ([van Rossum & Ness (2010), van Rossum & Ness 2010]). These models predict typical wind effects that are already known from the UV wavelength range in cooler post-AGB stars. In the relevant parameter range for SSSs, the model flux for () is increasing with the mass-loss rate and absorption edges of C vi (25.30 Å), N vii (18.59 Å), and O vii (16.77 Å) become weaker. From these results, one has to conclude that, of course only in case of higher mass-loss rates (), spectral analyses of SSSs based on hydrostatic model atmospheres tend to overestimate and metal abundances.
The question remains, why do the static TMAP models reproduce the observations that well (Fig. 2)? The answer may be very simple – the strong mass-loss phase of V 4743 Sgr is over. Obviously, there are no P Cygni line profiles observed and thus, the “wind-blown” material around V 4743 Sgr is not dense enough to provide the emission. The matter in the line of sight is still moving towards us and thus, we see blueshifted, pure absorption lines. An approach like presented by [Rauch et al. (2010)] appears well justified. It is possible that accretion already takes place and changes the C/N abundance ratio (Sect. 1).
3 TheoSSA - SSSs Model Spectra on Demand
TheoSSA222Theoretical Stellar Spectra Access is a registered Virtual Observatory333http://www.ivoa.net (VO) service developed by the German Astrophysical Virtual Observatory GAVO444http://www.g-vo.org. It provides access to SEDs at three levels: 1) pre-calculated SED grids for a fast comparison with observations can be downloaded, 2) SEDs with individual parameters (and provided standard model atoms from the Tübingen Model-Atom Database, TMAD555http://astro.uni-tuebingen.de/∼TMAD/TMAD.html) can be calculated666http://astro.uni-tuebingen.de/∼TMAW/TMAW.shtml without knowledge of the model-atmosphere code, 3) SEDs with individual parameters and self-constructed model atoms can be computed by experienced users. TheoSSA was firstly based on TMAP models only but it is prepared for SEDs from any other stellar model-atmosphere code.
Pre-calculated grids of SEDs for SSSs ([Rauch & Werner (2010), cf. Rauch & Werner 2010]) are also easily accessible in VO-compliant form via TheoSSA’s WWW interface777http://dc.g-vo.org/theossa. In case of any request, we will calculate new grids with different abundances.
In addition, some SED grids for SSSs (, [Rauch & Werner (2010), Rauch & Werner 2010]) are available converted into atables888http://astro.uni-tuebingen.de/∼rauch/TMAF/flux_HHeCNONeMgSiS_gen.html for the direct use within XSPEC999http://heasarc.gsfc.nasa.gov/docs/xanadu/xspec.
4 Conclusions
Spectral energy distributions for SSSs (calculated with TMAP) are easily available via TheoSSA – use them! Blackbody energy distributions generally have – at the same temperature – a much lower peak intensity (about a factor of three in the parameter range of SSSs, [Rauch et al. (2010), Rauch et al. 2010]) and the flux maximum is located towards lower energies (about a factor of two). Thus, “spectral analyses” based on blackbodies yield wrong results.
There are novae that are observed in their SSS phase where the impact of mass-loss is not significant. For these objects, analyses based on static model atmospheres like TMAP provide reliable results within typical error ranges ([Rauch et al. (2010), Rauch et al. 2010]). In case of prominent P Cygni line profiles, however, a code like PHOENIX has to be employed.
A time series (about all three months) of V 4743 Sgr X-ray observations has shown that the white dwarf’s surface is extremely hot ( higher that 500 000 K) for at least half a year ([Rauch et al. (2010), Rauch et al. 2010]). The phase of increasing appears important because the mass-loss rate will be presumably higher and, hence, expanding model atmospheres can be used to study wind properties.
A time series of X-ray spectra on a short time scale (about weekly) starting at an early outburst phase and covering the SSS phase like taken e.g. for Nova V 1974 Cyg in the ultraviolet with IUE101010International Ultraviolet Explorer (cf. [González-Riestra & Krautter (1998), González-Riestra & Krautter 1998]) is highly desirable. Since Chandra and XMM-Newton will unfortunately not work forever, such spectra have to be taken in the very near future. The development of appropriate, reliable model atmospheres is already on the way.
Acknowledgements.
This work is supported by the German Aerospace Center (DLR, grant 05 OR 0806), the German Research Foundation (DFG, grant WE 1312/411), and the Federal Ministry of Education and Research (BMBF, grant 05A11VTB).References
- [González-Riestra & Krautter (1998)] González-Riestra, R., & Krautter, J. 1998, in: W. Wamsteker, R. González-Riestra (eds.), Ultraviolet Astrophysics Beyond the IUE Final Archive, ESA SP, 413, 367
- [Hauschildt & Baron (1999)] Hauschildt, P. H., & Baron, E. 1999, J. of Computational and Applied Mathematics, 109, 41
- [Ness et al. (2003)] Ness, J.-U., Starrfield, S., Burwitz, V., et al. 2003, ApJ, 594, L 127
- [Ness (2010)] Ness, J.-U. 2010, AN, 331, 179
- [Rauch (2011)] Rauch, T. 2011, in: The X-ray Universe 2011, available online at: http://xmm.esac.esa.int/ external/xmm_science/workshops/2011symposium/, 61
- [Rauch et al. (2010)] Rauch, T., Orio, M., Gonzáles-Riestra, R., Nelson, T., et al. 2010, ApJ, 717, 363
- [Rauch & Deetjen (2003)] Rauch, T., & Deetjen, J. L. 2003, in: I. Hubeny, D. Mihalas, K. Werner (eds.), Stellar Atmosphere Modeling, The ASP Conference Series (San Francisco: ASP), 288, 103
- [Rauch & Werner (2010)] Rauch, T., & Werner, K. 2010, AN, 331, 146
- [Rauch et al. (2011)] Rauch, T., Ringat, E., & Werner, K. 2011, Universal Academy Press, in press, arXiv:1011.3628
- [van Rossum & Ness (2010)] van Rossum, D. R., & Ness, J.-U. 2010, AN, 331, 175
- [Werner et al. (2003)] Werner, K., Dreizler, S., Deetjen, J. L., Nagel, T., Rauch, T., & Schuh, S. L. 2003, in: I. Hubeny, D. Mihalas, K. Werner (eds.), Stellar Atmosphere Modeling, The ASP Conference Series (San Francisco: ASP), 288, 31